
Temporal and spatial variation characteristics of extreme precipitation on the Loess Plateau of China facing the precipitation process
Received date: 2022-06-08
Revised date: 2022-09-22
Accepted date: 2022-10-05
Online published: 2023-04-30
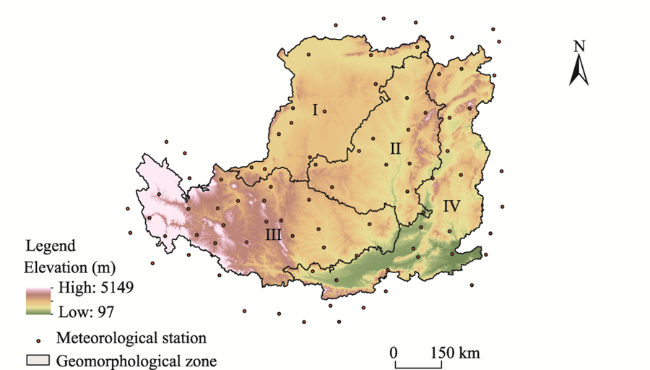
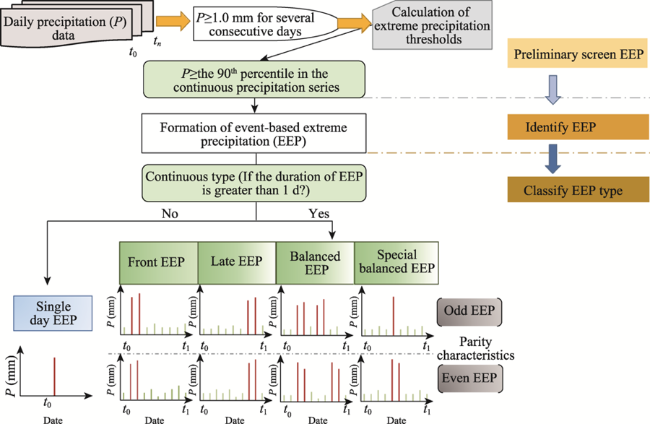
The preceding and succeeding precipitation (PSP) often act together with extreme precipitation (EP), in turn, causing floods, which is an objective component that is often overlooked with regard to summer flood hazards in the arid region of Northwest China. In this study, event-based extreme precipitation (EEP) was defined as continuous precipitation that includes at least one day of EP. We analyzed the spatiotemporal variation characteristics of four EEP types (front EEP, late EEP, balanced EEP, and single day EEP) across the Loess Plateau (LP) based on data acquired from 87 meteorological stations from 1960 to 2019. Precipitation on the LP basically maintained a spatial pattern of "low in the northwest region and high in the southeast region", and EP over the last 10 a increased significantly. The cumulative precipitation percentage of single day EEP was 34% and was dominant for 60 a, while the cumulative precipitation percentage of front, late, and balanced EEP types associated with PSP accounted for 66%, which confirms to the connotation of EEP. The cumulative frequencies of front and late EEP types were 23% and 21%, respectively, while the cumulative frequency of balanced EEP had the lowest value at only 13%. Moreover, global warming could lead to more single day EEP across the LP, and continuous EEP could increase in the northwestern region and decrease in the eastern region in the future. The concept of process-oriented EP could facilitate further exploration of disaster-causing processes associated with different types of EP, and provide a theoretical basis for deriving precipitation disaster chains and construction of disaster cluster characteristics.
ZHANG Yixin , LI Peng , XU Guoce , MIN Zhiqiang , LI Qingshun , LI Zhanbin , WANG Bin , CHEN Yiting . Temporal and spatial variation characteristics of extreme precipitation on the Loess Plateau of China facing the precipitation process[J]. Journal of Arid Land, 2023 , 15(4) : 439 -459 . DOI: 10.1007/s40333-023-0098-0
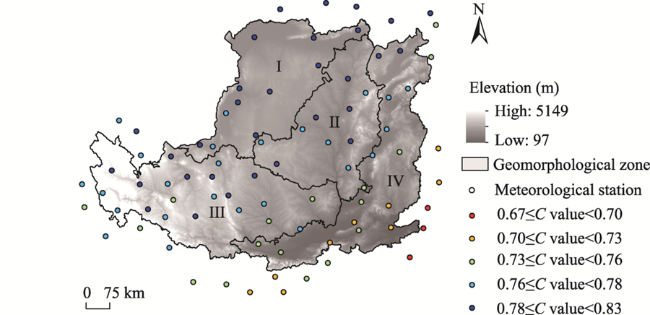
Fig. 1 Overview of the study area and spatial distribution of the four geomorphological zones. Zone I, northern aeolian sandy agricultural irrigation area; Zone II, hilly and gully area; Zone III, plateau and gully area; Zone IV, eastern river valley and rocky mountainous area. |
Table 1 Definition of extreme precipitation (EP) indices used in this study |
| Index | Definition | Unit |
|---|---|---|
| Annual total wet-day precipitation (PRCPTOT) | Sum of annual precipitation | mm |
| Annual total erosive precipitation (R12TOT) | Sum of precipitation≥12.0 mm | mm |
| Annual total extreme heavy precipitation (R50TOT) | Sum of precipitation≥50.0 mm | mm |
| Total precipitation on very wet days (90pTOT) | Sum of precipitation with daily precipitation≥90th percentile | mm |
| Wet days (Pday) | Sum of annual precipitation days | d |
| Wet days in flood season (FSPday) | Sum of precipitation days in flood season | d |
| Simple precipitation intensity index (SDII) | Average precipitation in precipitation days | mm/d |
Fig. 2 Identification and classification of EEP types. t0, t1, and tn represent the start date, end date, and any day of EEP, respectively. The red bars denote extreme precipitation (EP; P≥the 90th percentile in the continuous precipitation series) and the green bars represent non EP (P<the 90th percentile in the continuous precipitation series). |
Table 2 Cross-validation results of spatial interpolation of precipitation |
| Type | Element | Signal | SNR | RMSE | RTVAR |
|---|---|---|---|---|---|
| Precipitation average | 1960-1989 | 15.1 | 0.41 | 19.4000 | 35.1000 |
| 1970-1999 | 12.0 | 0.37 | 13.5000 | 38.6000 | |
| 1980-2009 | 18.3 | 0.43 | 20.3000 | 50.5000 | |
| 1990-2019 | 14.9 | 0.38 | 24.6000 | 40.1000 | |
| 2000-2019 | 15.6 | 0.32 | 19.1000 | 46.4000 | |
| 2010-2019 | 17.2 | 0.37 | 19.9000 | 40.6000 | |
| Cumulative EEP frequency | Front EEP | 10.9 | 0.23 | 0.0071 | 0.0155 |
| Late EEP | 9.7 | 0.17 | 0.0068 | 0.0142 | |
| Balanced EEP | 11.4 | 0.21 | 0.0082 | 0.0193 | |
| Single day EEP | 9.5 | 0.19 | 0.0067 | 0.0167 | |
| Cumulative EEP volume | Front EEP | 8.9 | 0.24 | 0.0072 | 0.0199 |
| Late EEP | 11.3 | 0.18 | 0.0070 | 0.0224 | |
| Balanced EEP | 11.9 | 0.23 | 0.0056 | 0.0152 | |
| Single day EEP | 10.4 | 0.21 | 0.0091 | 0.0221 |
Note: EEP, event-based extreme precipitation; signal, the effective parameters or fitting spline degrees of freedom; SNR, signal-to-noise ratio; RMSE, root mean square error; RTVAR, the estimate of the standard deviation of the noise in the spline model. |
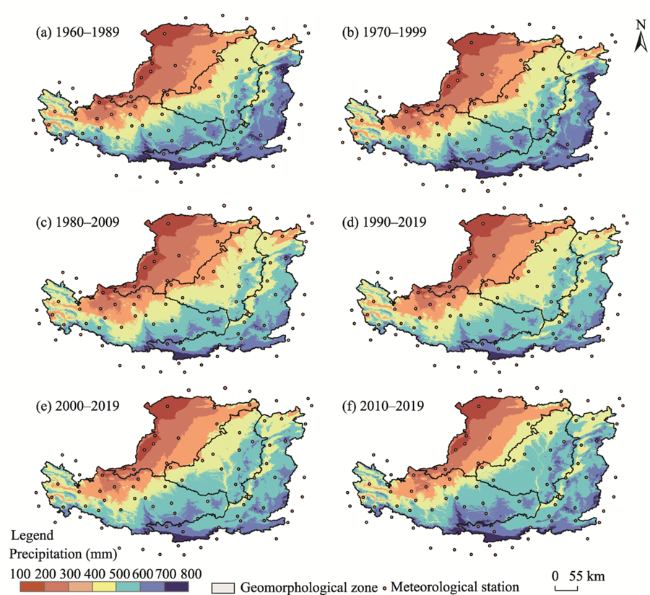
Fig. 3 Changes of the spatial patterns of precipitation during 1960-1989 (a), 1970-1999 (b), 1980-2009 (c), 1990-2019 (d), 2000-2019 (e), and 2010-2019 (f) |
Table 3 Changes of typical isoprecipitation belts in the study area |
| PRCPTOT (mm) | 1960-1989 | 1970-1999 | 1980-2009 | 1990-2019 | 2000-2019 | 2010-2019 | ||||||
|---|---|---|---|---|---|---|---|---|---|---|---|---|
| Area ratio (%) | Change rate (%) | Area ratio (%) | Change rate between 1960-1989 and 1970-1999 (%) | Area ratio (%) | Change rate between 1970-1999 and 1980-2009 (%) | Area ratio (%) | Change rate between 1980-2009 and 1990-2019 (%) | Area ratio (%) | Change rate between 1990-2019 and 2000-2019 (%) | Area ratio (%) | Change rate between 1960-1989 and 2010-2019 (%) | |
| ≤200.0 | 5.31 | - | 5.08 | -4.33 | 5.82 | 12.71 | 4.84 | -16.84 | 4.61 | -4.75 | 3.81 | -28.25 |
| 200.0-300.0 | 13.53 | - | 14.30 | 5.69 | 13.81 | -3.55 | 11.10 | -19.62 | 11.09 | -0.09 | 9.31 | -31.19 |
| 300.0-400.0 | 14.27 | - | 16.05 | 12.47 | 16.59 | 3.25 | 16.46 | -0.78 | 14.97 | -9.05 | 12.21 | -14.44 |
| 400.0-500.0 | 23.08 | - | 26.77 | 15.99 | 27.51 | 2.69 | 29.26 | 6.36 | 26.69 | -8.78 | 20.51 | -11.14 |
| 500.0-600.0 | 24.11 | - | 25.37 | 5.23 | 26.50 | 4.26 | 28.63 | 8.04 | 29.93 | 4.54 | 36.44 | 51.14 |
| 600.0-700.0 | 15.75 | - | 10.25 | -34.92 | 8.12 | -26.23 | 8.47 | 4.31 | 10.98 | 29.63 | 14.66 | -6.92 |
| ≥700.0 | 3.95 | - | 2.18 | -44.81 | 1.65 | -32.12 | 1.24 | -24.85 | 1.73 | 39.52 | 3.06 | -22.53 |
Note: PRCPTOT represents the annual total wet-day precipitation and "-" denotes no data. |
Table 4 Changes of typical EP belts in the study area |
| 90pTOT (mm) | 1960-1989 | 1970-1999 | 1980-2009 | 1990-2019 | 2000-2019 | 2010-2019 | ||||||
|---|---|---|---|---|---|---|---|---|---|---|---|---|
| Area ratio (%) | Change rate (%) | Area ratio (%) | Change rate between 1960-1989 and 1970-1999 (%) | Area ratio (%) | Change rate between 1970-1999 and 1980-2009 (%) | Area ratio (%) | Change rate between 1980-2009 and 1990-2019 (%) | Area ratio (%) | Change rate between 1990-2019 and 2000-2019 (%) | Area ratio (%) | Change rate between 1960-1989 and 2010-2019 (%) | |
| ≤100.0 | 6.01 | - | 4.71 | -21.63 | 5.43 | 15.29 | 3.85 | -29.10 | 4.56 | 18.44 | 3.03 | -49.58 |
| 100.0-200.0 | 35.09 | - | 33.10 | -5.67 | 34.66 | 4.71 | 27.61 | -20.34 | 30.25 | 9.56 | 20.34 | -42.03 |
| 200.0-300.0 | 47.56 | - | 51.38 | 8.03 | 51.83 | 0.88 | 59.83 | 15.44 | 56.97 | -4.78 | 49.12 | 3.28 |
| 300.0-400.0 | 10.80 | - | 10.31 | -4.54 | 7.56 | -26.67 | 8.24 | 8.99 | 7.67 | -6.92 | 26.33 | 143.80 |
| ≥400.0 | 0.54 | - | 0.50 | -7.41 | 0.52 | 4.00 | 0.47 | -9.62 | 0.54 | 14.89 | 1.17 | 116.67 |
Note: 90pTOT represents total precipitation on very wet days and "-" denotes no data. |
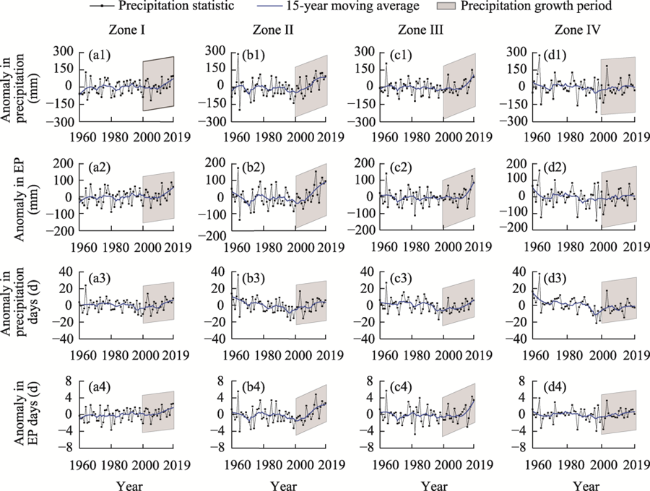
Fig. 4 Variations in precipitation and extreme precipitation (EP) in Zone I (a1-a4), Zone II (b1-b4), Zone III (c1-c4), and Zone IV (d1-d4) from 1960 to 2019 |
Table 5 Inter-annual variation trends of EP indices from 1960 to 2019 |
| Index | Zone I | Zone II | Zone III | Zone IV | Total area | |||||
|---|---|---|---|---|---|---|---|---|---|---|
| Slope# | Mean | Slope# | Mean | Slope# | Mean | Slope# | Mean | Slope# | Mean | |
| PRCPTOT (mm) | 0.60 | 246.00 | 1.08 | 438.50 | 0.42 | 409.20 | -0.26 | 536.10 | 0.38 | 407.50 |
| R12TOT (mm) | 0.48 | 127.10 | 0.98 | 255.60 | 0.42 | 204.20 | -0.09 | 343.20 | 0.42 | 232.50 |
| R50TOT (mm) | 0.01 | 18.40 | 0.17 | 38.80 | 0.16* | 19.60 | -0.38* | 72.30 | -0.01 | 37.30 |
| 90pTOT (mm) | 0.37 | 127.30 | 0.52 | 216.20 | 0.33 | 196.60 | -0.22 | 277.70 | 0.33 | 204.40 |
| Pday (d) | -0.04 | 54.20 | -0.12* | 78.20 | -0.15 | 90.10 | -0.25* | 83.60 | -0.15* | 76.50 |
| FSPday (d) | -0.01 | 32.60 | -0.06 | 42.40 | -0.10* | 47.20 | -0.12* | 42.50 | -0.08* | 41.20 |
| SDII (mm/d) | 0.01* | 4.40 | 0.02* | 5.60 | 0.01* | 4.50 | 0.02* | 6.40 | 0.01* | 5.22 |
Note: # represents that the slope is dimensionless and * indicates significant trend (P<0.05). |
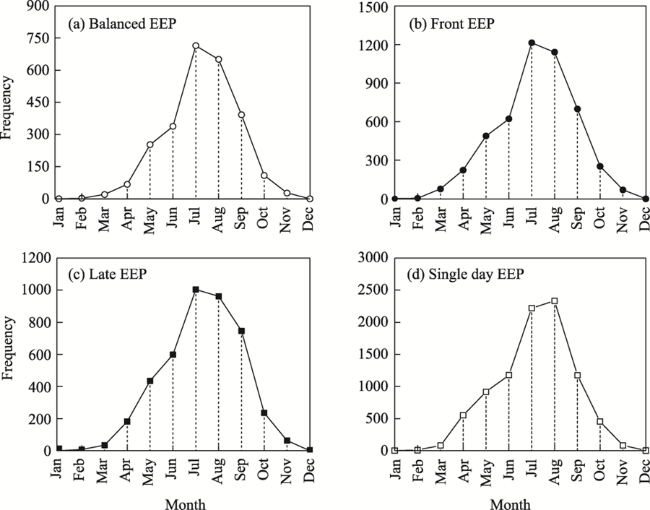
Fig. 5 Characteristics of the intra-annual change of balanced EEP (a), front EEP (b), late EEP (c), and single day EEP (d) from 1960 to 2019 |
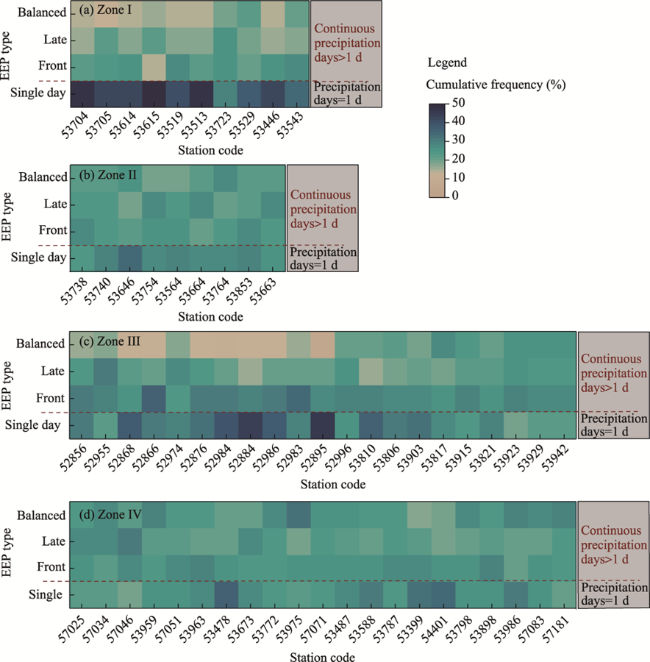
Fig. 6 Cumulative frequency of the four EEP types in Zone I (a), Zone II (b), Zone III (c), and Zone IV (d) |
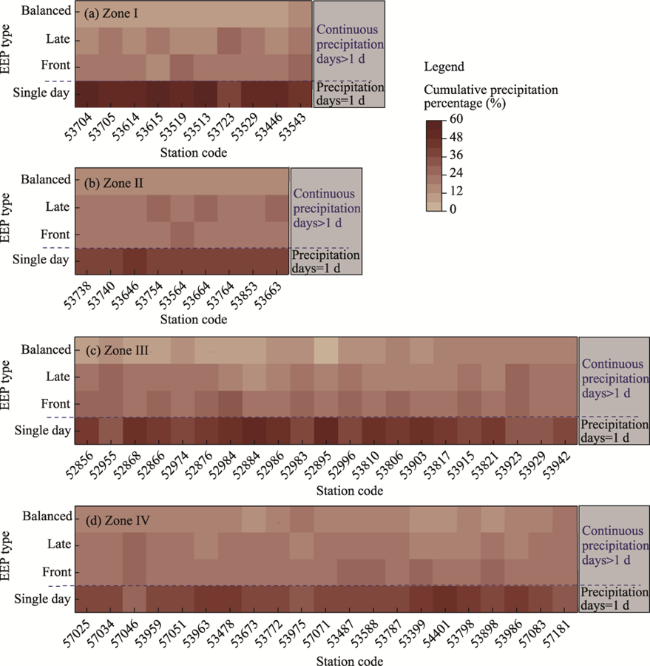
Fig. 7 Cumulative precipitation percentage of the four EEP types in Zone I (a), Zone II (b), Zone III (c), and Zone IV (d) |
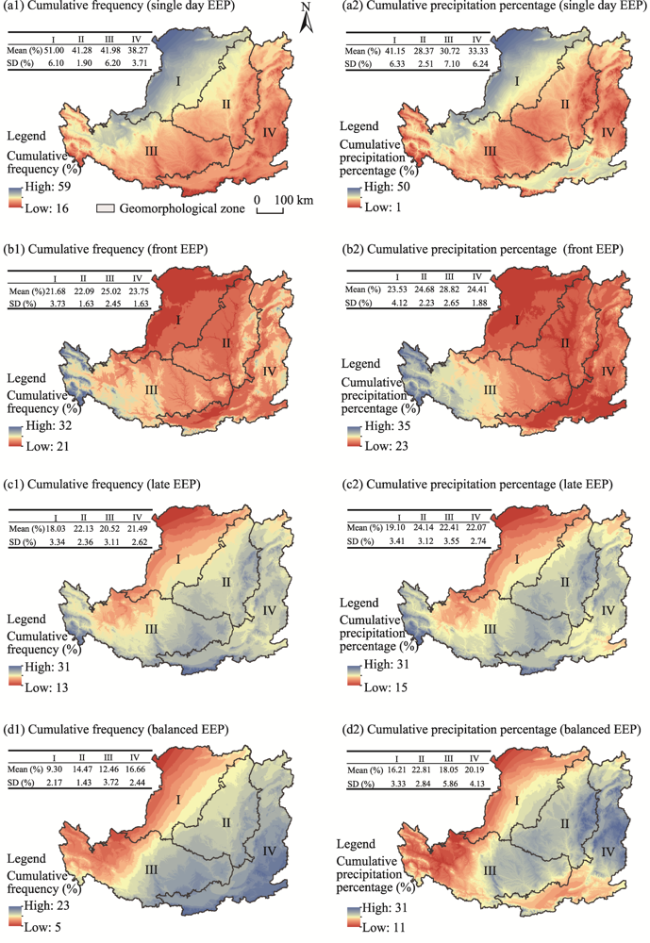
Fig. 8 Spatial distribution of cumulative frequency and cumulative precipitation percentage of single day EEP (a1 and a2, respectively), front EEP (b1 and b2, respectively), late EEP (c1 and c2, respectively), and balanced EEP (d1 and d2, respectively) |
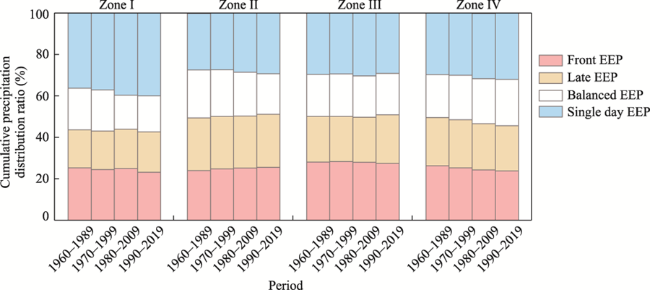
Fig. 9 Cumulative precipitation distribution ratio of the four EEP types during different periods |
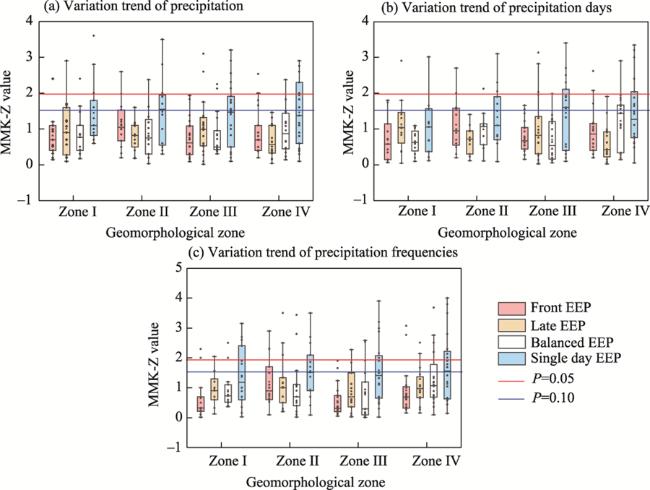
Fig. 10 Variation trend of precipitation (a), precipitation days (b), and precipitation frequencies (c) of the four EEP types. MMK-Z value is the standard normalization statistic in the modified Mann-Kendall (MMK) test. The box represents the significant characteristics of precipitation trends for the four EEP types at stations in different zones. The short border of the boxes represents the range from the lower quantile (Q25) to the upper quantile (Q75). The dots and horizontal lines inside the boxes represent the means and medians, respectively. The dots outside the boxes represent outliers. The upper and lower whiskers indicate the maximum and minimum values, respectively. |
Fig. 11 Spatial distribution of the C value. C value represents the contribution of EP to EEP. |
Table 6 Correlations between EEP types and temperature on the Loess Plateau |
| EEP type | Index | Zone I | Zone II | Zone III | Zone IV | ||||
|---|---|---|---|---|---|---|---|---|---|
| Correlation coefficient | Sig | Correlation coefficient | Sig | Correlation coefficient | Sig | Correlation coefficient | Sig | ||
| Front EEP | Precipitation | -0.15 | 0.57 | 0.27* | 0.98 | 0.44 | 0.77 | -0.23 | 0.59 |
| Day | -0.21 | 0.71 | 0.10 | 0.45 | 0.38 | 0.63 | -0.29 | 0.43 | |
| Frequency | -0.15 | 0.81 | 0.10* | 0.95 | 0.41 | 0.34 | -0.25 | 0.82 | |
| Late EEP | Precipitation | 0.25* | 0.99 | 0.25 | 0.46 | 0.25* | 1.00 | -0.34 | 0.76 |
| Day | 0.35* | 0.98 | 0.43 | 0.35 | 0.36 | 0.67 | -0.46 | 0.35 | |
| Frequency | 0.18 | 0.54 | 0.20 | 0.79 | 0.17 | 0.56 | -0.09 | 0.75 | |
| Balanced EEP | Precipitation | 0.11 | 0.43 | 0.23 | 0.58 | 0.18 | 0.83 | -0.27* | 0.98 |
| Day | 0.31 | 0.33 | 0.13 | 0.49 | 0.26 | 0.38 | -0.36* | 0.97 | |
| Frequency | 0.08 | 0.50 | 0.19 | 0.42 | 0.13 | 0.72 | -0.20 | 0.65 | |
| Single day EEP | Precipitation | 0.44* | 1.00 | 0.49* | 1.00 | 0.40* | 1.00 | 0.51* | 1.00 |
| Day | 0.49* | 0.99 | 0.42* | 0.99 | 0.38* | 1.00 | 0.49* | 1.00 | |
| Frequency | 0.31* | 0.99 | 0.41* | 0.99 | 0.38* | 1.00 | 0.44* | 0.99 | |
Note: Sig is significance value. * represents the significant correlations between EEP and temperature at P<0.05 level. |
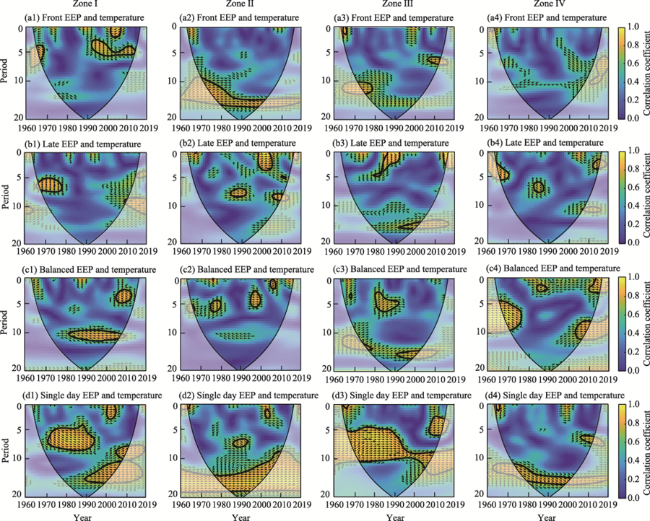
Fig. 12 Wavelet coherence analysis of the four EEP types and temperature in Zone I (a1-a4), Zone II (b1-b4), Zone III (c1-c4), and Zone IV (d1-d4). The thick black contour designates the correlations beyond the 95% significance level against the red noise. The cone of influence where edge effects might distort the picture is shown as a lighter shade. The relative phase relationship is indicated by the arrow direction, with in-phase pointing right and anti-phase pointing left. The color bar on the right denotes correlation coefficient, with 0.0 representing no correlation and 1.0 indicating strong relationship. |
| [1] |
|
| [2] |
|
| [3] |
|
| [4] |
|
| [5] |
|
| [6] |
|
| [7] |
|
| [8] |
|
| [9] |
|
| [10] |
|
| [11] |
|
| [12] |
|
| [13] |
|
| [14] |
|
| [15] |
|
| [16] |
|
| [17] |
|
| [18] |
|
| [19] |
|
| [20] |
|
| [21] |
|
| [22] |
|
| [23] |
IPCC. 2014. Climate Change 2014: Synthesis Report:Contribution of Working Groups I, II and III to the Fifth Assessment Report of the Intergovernmental Panel on Climate Change. [2022-01-10]. https://www.ipcc.ch/report/ar5/syr/.
|
| [24] |
IPCC. 2021. Climate Change 2021:The Physical Science Basis. Contribution of Working Group I to the Sixth Assessment Report of the Intergovernmental Panel on Climate Change. [2022-02-15].
|
| [25] |
|
| [26] |
|
| [27] |
|
| [28] |
|
| [29] |
|
| [30] |
|
| [31] |
|
| [32] |
|
| [33] |
|
| [34] |
|
| [35] |
|
| [36] |
|
| [37] |
|
| [38] |
|
| [39] |
|
| [40] |
|
| [41] |
|
| [42] |
|
| [43] |
|
| [44] |
|
| [45] |
|
| [46] |
|
| [47] |
|
| [48] |
|
| [49] |
|
| [50] |
|
| [51] |
|
| [52] |
|
| [53] |
|
| [54] |
|
| [55] |
|
| [56] |
|
| [57] |
|
| [58] |
|
| [59] |
|
| [60] |
|
| [61] |
|
| [62] |
|
| [63] |
|
| [64] |
|
| [65] |
|
/
| 〈 |
|
〉 |