Research article

Investigating the causes of Lake Urmia shrinkage: climate change or anthropogenic factors?

  • Mehri SHAMS GHAHFAROKHI 1 ,
  • Sogol MORADIAN , 2, *
Expand
  • 1Department of Social Sciences, University of Isfahan, Isfahan 81746-73441, Iran
  • 2Department of Civil Engineering, University of Galway, Galway H91TK33, Ireland
*Sogol MORADIAN (E-mail: )

Received date: 2022-08-12

  Revised date: 2022-11-21

  Accepted date: 2022-12-14

  Online published: 2023-04-30

Abstract

In the current scenario, Lake Urmia, one of the vastest hyper saline lakes on the Earth, has been affected by serious environmental degradation. Using different satellite images and observational data, this study investigated the changes in the lake for the period 1970-2020 based on the effects of climate change and several human-induced processes on Lake Urmia, such as population growth, excessive dam construction, low irrigation water use efficiency, poor water resources management, increased sediment flow into the lake, and lack of political and legal frameworks. The results indicated that between 1970 and 1997, the process of change in Lake Urmia was slow; however; the shrinkage was faster between 1998 and 2018, with about 30.00% of the lake area disappearing. As per the findings, anthropogenic factors had a much greater impact on Lake Urmia than climate change and prolonged drought; the mismanagement of water consumption in the agricultural sector and surface and underground water withdrawals in the basin have resulted in a sharp decrease in the lake's surface. These challenges have serious implications for water resources management in Lake Urmia Basin. Therefore, we provided a comprehensive overview of anthropogenic factors on the changes in Lake Urmia along with existing opportunities for better water resources management in Lake Urmia Basin. This study serves as a guideline framework for climate scientists and hydrologists in order to assess the effects of different factors on lake water resources and for decision-makers to formulate strategies and plans according to the management task.

Cite this article

Mehri SHAMS GHAHFAROKHI , Sogol MORADIAN . Investigating the causes of Lake Urmia shrinkage: climate change or anthropogenic factors?[J]. Journal of Arid Land, 2023 , 15(4) : 424 -438 . DOI: 10.1007/s40333-023-0054-z

1 Introduction

Lake Urmia, located in the northwest of Iran, is among the vastest hypersaline lakes on the Earth. During the last decades, the lake area has decreased and the lake was threatened by various anthropogenic factors (such as extensive agricultural activities, urban growth, land expansion, and construction of dams), climate change, and natural hazards (such as drought) (Zarghami et al., 2011; Tourian et al., 2015; Hassani et al., 2020; Schulz et al., 2020; Mohammadi Hamidi et al., 2021; Sima et al., 2021). The drying process has led to a loss of biodiversity, thus destroying the habitat of many bird species. Desertification has seeped into the aquifers in the basin, as the salt of the lake was exposed. Such increased salinity also has consequences on the local agricultural sector, as well as serious side effects on the health of the residents (Zarrineh and Abad, 2014; Balkanlou et al., 2020; Nhu et al., 2020; Tabrizi et al., 2020). Therefore, it is considerably important to determine the responsible factors of lake shrinkage and formulate different management strategies against lake shrinkage.
Many studies have examined the changes in the volume of Lake Urmia and explored possible factors affecting its gradual drying (Gholampour et al., 2015; Khazaei et al., 2018; Ghale et al., 2019; Dehghanipour et al., 2020; Schmidt et al., 2021). Some local authorities blame climate change and its consequences for the crisis, arguing that the water scarcity is periodic (Lake Urmia Restoration Program, 2014; Urmia Lake Restoration National Committee, 2015; Sobhani et al., 2019). However, some others believed that the catastrophic water shortages of the basin are rooted in decades of disintegrated water resources management (Madani, 2014; AghaKouchak et al., 2015; Torabi Haghighi et al., 2018; AghaKouchak et al., 2021). For example, Madani (2014) argued that the status of Lake Urmia is affected by rapid population growth as well as inefficiency and mismanagement of agricultural sector. AghaKouchak et al. (2015) investigated the changes in the lake's shoreline and demonstrated that the on-going shoreline retreat is not solely an artifact of prolonged drought alone. Torabi Haghighi et al. (2018) employed a new method for designing environmental flow to Lake Urmia, showing that the mismanagement of water consumption in the agricultural sector of Lake Urmia Basin has resulted in a sharp decrease in the inflow to the lake up to 80.00%. Therefore, there is a lack of consensus among these studies on the causes of Lake Urmia shrinkage.
This paper uses satellite images to evaluate the changes in the area of Lake Urmia and investigates the primary reasons for its shrinkage. This study serves as a guideline framework for climate scientists and hydrologists in order to assess the effects of different factors on water resources management of Lake Urmia and for decision-makers to formulate and improvise strategies according to the management task.

2 Materials and methods

2.1 Study area

Lake Urmia (44°13′-47°54′E, 35°40′-38°29′N; Fig. 1), located in the northwest of Iran, is one of the vastest saltwater lakes on the Earth. Lake Urmia Basin is situated in arid and semi-arid region of Iran (Yazdandoost et al., 2020a), where the mean annual temperature varies from 6.5°C to 13.5°C (Department of Environment of Iran, 2019). Since the 1970s, the endorheic lake has faced severe water scarcity. Using images captured by the United States Geological Survey-National Aeronautics and Space Administration (USGS-NASA) Landsat satellites, researchers have pointed out that the area of Lake Urmia has decreased substantially in recent years (Tourian et al., 2015; Hosseini-Moghari et al., 2018; AghaKouchak et al., 2021; Sima et al., 2021; Yazdandoost and Moradian, 2021). When the water retreats, salt crusts are left behind and dust storms sweep into the atmosphere, causing respiratory difficulties for people and wreaking havoc on the neighboring farmlands (Rasouli et al., 2013; Ghale et al., 2018; Hossein Mardi et al., 2018; Mohammadi Hamidi et al., 2020, 2021; Hemmati et al., 2021). Climate change, population growth, excessive dam construction, low irrigation water use efficiency, poor water resources management, increased sediment flow into the lake, and lack of political and legal frameworks are considered as the main causes of Lake Urmia shrinkage (Ahmadzadeh Kokya et al., 2011; Delju et al., 2013; Ahmadi et al., 2016; Gohari et al., 2017; Alborzi et al., 2018; Moradian et al., 2019). The detailed information of Lake Urmia is shown in Table 1.
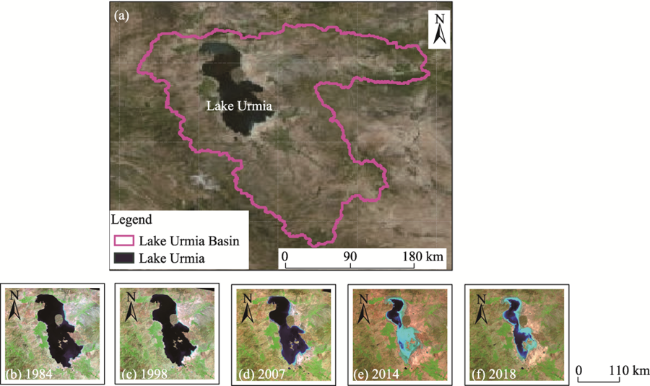
Fig. 1 Overview of Lake Urmia Basin (a) and satellite images showing the variations of the area of Lake Urmia in 1984 (b), 1998 (c), 2007 (d), 2014 (e), and 2018 (f). Note that the images were acquired by Landsat 5, 7, and 8.
Table 1 Detailed information of Lake Urmia
Item Description
Geographical location Coordinates of 44°13′-47°54′E and 35°40′-38°29′N in Iran.
Surface area 3500 km2 in 2013 (maximum length of 140 km and maximum width of 55 km).
Depth Average depth: 6 m; maximum depth: 16 m.
Lake level Ecological level of the lake's water level: 1274.1 m a.s.l.
Permanent main water sources (1) Aji Chai; (2) Alamlou River; (3) Barandooz River; (4) Gadar River; (5) Ghaie River; (6) Leilan River; (7) Mahabad River; (8) Nazloo River; (9) Roze River; (10) Shahar River; (11) Simine River; (12) Zarrine River; (13) Zola River.

Note: Data were sourced from Abbaspour and Nazaridoust (2007) and Dehghanipour et al. (2020).

2.2 Data collection

This study used satellite images from Landsat (www.earthexplorer.usgs) to calculate the changes in the area of Lake Urmia during 1970-2020. The outputs were compared to the official reports from the National Committee for Lake Urmia Restoration (https://www.ulrp.ir/en/). In addition, precipitation data were collected from the Global Precipitation Climatology Centre (GPCC; https://opendata.dwd.de/climate_environment/GPCC/html/download_gate.html) (Schneider et al., 2020). Also, the required data for the assessment modelling of water supply and demand, including water consumption data of the three main water users, i.e., domestic, industrial, and agricultural sectors, were obtained from the Agricultural Statistics and Information Center of the Ministry of Agriculture of Iran (https://irandataportal.syr.edu/ministry-of-agriculture).

2.3 Methodology

2.3.1 Causes of Lake Urmia shrinkage

To monitor the changes in the area of Lake Urmia using satellite images from Landsat and the Environment for Visualizing Images (ENVI), we calculated six commonly used remote sensing-derived indices related to liquid water (Table 2). Satellite images collected for the study period (1970-2020) were presented in a monthly averaged scale for each year (Xu, 2005; McFeeters, 2013; Pettorelli, 2013; Feyisa et al., 2014; Naji, 2018; Wang et al., 2018).
Table 2 Indicators used to estimate the area of Lake Urmia
Indicator Formula Reference
Automated water extraction index (AWEI) $\text{AWEI}=4({{X}_{\text{Green}}}-{{X}_{\text{MIR}}})-(0.25{{X}_{\text{NIR}}}+2.75{{X}_{\text{SWIR}}})$ Feyisa et al. (2014)
Automated water extraction index (shadow correction; AWEIsh) $\mathrm{DVW}=\frac{X_{\mathrm{NIR}}-X_{\mathrm{Red}}}{X_{\mathrm{NIR}}+X_{\mathrm{Red}}}-\frac{X_{\mathrm{NIR}}-X_{\mathrm{MIR}}}{X_{\mathrm{NIR}}+X_{\mathrm{MIR}}}$ Acharya et al. (2018); Wang et al. (2018)
Difference between vegetation and water (DVW) $\text{DVW}=\frac{{{X}_{\text{NIR}}}-{{X}_{\text{Red}}}}{{{X}_{\text{NIR}}}+{{X}_{\text{Red}}}}-\frac\\
{{{X}_{\text{NIR}}}-{{X}_{\text{MIR}}}}{{{X}_{\text{NIR}}}+{{X}_{\text{MIR}}}}$
Lyon et al. (1998); Xu et al. (2013); Naji (2018)
Modified normalized difference water index (MNDWI) $\text{MNDWI}=\frac{{{X}_{\text{Green}}}-{{X}_{\text{MIR}}}}{{{X}_{\text{Green}}}+{{X}_{\text{MIR}}}}$ Xu (2005)
Normalized difference vegetation index (NDVI) $\text{NDVI}=\frac{{{X}_{\text{NIR}}}-{{X}_{\text{Red}}}}{{{X}_{\text{NIR}}}+{{X}_{\text{Red}}}}$ Pettorelli (2013)
Normalized difference water index (NDWI) $\text{NDWI}=\frac{{{X}_{\text{Green}}}-{{X}_{\text{NIR}}}}{{{X}_{\text{Green}}}+{{X}_{\text{NIR}}}}$ Gao (1996); McFeeters (2013)

Note: XGreen, green wavelength (nm); XMIR, mid-infrared wavelength (nm); XNIR, near-infrared wavelength (nm); XSWIR short-wave infrared wavelength (nm); XRed, red wavelength (nm).

The Kappa coefficient (KC) was used to assess the accuracy of the calculated indices. The formula is shown as follows (Acharya et al., 2016; Mondejar and Tongco, 2019):
$\text{KC}=\frac{n\sum{{{n}_{ij}}}-\sum{({{n}_{i+}}\times {{n}_{+i}})}}{{{n}^{2}}-\sum{({{n}_{+i}}\times {{n}_{+i}})}},$
where n refers to the satellite band number; nij is the number of pixels in a specific category in the ith row and jth column that were correctly classified; ni+ is the number of pixels of the ith row that was classified for a specific class; and n+i is the number of cells of the jth column that was categorized for a specific class of the observed/reference data.
Precipitation data were collected from the GPCC and bias correction was subsequently carried out (Teutschbein and Seibert, 2012; Fang et al., 2015). The idea of the bias correction method is to correct the distribution function of simulated precipitation to match with the distribution function of observed precipitation. The cumulative distribution functions were constructed for observed precipitation data as well as the GPCC data. Then, Equation 2 was applied to correct the GPCC data:
$P'=\text{CDF}{{_{\text{obs}}^{{}}}^{-1}}(\text{CD}{{\text{F}}_{\text{GPCC}}}({{P}_{\text{GPCC}}})),$
where P' is the corrected precipitation data (mm); CDFobs is the cumulative distribution function of the observed precipitation (Fang et al., 2015); CDFGPCC is the cumulative distribution function of the GPCC data (Fang et al., 2015); and PGPCC is the precipitation data from the GPCC (mm). In this formula, a commonly used Gamma distribution function was employed to find the marginal probability distribution function that best fits the precipitation data. Equation 3 was used to describe the Gamma distribution ${{f}_{\gamma (x\left| \alpha,\beta \right.)}}$ (Thom, 1958), which is a frequently used distribution for precipitation.
${{f}_{\gamma (x\left| \alpha,\beta \right.)}}={{x}^{\alpha -1}}\frac{1}{{{\beta }^{\alpha }}\times \Gamma (\alpha )}\times {{\text{e}}^{\frac{-x}{\beta }}}\text{ }(x\ge 0;\text{ }\alpha,\beta >0),$
where α and β are the shape parameter and scale parameter, respectively; x is the given parameter; and $\Gamma$ is the Gamma function. Here, the method was expressed mathematically in terms of fγ (a statistical distribution) and its inverse (fγ–1), as shown in Equation 4:
$P'=f_{\gamma }^{-1}({{f}_{\gamma }}({{P}_{\text{GPCC}}}\left| {{\alpha }_{\text{GPCC}}},{{\beta }_{\text{GPCC}}} \right.)\left| {{\alpha }_{\text{obs}}},{{\beta }_{\text{obs}}}) \right.,$
where GPCC and obs refer to the data from the GPCC dataset and the observations, respectively.
Further, the correlation coefficient (CC) was used in SPSS statistical software (Kremelberg, 2010; Kinnear and Gray, 2011; Verma, 2012; Davis, 2013) to measure the correlation of variables.
In addition, as drought is the event of chronic shortages in water accessibility (Mishra and Singh, 2010), the changes in the Standardized Precipitation Index (SPI) (McKee et al., 1993, 1995; Edwards and McKee, 1997) were investigated to monitor the frequency and severity of meteorological drought in the study area. The SPI is an extensively used meteorological index in previous studies, being an accepted metric of meteorological drought by the World Meteorological Organization (Morid et al., 2006; Hayes et al., 2011; Shukla et al., 2011; Angelidis et al., 2012; Golian et al., 2014; Awange et al., 2016).
The calculation processes of the SPI are as follows: (1) preparation of the time series of precipitation accumulations; and (2) estimation of variables using a non-parametric empirical distribution function and calculation of cumulative distribution function (Hao et al., 2014; Farahmand and AghaKouchak, 2015; Jang, 2018; Salvador et al., 2019; Moradian and Yazdandoost, 2021). In this study, the marginal probability distribution function of precipitation data was computed using the empirical Gringorten distribution function (Gringorten, 1963). The probability of the observed precipitation was calculated using Equation 5:
$Prob=\frac{I-\text{0}\text{.44}}{N+\text{0}\text{.12}},$
where Prob is the cumulative frequency estimate of the ith item; and I is the order of the smallest sample out of N samples. The Prob was further standardized as Equation 6:
$\text{SPI}={{\phi }^{-1}}(Prob),$
where ϕ is the standard normal distribution function. The SPI can standardize the percentiles by applying Equations 7 and 8:
$\mathrm{SPI}=\left\{\begin{array}{ll}-\left(t-\frac{c_0+c_1 t+c_2 t^2}{1+d_1 t+d_2 t^2+d_3 t^3}\right) & \text { if } 0.00<\operatorname{Prob} \leq 0.50 \\ +\left(t-\frac{c_0+c_1 t+c_2 t^2}{1+d_1 t+d_2 t^2+d_3 t^3}\right) & \text { if } 0.51<\operatorname{Prob} \leq 1.00\end{array} \therefore\left\{\begin{array}{l}c:\left\{\begin{array}{l}c_0=2.5155 \\ c_1=0.8026 \\ c_2=0.0103\end{array}\right. \\ d:\left\{\begin{array}{l}d_1=1.4328 \\ d_2=0.1898 \\ d_3=0.0013\end{array}\right.\end{array}\right.\right.$,
$t=\left\{ \begin{align} & \sqrt{\ln \frac{1}{Pro{{b}^{2}}}}\text{ if }0.00<Prob\le 0.50\text{ } \\ & \sqrt{\ln \frac{1}{{{(1-Prob)}^{2}}}}\text{ if }0.51<Prob\le 1.00 \\ \end{align} \right.,$
where, t, c0, c1, c2, d1, d2, and d3 are the coefficients. In addition, we employed the Kolmogorv-Smirnov test to check how well the data fitted the distribution function (Stephens, 1974). The non-parametric test provides acceptable confidence on using the empirical distribution function as the reference function appropriate for the given dataset (Eq. 9).
$D=\text{MAX}\left| R(x)-E(x) \right|,$
where D is the maximum difference between R(x) and E(x), where R(x) and E(x) are the reference and empirical cumulative distribution functions, respectively. Here, the hypothesis is that the reference distribution function can describe the given data. With an error of 0.01, if the P-value is larger than the error, then the specific distribution function will be selected from the approved distribution functions.

2.3.2 Water resources management based on resiliency

After examining the driving factors of Lake Urmia shrinkage, it is necessary to develop scenarios for lake regeneration with the help of the Integrated Water Resources Management (IWRM). Basin planning is associated with numerous uncertainties because of the ambiguities in assumptions, objectives, and forecasts. As a result, determining the role of resilience in an integrated system is assisted by considering several management scenarios from the environmental, economic, technical, and social aspects in an integrated context based on the IWRM (Adger, 2000; de Bruijn, 2004; Tayia and Madani, 2017). In this regard, two approaches can be used to define resiliency: (1) engineering resiliency that concentrates on the behavior of a system near stable equilibrium and shows the speed of system returning an equilibrium after a disturbance; and (2) behavior of a system near the boundary of a domain of attraction far from any equilibrium in which instabilities flip to another domain, which is a buffer ability to absorb disturbances (de Bruijn, 2004; Nazif and Karamouz, 2009; Tahmasebi Birgani et al., 2013; Madani, 2019). Based on the behavior of a system in response to disturbances, researchers inferred three aspects from the definition of resiliency: (1) the system does not respond; (2) the system responds; and (3) the system recovers to the normal state from disturbances (Fig. 2) (de Bruijn, 2004; Tahmasebi Birgani and Yazdandoost, 2014). When the system is affected by any disturbances, its responses are different, depending on the magnitude of disturbances (Gersonius, 2008). This study attempts to determine the condition of Lake Urmia to formulate different resilient strategies to revive it and restore its original characteristics.
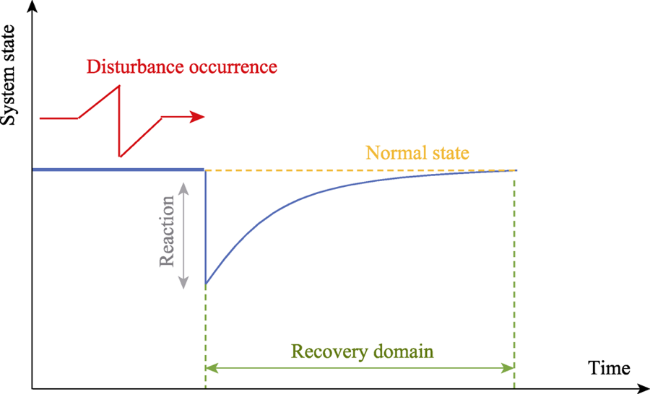
Fig. 2 Behavior of a system in response to disturbances: recovery from disturbances to normal state
To investigate the resiliency of possible strategies and water management and assess future water supply and demand in the basin, we quantitatively identified water resources and explored hydrological cycle, water demand, and water consumption at the regional level. The Water Evaluation and Planning System (WEAP) was used to carry out an integrated assessment (Lévite et al., 2003; Yates et al., 2005; Purkey et al., 2007; Vogel et al., 2007). The WEAP presents the water river basins by their numerous components, including demand-side issues (allocations, water usage patterns, costs, efficiencies, reuse plans, etc.) and supply-side aspects (underground and surface water, water transfers, reservoirs, etc.). Recognized by an integrated approach, the WEAP simulates the natural and engineering components of the basin, giving decision-makers a comprehensive understanding of the wide range of factors to be considered in the water system management (Yazdandoost et al., 2020b).
In this research, the precipitation parameter, which is directly affected by climate change, was investigated. In addition, since runoff is affected by several factors such as dam construction and surface water withdrawals, these factors were investigated separately. Therefore, the main factor of the catastrophic death of Lake Urmia can be proved as a natural or anthropological phenomenon. Finally, after applying different parameters such as precipitation, evaporation, and water withdrawals in agricultural, domestic, and industrial sectors, the runoff leading to Lake Urmia was calculated in the WEAP model and the volume of the lake was determined under different scenarios. The data used in the WEAP model were collected from the Agricultural Statistics and Information Center of the Ministry of Agriculture of Iran.

3 Results and discussion

3.1 Changes in the area of Lake Urmia

To evaluate the changes in the area of Lake Urmia between 1970 and 2020, we calculated the automated water extraction index (AWEI), automated water extraction index (AWEIsh), difference between vegetation and water (DVW), modified normalized difference water index (MNDWI), normalized difference vegetation index (NDVI), and normalized difference water index (NDWI). Table 3 shows the results of the area of Lake Urmia in 2014 from these different indices. Amongst these indices, NDWI had the best performance and hence it was used to study the changes in the area of Lake Urmia over the study period.
Table 3 Area of Lake Urmia in 2014 calculated from different indicators
Index Water pixels (%) Area (km2) Absolute error (km2)
AWEI 6.94 2457.93 457.93
AWEIsh 69.54 24,637.89 22,637.89
DVW 16.11 5708.99 3708.99
MNDWI 15.11 5354.68 3354.68
NDVI 37.03 13,120.57 11,120.57
NDWI 6.19 2193.38 193.38
The results from NDWI indicated that till 1997, the process of the changes in the area of Lake Urmia was slow (Fig. 3). The shrinking process was rapid from 1998 to 2018, with about one-third of the lake area disappearing during this period. These results are consistent with recent studies and the area-elevation-storage curve of the lake (Lake Urmia Restoration Program, 2014; Madani, 2014; Tourian et al., 2015; Urmia Lake Restoration National Committee, 2015; Rahimi and Breuste, 2021). These studies highlighted that the area of Lake Urmia has decreased by around 25.00%-50.00% during 1970-2020.
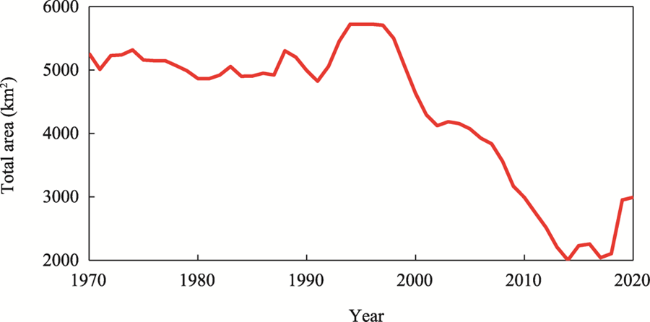
Fig. 3 Changes in the total area of Lake Urmia during 1970-2020 based on normalized difference water index (NDWI)

3.2 Causes of the shrinkage of Lake Urmia

3.2.1 Climate change and meteorological factors

To assess the effects of climate change on Lake Urmia shrinkage, we collected precipitation data from the GPCC and evaluated the changes in the GPCC bias-corrected precipitation data over the target area (Fig. 4). Results demonstrated that precipitation data did not follow a specific trend between 1970 and 2020 and precipitation was not less than normal during the study period. Also, there was no significant relationship between the volume of Lake Urmia and the amount of precipitation in the lake basin (SPSS CC=0.24). The results are consistent with the lake changes shown in Figure 1. As satellite images indicated in Figure 1, the area of Lake Urmia exhibited a sign of ''recovery'' in recent years, which can also be a good support for the results shown in Figure 4. Since climate change continuous, anthropological activities can be carried out to restore the rehabilitation process.
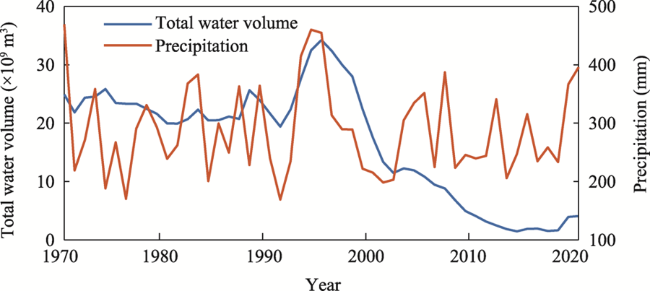
Fig. 4 Changes in the total water volume of Lake Urmia and precipitation of Lake Urmia Basin during 1970-2020
In addition, the SPI was calculated to monitor the severity and frequency of meteorological drought in the study area. Figure 5 offers the time series of the annual SPI during the study period based on the GPCC bias-corrected precipitation data, in which negative red SPI indicates the occurrence of drought and positive blue SPI means the end of drought. As indicated by Figure 5, there was no severe prolonged drought threatened Lake Urmia during 1970-2020 (SPSS CC=0.23).
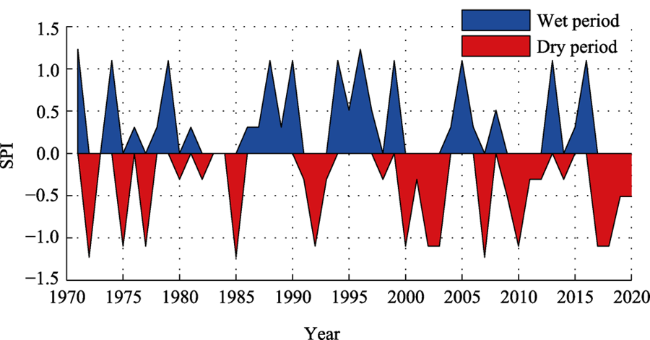
Fig. 5 Chnages of the average standardized precipitation index (SPI) in Lake Urmia Basin during 1970-2020. Negative red SPI indicates the occurrence of drought and positive blue SPI means the end of drought.

3.2.2 Population increase

Increasing domestic water consumption and population growth in Lake Urmia Basin have led to an increase in total water demand (Madani, 2014). According to the data from the Agricultural Statistics and Information Center of the Ministry of Agriculture of Iran, the population of Lake Urmia Basin was 1.86×10⁶ and 5.48×10⁶ in 1970 and 2020, respectively. There was an inverse relationship between population growth and the total volume of water in Lake Urmia (SPSS CC=-0.71) (Fig. 6). However, since the domestic water consumption sector constitutes only 3.00% of the total water consumption in Lake Urmia Basin (Urmia Lake Restoration National Committee, 2015), it is necessary to examine the impact of population growth on other factors such as agricultural development.
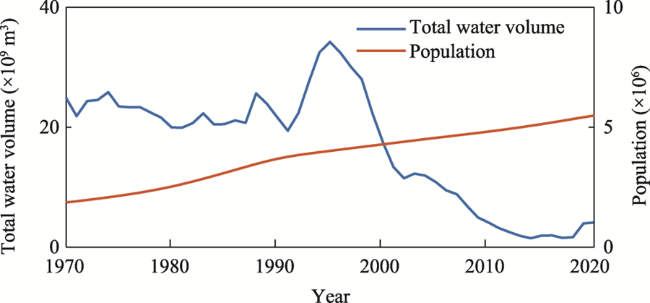
Fig. 6 Changes in the total water volume of Lake Urmia and population of Lake Urmia Basin during 1970-2020

3.2.3 Excessive dam construction

As mentioned in Table 1, Lake Urmia has 13 permanent main water sources originating from the mountains around the lake in Iran and Turkey. The ecosystem is an example of a closed basin draining all runoffs in the rivers. Currently, more than 74 dams have been constructed on the rivers, which have caused sharp decline in the total water volume of Lake Urmia. The volume of water in the reservoirs is about 5.20×10⁹ m3. From 1995 to 2010, 43 dams with a total annual adjustability of 3.89×10⁹ m3 have caused a decrease of 7 m in lake depth. Considering the extra flowing water contained by large dams, the profound effect of dam construction in the crisis became apparent (Lake Urmia Restoration Program, 2014; Tourian et al., 2015; Urmia Lake Restoration National Committee, 2015; Rahimi and Breuste, 2021). Therefore, proper dam management, such as temporarily opening large dams during the wet periods and the prevention of new dams, can be effective solutions.

3.2.4 Agricultural water use

Between 2010 and 2015, the total water consumption and renewable water sources exceeded 4.83×10⁹ and 7.00×10⁹ m3, respectively. However, 4.30×10⁹ m3 was consumed by agricultural water use. The water consumption in the agricultural sector was around 65.00% of the total renewable water sources and 93.00% of the total water use in Lake Urmia Basin (Lake Urmia Restoration Program, 2014). However, the acceptable renewable water source withdrawals must reach 20.00%-40.00% of the total water consumption (Sachs et al., 2021). Also, between 1986 and 2013, the water-based farmland in the basin increased from 3.50×10⁵ to 5.00×10⁵ hm2 (Lake Urmia Restoration Program, 2014). Figure 7 depicts the changes of the total water volume of Lake Urmia and agricultural water use in the basin between 1970 and 2020. Due to the high-water consumption in the agricultural sector in the basin, the water volume of the lake declined dramatically (SPSS CC= -0.77). Therefore, a crucial planning should be done to decrease water consumption in the agricultural sector in order to contain the lake volume.
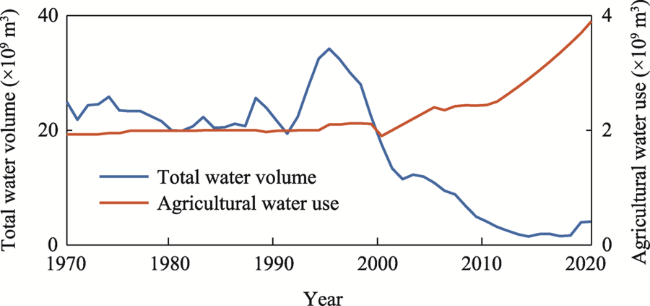
Fig. 7 Changes in the total water volume of Lake Urmia and agricultural water use of Lake Urmia Basin during 1970-2020

3.2.5 Water resources management

The study attributed the decrease in the amount of water in Lake Urmia to the increasing surface and underground water withdrawals during 1970-2020. In Lake Urmia Basin, about 61.00% of the water consumed by the domestic sector was supplied from surface resources and 39.00% from underground sources. Approximately 42.00% of the water required by the industrial sector was supplied from surface resources and 58.00% from underground sources. In addition, 56.50% of the water required by the agricultural sector was supplied from surface sources and 43.50% from underground sources. As shown in Figure 8, high-water withdrawals in the basin have led to a dramatic decline in lake water volume (SPSS CC= -0.86).
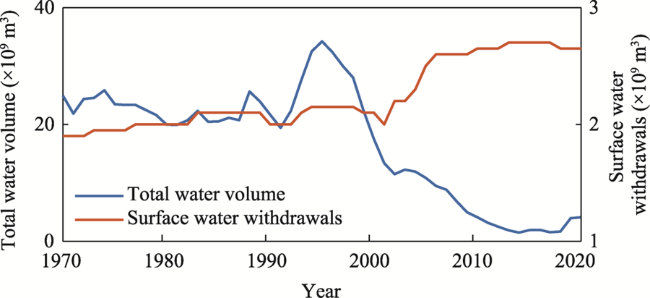
Fig. 8 Changes in the total water volume of Lake Urmia and surface water withdrawals of Lake Urmia Basin during 1970-2020
In addition to surface water withdrawals, there were about 88,000 semi-deep and deep wells in the basin in 2014, while approximately 50.00% of them were illegally built (Urmia Lake Restoration National Committee, 2015); as a result, the inflow to the lake has been tremendously reduced.

3.3 Resilient water resources management in Lake Urmia Basin

Lake Urmia normally has 16.27×10⁹ m3 of water available (Lake Urmia Restoration Program, 2014; Ahmadaali et al., 2018). The available water resources, however, varied from 17.52×10⁹ m3 in 2000 to 4.10×10⁹ m3 in 2020. Therefore, during the last 20 years, the amplitude of the lake reaction to the factors mentioned in Section 3.2 was about 13.42×10⁹ m3. To compensate for this shortcoming, we examined different management strategies in the WEAP model. During the modelling step, based on the consumption data of agricultural, industrial, and domestic sectors in 2010, we validated the WEAP model for the period of 2011-2018 and found that the relevant data are available. Also, the proposed strategies were assumed to be operational from 2021. The model validation results are shown in Tables 4 and 5. Detailed information about the applied WEAP model can be found in Yazdandoost et al. (2020b). The strategies used in the WEAP model included: (1) basic strategy (S1), which predicts the condition of the basin in near future (2021-2040) in case no action is taken to modify the current condition, and the growth rates for water consumption in the domestic, industrial, and agricultural sectors are 1.10%, 5.00%, and 5.00%, respectively; (2) a 25.00% decrease in water demand in the industrial and domestic sectors (S2); (3) a 40.00% decrease in water demand in the agricultural sector (S3); and (4) water transferring to Lake Urmia (S4) (Urmia Lake Restoration National Committee 2015). In addition to these scenarios, a hybrid scenario was also analyzed, equivalent to a 25.00% reduction in all water demands (S5). For the sake of brevity, since the effects of climate change on lake shrinkage were negligible in Section 3.2.1, the role of climate change was not considered in these strategies to keep the simplicity of the model. The mentioned strategies were primarily adopted on the basis of the proposals by local consultants without precise information of their effective magnitude or rank. Results of the modelled water volume from the WEAP are shown in Figure 9. As can be seen that this figure concentrates on 40.00% reduction in agricultural water consumption (S3) as it reaches the normal state sooner than the other strategies; however, compulsory water allocation reduction in the agriculture sector may have tremendous social and economic impediments. In addition, in Lake Urmia Basin, some inter-basin plans have been applied to transfer water to Lake Urmia (S4). However, this strategy ignored the inter-related dynamic of the drying process. Water shortage may be alleviated in the short term by water transfer missions, but in the long run, this will lead to the re-emergence of more serious water tensions. Therefore, inter-basin water transfer projects are inadequate solutions and have the potential to cause considerable unintended negative consequences over time.
Table 4 Comparing the observed water volume of Lake Urmia and modelled water volume from the Water Evaluation and Planning System (WEAP) during 2011-2018
Data Water volume (×109 m3)
2011 2012 2013 2014 2015 2016 2017 2018
Observed data 3.16 2.49 1.87 1.48 1.90 1.95 1.54 1.66
WEAP modelling data 3.66 3.20 2.49 2.09 1.84 1.72 1.71 1.65
Table 5 Comparing the observed water demand of Lake Urmia Basin and modelled water demand from the WEAP in different sectors in 2018
Data Water demand (×109 m3)
Domestic sector Agricultural sector Industrial sector
Observed data 175.90 3351.10 97.10
WEAP modelling data 189.90 3236.30 69.95
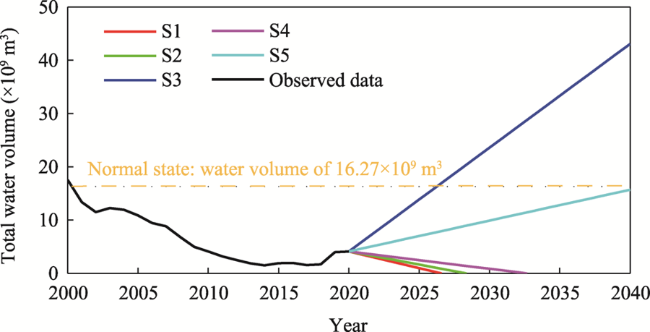
Fig. 9 Observed total water volume of Lake Urmia during 2000-2020 and modelled water volume from the WEAP during 2020-2040 based on the different adopted management strategies. S1, the basic strategy; S2, a 25.00% decrease in water demand in the industrial and domestic sectors; S3, a 40.00% decrease in water demand in the agricultural sector; S4, water transferring to Lake Urmia; S5, a 25.00% reduction in all water demands.
Thus, this study proposed better water management of Lake Urmia Basin along with different previous research propose ways: a hybrid management scenario considering all water demands (the proposed S5), changing the cultivation patterns (such as reducing cultivation of water-intensive produces and water-based products and cultivating crops with low water demand), decreasing the cultivated areas in the basin, improving irrigation efficiency by using modern drip and sprinkler irrigation systems, and providing technical supports to farmers (Richter et al., 2017; Ahmadaali et al., 2018; Emami and Koch, 2018). These measures can reduce all the impediments with any compulsory reduction in the agricultural water withdrawals.

4 Conclusions

In recent years, huge parts of the water area of Lake Urmia have dried up. The results of this study indicated that the rate of the changes in Lake Urmia in recent decades, particularly during 1998-2018, was of considerable intensity with about 30.00% of the lake area disappeared. The effects of climate change on lake shrinkage were negligible; climate change and meteorological factors are primary factors for the drying up; however, anthropogenic factors play an important role in the drying process. These challenges have serious implications for short- and long-term water resources management in Lake Urmia Basin. For any decision making in the basin, it is necessary to consider the principles of the IWRM based on resilient water resources management. Therefore, consideration of several management scenarios encompassing environmental, economic, technical, and social aspects in a united system is essential.
[1]
Abbaspour M, Nazaridoust A. 2007. Determination of environmental water requirements of Lake Urmia, Iran: an ecological approach. International Journal of Environmental Studies, 64(2): 161-169.

[2]
Acharya T D, Lee D H, Yang I T, et al. 2016. Identification of water bodies in a Landsat 8 OLI image using a J48 decision tree. Sensors-Basel, 16(7): 1075, doi: 10.3390/s16071075.

[3]
Acharya T D, Subedi A, Lee D H. 2018. Evaluation of water indices for surface water extraction in a Landsat 8 scene of Nepal. Sensors, 18(8): 2580, doi: 10.3390/s18082580.

[4]
Adger W N. 2000. Social and ecological resilience: are they related? Progress in Human Geography, 24(3): 347-364.

[5]
AghaKouchak A, Norouzi H, Madani K, et al. 2015. Aral Sea syndrome desiccates Lake Urmia: Call for action. Journal of Great Lakes Research, 41(1): 307-311.

[6]
AghaKouchak A, Mirchi A, Madani K, et al. 2021. Anthropogenic drought: definition, challenges, and opportunities. Reviews of Geophysics, 59(2): e2019RG000683, doi: 10.1029/2019RG000683.

[7]
Ahmadaali J, Barani G A, Qaderi K, et al. 2018. Analysis of the effects of water management strategies and climate change on the environmental and agricultural sustainability of Urmia Lake basin, Iran. Journal of Water, 10(2): 160, doi: 10.3390/w10020160.

[8]
Ahmadi A, Abbaspour M, Arjmandi R, et al. 2016. Resilient approach toward urban development in lake catchments, case of Lake Urmia. Scientia Iranica, 23(4): 1627-1632.

[9]
Ahmadzadeh Kokya T, Pejman A, Mahin Abdollahzadeh E, et al. 2011. Evaluation of salt effects on some thermodynamic properties of Urmia Lake water. International Journal of Environmental Research, 5(2): 343-348.

[10]
Alborzi A, Mirchi A, Moftakhari H, et al. 2018. Climate-informed environmental inflows to revive a drying lake facing meteorological and anthropogenic droughts, Environmental Research Letters, 13(8): 084010, doi: 10.1088/1748-9326/ aad246.

[11]
Angelidis P, Maris F, Kotsovinos N, et al. 2012. Computation of drought index SPI with alternative distribution functions. Water Resources Management, 26: 2453-2473.

[12]
Awange J L, Mpelasoka F, Goncalves R M. 2016. When every drop counts: analysis of droughts in Brazil for the 1901-2013 period Science of The Total Environment, 566-567: 1472-1488.

[13]
Balkanlou K R, Müller B, Cord A F, et al. 2020. Spatiotemporal dynamics of ecosystem services provision in a degraded ecosystem: A systematic assessment in the Lake Urmia basin, Iran, Science of The Total Environment, 716: 137100, doi: 10.1016/j.scitotenv.2020.137100.

[14]
Davis C. 2013. SPSS for Applied Sciences:Basic Statistical Testing. Melbourne: CSIRO Publishing, 1-175.

[15]
de Bruijn K M. 2004. Resilience and flood risk management. Water Policy, 6(1): 53-66.

[16]
Dehghanipour A H, Panahi D M, Mousavi H, et al. 2020. Effects of water level decline in Lake Urmia, Iran, on local climate conditions. Water, 12(8): 2153, doi: 10.3390/w12082153.

[17]
Delju A H, Ceylan A, Piguet E, et al. 2013. Observed climate variability and change in Urmia Lake Basin, Iran. Theoretical and Applied Climatology, 111(1-2): 285-296.

[18]
Department of Environment of Iran. 2019. Urmia Lake Challenges, Actions, and the way forward (1st ed.). [2019-04-28]. https://www.ulrp.ir/wp-content/uploads/2019/04/node_1420.pdf.

[19]
Edwards D C, McKee T B. 1997. Characteristics of 20th century drought in the United States at multiple time scales. Atmospheric Science Paper, 634: 1-30.

[20]
Emami F, Koch M. 2018. Agricultural water productivity-based hydro-economic modeling for optimal crop pattern and water resources planning in the Zarrine River basin, Iran, in the wake of climate change. Sustainability, 10(11): 3953, doi: 10.3390/su10113953.

[21]
Fang G H, Yang J, Chen Y N, et al. 2015. Comparing bias correction methods in downscaling meteorological variables for a hydrologic impact study in an arid area in China. Hydrology and Earth System Sciences, 19(6): 2547-2559.

[22]
Farahmand A, AghaKouchak A. 2015. A generalized framework for deriving nonparametric standardized drought indicators. Advances in Water Resources, 76: 140-145.

[23]
Feyisa G L, Meilby H, Fensholt R, et al. 2014. Automated Water Extraction Index: a new technique for surface water mapping using Landsat imagery. Remote Sensing of Environment, 140: 23-35.

[24]
Gao B C. 1996. NDWI—A normalized difference water index for remote sensing of vegetation liquid water from space. Remote Sensing of Environment, 58(3): 257-266.

[25]
Garousi V, Najafi A, Samadi A, et al. 2013. Environmental crisis in Lake Urmia, Iran: a systematic review of causes, negative consequences and possible solutions. In: Proceedings of the 6th International Perspective on Water Resources & the Environment (IPWE). Izmir, Turkey, doi: 10.13140/RG.2.1.4737.0088.

[26]
Gersonius B. 2008. Can resilience support integrated approaches to urban drainage management? In:11th International Conference on Urban Drainage. Edinburgh, Scotland, UK.

[27]
Ghale Y A G, Altunkaynak A, Unal A. 2018. Investigation anthropogenic impacts and climate factors on drying up of Urmia Lake using water budget and drought analysis. Water Resources Management, 32(1): 325-337.

[28]
Ghale Y A G, Baykara M, Unal A. 2019. Investigating the interaction between agricultural lands and Urmia Lake ecosystem using remote sensing techniques and hydro-climatic data analysis. Agricultural Water Management, 221(20): 566-579.

[29]
Gholampour A, Nabizadeh R, Hassanvand M S, et al. 2015. Characterization of saline dust emission resulted from Urmia Lake drying. Journal of Environmental Health Science and Engineering, 13: 82, doi: 10.1186/s40201-015-0238-3.

[30]
Gohari A, Mirchi A, Madani K. 2017. System dynamics evaluation of climate change adaptation strategies for water resources management in Central Iran. Water Resources Management, 31(5): 1413-1434.

[31]
Golian S, Mazdiyasni O, AghaKouchak A. 2014. Trends in meteorological and agricultural droughts in Iran. Theoretical and Applied Climatology, 119(3-4): 679-688.

[32]
Gringorten I I. 1963. A plotting rule for extreme probability paper. Journal of Geophysical Research, 68(3): 813-814.

[33]
Hao Z C, AghaKouchak A, Nakhjiri N, et al. 2014. Global integrated drought monitoring and prediction system. Scientific Data, 1: 140001, doi: 10.1038/sdata.2014.1.

[34]
Hassani A, Azapagic A, D'Odorico P, et al. 2020. Desiccation crisis of saline lakes: A new decision-support framework for building resilience to climate change. Science of The Total Environment, 703: 134718, doi: 10.1016/j.scitotenv.2019.134718.

[35]
Hayes M, Svoboda M, Wall N, et al. 2011. The Lincoln declaration on drought indices: universal meteorological drought index recommended. Bulletin of the American Meteorological Society, 92(4): 485-488.

[36]
Hemmati M, Ahmadi H, Hamidi S A, et al. 2021. Environmental effects of the causeway on water and salinity balance in Lake Urmia. Regional Studies in Marine Science, 44: 101756, doi: 10.1016/j.rsma.2021.101756.

[37]
Hossein Mardi A, Khaghani A, MacDonald A B, et al. 2018. The Lake Urmia environmental disaster in Iran: A look at aerosol pollution. Science of The Total Environment, 633: 42-49.

[38]
Hosseini-Moghari S M, Araghinejad S, Tourian M J, et al. 2018. Quantifying the impacts of human water use and climate variations on recent drying of Lake Urmia basin: the value of different sets of spaceborne and in-situ data for calibrating a hydrological model. Hydrology and Earth System Sciences, 24(4): 1939-1956.

[39]
Jang D. 2018. Assessment of meteorological drought indices in Korea using RCP 8.5 scenario. Water, 10(3): 283, doi: 10.3390/w10030283.

[40]
Khazaei B, Khatami S, Alemohammad H, et al. 2018. Climatic or regionally induced by humans?. Tracing hydro-climatic and land-use changes to better understand the Lake Urmia tragedy Journal of Hydrology, 569: 203-217.

[41]
Kinnear P R, Gray C D. 2011. IBM SPSS Statistics 18 Made Simple. Hove, East Sussex: Psychology Press, 120-600.

[42]
Kremelberg D. 2010. Practical statistics:A quick and easy guide to IBM® SPSS® Statistics, STATA, and other statistical software. Sauzendoaks, California: SAGE publications, 1-528.

[43]
Lake Urmia Restoration Program. 2014. Lake Urmia, Causes of Drought and Possible Threats. Official Report. Tehran, Iran: Lake Urmia Revival Headquarters. (in Persian)

[44]
Lévite H, Sally H, Cour J. 2003. Testing water demand management scenarios in a water-stressed basin in South Africa: application of the WEAP model. Physics and Chemistry of the Earth, Parts A/B/C, 28(20-27): 779-786.

[45]
Lyon J G, Yuan D, Lunetta R S, et al. 1998. A change detection experiment using vegetation indices. Photogrammetric Engineering and Remote Sensing, 64(2): 143-150.

[46]
Madani K. 2014. Water management in Iran: What is causing the looming crisis? Journal of Environmental Studies and Sciences, 4: 315-328.

[47]
Madani K. 2019. The value of extreme events: What doesn't exterminate your water system makes it more resilient. Journal of Hydrology, 575: 269-272.

[48]
McFeeters S K. 2013. Using the Normalized Difference Water Index (NDWI) within a geographic information system to detect swimming pools for mosquito abatement: A practical approach. Remote Sensing, 5(7): 3544-3561.

[49]
McKee T B, Doesken N J, Kleist J. 1993. The relationship of drought frequency and duration to time scales. In: 8th Conference on Applied Climatology. 17-22 January 1993. Anaheim, California, USA, 179-184.

[50]
McKee T B, Doesken N J, Kleist J. 1995. Drought monitoring with multiple time scales. In: 9th Conference on Applied Climatology. 15-22 January 1995. Dallas: American Meteorological Society, 233-236.

[51]
Mishra A K, Singh V P. 2010. A review of drought concepts. Journal of Hydrology, 391(1-2): 204-216.

[52]
Mohammadi Hamidi S, Nazmfar H, Rezayan A, et al. 2020. Futurology of the economic drivers of Urmia Lake water level fluctuations on the spatial unbalanced. The Journal of Spatial Planning, 24(4): 69-97.

[53]
Mohammadi Hamidi S, Nazmfar H, Fürst C, et al. 2021. Water level decline at Iran's Lake Urmia: changing population dynamics. Environmental Hazards, 21(3): 254-273.

[54]
Mondejar J P, Tongco A F. 2019. Near infrared band of Landsat 8 as water index: a case study around Cordova and Lapu-Lapu City, Cebu, Philippines. Sustainable Environment Research, 29(1): 16, doi: 10.1186/s42834-019-0016-5.

[55]
Moradian S, Taleai M, Javadi G H. 2019. A decision support system for water allocation in water scarce basins. Remote Sensing & GIS, 11(1): 19-32.

[56]
Moradian S, Yazdandoost F. 2021. Seasonal meteorological drought projections over Iran using the NMME data. Natural Hazards, 108(1): 1089-1107.

[57]
Morid S, Smakhtin V, Moghaddasi M. 2006. Comparison of seven meteorological indices for drought monitoring in Iran. International Journal of Climatology, 26(7): 971-985.

[58]
Naji T A H. 2018. Study of vegetation cover distribution using DVI, PVI, WDVI indices with 2D-space plot. International Journal of Physics: Conference Series, 1003(1): 012083, doi: 10.1088/1742-6596/1003/1/012083.

[59]
Nazif S, Karamouz M. 2009. Algorithm for assessment of water distribution system's readiness: planning for disasters. Journal of Water Resources Planning and Management, 135(4): 244-252.

[60]
Nhu V H, Mohammadi A, Shahabi H, et al. 2020. Monitoring and assessment of water level fluctuations of the Lake Urmia and its environmental consequences using multitemporal Landsat 7 ETM+ images. International Journal of Environmental Research and Public Health, 17(12): 4210, doi: 10.3390/ijerph17124210.

[61]
Pettorelli N. 2013. The normalized difference vegetation index. Oxford: Oxford University Press, 24-193.

[62]
Purkey D R, Huber-Lee A, Yates D N, et al. 2007. Integrating a climate change assessment tool into stakeholder-driven water management decision-making processes in California. Water Resources Management, 21(1): 315-329.

[63]
Rahimi A, Breuste J. 2021. Why is Lake Urmia drying up? Prognostic modeling with land-use data and artificial neural network. Frontiers in Environmental Science, 9: 603916, doi: 10.3389/fenvs.2021.603916.

[64]
Richter B D, Brown J D, DiBenedetto R, et al. 2017. Opportunities for saving and reallocating agricultural water to alleviate water scarcity. Water Policy, 19(5): 886-907.

[65]
Sachs J, Kroll C, Lafortune G, et al. 2021. Sustainable Development Report 2021. Cambridge: Cambridge University Press, 2-9.

[66]
Salvador C, Nieto R, Linares C, et al. 2019. Effects on daily mortality of droughts in Galicia (NW Spain) from 1983 to 2013. Science of The Total Environment, 662: 121-133.

[67]
Schmidt M, Gonda R, Transiskus S. 2021. Environmental degradation at Lake Urmia (Iran): exploring the causes and their impacts on rural livelihoods. GeoJournal, 86: 2149-2163.

[68]
Schneider U, Becker A, Finger P, et al. 2020. GPCC full data monthly product version 2020 at 1.0°: monthly land-surface precipitation from rain-gauges built on GTS-based and historical data. Deutscher Wetterdienst: Global Precipitation Climatology Centre (GPCC), doi: 10.5676/DWD_GPCC/FD_M_V2020_100.

[69]
Schulz S, Darehshouri S, Hassanzadeh E, et al. 2020. Climate change or irrigated agriculture - what drives the water level decline of Lake Urmia. Scientific Reports, 10(1): 236, doi: 10.1038/s41598-019-57150-y.

[70]
Shukla S, Steinemann A C, Lettenmaier D P. 2011. Drought monitoring for Washington State: indicators and applications. Journal of Hydrometeorology, 12(1): 66-83.

[71]
Sima S, Rosenberg D E, Wurtsbaugh W A, et al. 2021. Managing Lake Urmia, Iran for diverse restoration objectives: Moving beyond a uniform target lake level. Journal of Hydrology: Regional Studies, 35: 100812, doi: 10.1016/j.ejrh.2021.100812.

[72]
Sobhani B, Zengir V S, Kianian M K. 2019. Drought monitoring in the Lake Urmia basin in Iran. Arabian Journal of Geosciences, 12(15): 448, doi: 10.1007/s12517-019-4571-1.

[73]
Stephens M A. 1974. EDF statistics for goodness of fit and some comparisons. Journal of the American Statistical Association, 69(347): 730-737.

[74]
Tabrizi J S, Farahbakhsh M, Sadeghi-Bazargani H, et al. 2020. Health consequences of Lake Urmia in crisis in the disaster area: a pilot study. Disaster Medicine and Public Health Preparedness, 14(4): 442-448.

[75]
Tahmasebi Birgani Y, Yazdandoost F, Moghadam M. 2013. Role of resilience in sustainable urban stromwater management. Scientific Professional Quarterly, 1(1): 42-50.

[76]
Tahmasebi Birgani Y, Yazdandoost F. 2014. A framework for evaluating the persistence of urban drainage risk management systems. Journal of Hydroenvironment Research, 8(4): 330-342.

[77]
Tayia A, Madani K. 2017. Resilient transboundary water management institutions. World Environmental and Water Resources Congress, doi: 10.1061/9780784480595.055.

[78]
Teutschbein C, Seibert J. 2012. Bias correction of regional climate model simulations for hydrological climate-change impact studies: Review and evaluation of different methods. Journal of Hydrology, 456: 12-29.

[79]
Thom H C S. 1958. A note on the gamma distribution. Monthly Weather Review, 86(4): 117-122.

[80]
Torabi Haghighi A, Fazel N, Hekmatzadeh A A, et al. 2018. Analysis of effective environmental flow release strategies for Lake Urmia restoration. Water Resources Management, 32(11): 3595-3609.

[81]
Tourian M J, Elmi O, Chen Q, et al. 2015. A spaceborne multisensor approach to monitor the desiccation of Lake Urmia in Iran. Remote Sensing of Environment, 156: 349-360.

[82]
Urmia Lake Restoration National Committee. 2015. Necessity of Lake Urmia resuscitation, causes of drought and threats. Report Note ULRP-6-4-3-Rep 1. Tehran, Iran.

[83]
Verma J P. 2012. Data Analysis in Management with SPSS Software. New Delhi: Springer Science & Business Media.

[84]
Vogel R M, Sieber J, Archfield S A, et al. 2007. Relations among storage, yield, and instream flow. Water Resources Research, 43(5): W05403, doi:10.1029/2006wr005226.

[85]
Wang X B, Xie S P, Zhang X L, et al. 2018. A robust multi-band water index (MBWI) for automated extraction of surface water from Landsat 8 OLI imagery. International Journal of Applied Earth Observation and Geoinformation, 68: 73-91.

[86]
Xu H Q. 2005. A study on information extraction of water body with the modified normalized difference water index (NDWI). Journal of Remote Sensing, 9(5): 589-595. (in Chinese with English Abstract)

[87]
Xu L Y, Xie X D, Li S. 2013. Correlation analysis of the urban heat island effect and the spatial and temporal distribution of atmospheric particulates using TM images in Beijing. Environmental Pollution, 178: 102-114.

[88]
Yates D, Sieber J, Purkey D, et al. 2005. WEAP21—A demand-, priority-, and preference-driven water planning model Part 1: Model characteristics. Water International, 30(4): 487-500.

[89]
Yazdandoost F, Moradian S, Izadi A, Aghakouchak A. 2020a. Evaluation of CMIP6 precipitation simulations across different climatic zones: Uncertainty and model intercomparison. Atmospheric Research, 250: 105369, doi: 10.1016/ j.atmosres.2020.105369.

[90]
Yazdandoost F, Moradian S, Izadi A. 2020b. Evaluation of water sustainability under a changing climate in Zarrineh River Basin, Iran. Water Resources Management, 34(15): 4831-4846.

[91]
Yazdandoost F, Moradian S. 2021. Climate change impacts on the streamflow of Zarrineh River, Iran. Journal of Arid Land, 13(9): 891-904.

[92]
Zarghami M, Abdi A, Babaeian I, et al. 2011. Impacts of climate change on runoffs in East Azerbaijan, Iran. Global and Planetary Change, 78(3-4): 137-146.

[93]
Zarrineh N, Abad M A N. 2014. Integrated water resources management in Iran: Environmental, socio-economic and political review of drought in Lake Urmia. International Journal of Water Resources and Environmental Engineering, 6(1): 40-48.

Outlines

/