Research article

Potential risk of soil irrigation with treated wastewater over 40 years: a field experiment under semi-arid conditions in northeastern Tunisia

  • Sarra HECHMI , 1, * ,
  • Samira MELKI 1 ,
  • Mohamed-Naceur KHELIL 2 ,
  • Rim GHRIB 2 ,
  • Moncef GUEDDARI 3 ,
  • Naceur JEDIDI 1
Expand
  • 1Water Research and Technology Center, University of Carthage, Soliman 8020, Tunisia
  • 2National Institute for Research in Rural Engineering, Water and Forestry, Ariana 2080, Tunisia
  • 3Faculty of Sciences of Tunis, University of Tunis El Manar, Tunis 2092, Tunisia
*Sarra HECHMI (E-mail: )

Received date: 2022-07-20

  Revised date: 2023-01-26

  Accepted date: 2023-02-28

  Online published: 2023-04-30

Abstract

In Tunisia, water scarcity is only adding pressure on water demand in agriculture. In the context of sustainable development goals, Tunisia has been reusing treated wastewater (TWW) as a renewable and inexpensive source for soil fertigation and groundwater (GW) recharge. However, major risks can be expected when the irrigation water is of poor quality. This study aims for evaluating the potential risk of TWW and GW irrigation on soil parameters. Accordingly, we evaluated the suitability of water quality through the analysis of major and minor cations and anions, metallic trace elements (MTEs), and the sodium hazard by using the sodium adsorption ratio (SAR) and the soluble sodium percentage (SSP). The risk of soil sodicity was further assessed by SAR and the exchangeable sodium percentage (ESP). The degree of soil pollution caused by MTEs accumulation was evaluated using geoaccumulation index (Igeo) and pollution load index (PLI). Soil maps were generated using inverse spline interpolation in ArcGIS software. The results show that both water samples (i.e., TWW and GW) are suitable for soil irrigation in terms of salinity (electrical conductivity<7000 µS/cm) and sodicity (SAR<10.00; SSP<60.00%). However, the contents of PO43-, Cu2+, and Cd2+ exceed the maximum threshold values set by the national and other standards. Concerning the soil samples, the average levels of SAR and ESP are within the standards (SAR<13.00; ESP<15.00%). On the other hand, PLI results reveal moderate pollution in the plot irrigated with TWW and no to moderate pollution in the plot irrigated with GW. Igeo results indicate that Cu2+ is the metallic trace element (MTE) with the highest risk of soil pollution in both plots (Igeo>5.00), followed by Ni2+ and Pb2+. Nevertheless, Cd2+ presents the lowest risk of soil pollution (Igeo<0.00). Statistical data indicates that Ca2+, Na+, Ni2+, and Pb2+ are highly distributed in both plots (coefficient of variation>50.0%). This study shows that the use of imagery tools, such as ArcGIS, can provide important information for evaluating the current status of soil fertility or pollution and for better managing soil irrigation with TWW.

Cite this article

Sarra HECHMI , Samira MELKI , Mohamed-Naceur KHELIL , Rim GHRIB , Moncef GUEDDARI , Naceur JEDIDI . Potential risk of soil irrigation with treated wastewater over 40 years: a field experiment under semi-arid conditions in northeastern Tunisia[J]. Journal of Arid Land, 2023 , 15(4) : 407 -423 . DOI: 10.1007/s40333-023-0100-x

1 Introduction

Tunisia is the 33rd most water-stressed country in the world and is classified as one of the semi-driest to the driest countries in the world (World Bank, 2017). Rainfall is scanty to support crop production with an average annual rainfall varying from year to year and from north (600.0 mm) to south (150.0 mm) (Kallel et al., 2012). Average annual evapotranspiration is high and varies from 1300.0 mm in the north to about 2500.0 mm and even more in the south (Gaaloul et al., 2011). Water resources are unevenly distributed across the country with around 60% located in the north, 18% in the center, and 22% in the south. Groundwater (GW) resources, which represent half of the available freshwater (2.1×10⁹ m3), are contaminated by seawater intrusion due to overexploitation (Kouzana et al., 2009). More than 84% of these reserves have a salinity level exceeding 1.5 g/L (Gaaloul et al., 2008). Such saline GW represents a major threat in Tunisia once it is used in irrigation. Moreover, the Tunisian agricultural sector currently uses 80% of the country's water resources, which only adds pressure on the water share per capita per year. Water supply is estimated at 450.0 m3 per capita per year and is expected to decline to only 315.0 m3 per capita per year by 2030, due to the increase in population and the long period of dry-spell (Omrani and Ouessar, 2012). Therefore, the main challenges ahead the future of Tunisian agriculture are related to natural resources (water and soil), which must be managed in a sustainable way.
Treated wastewater (TWW) has increasingly become the predominant cost-effective alternative to other unconventional water, including marginal water, saline GW, sewage, and other types of wastewater (Chen et al., 2021). Since 1965, Tunisia has been engaged in reusing TWW and has developed measures regulating how TWW can be used, including a set national price per cubic meter (Dare et al., 2017). The reuse of such renewable and inexpensive sources can be the best answer to water scarcity and soil depletion in Tunisia. This could result in the improvement of the crops output, the reduction of the use of fertilizers, and the efficiency of energy consumption used for GW pumping (Gatta et al., 2020). These benefits would back-up the five sustainable development goals (SDGs), namely zero hunger (SDG2, where SDG is sustainable development goal), clean water and sanitation (SDG6), responsible consumption and production (SDG12), climate action (SDG13), and life on land (SDG15) (Tortajada, 2020). Accordingly, Tunisia has included the SDGs agenda in its National Development Plan since 2016. Currently, there are 115 active wastewater treatment plants in the whole region, 78% of which are equipped with activated sludge process (with low and medium organic load). Hence, the wastewater treatment plants are producing 2.7×10⁸ m3/a TWW, of which only 40% TWW (1.1×10⁸ m3) is reused for soil fertigation. In the Nabeul Governorate of Tunisia, TWW is also used for GW recharge using infiltration basins (El Ayni et al., 2011). Compared to conventional water, TWW contains a higher load of nutrients that are essential for soil fertility and plant productivity. However, undesirable changes may occur after soil irrigation with this unconventional water due to their complex origin. These changes include the risks of soil acidification and salinization, as well as the chemical and biological contamination (Hajihashemi et al., 2020). Apart from future crop production risk, GW quality and soil fertility may be threatened in the long run.
The suitability of water for irrigation is determined by its cation and anion contents, total suspended solids (TSS), electrical conductivity (EC), and sodium adsorption ratio (SAR) (Kadyampakeni et al., 2017). Soluble sodium percentage (SSP) is also used to evaluate the sodium hazard. For example, water with an SSP over 60.00% may result in sodium accumulation in the soil thus reducing its permeability (Salifu et al., 2015) and affecting soil functioning and crop productivity (Kumar et al., 2018). The soil salinity and sodicity are usually assessed by the soil EC, SAR, and exchangeable sodium percentage (ESP), which represents the percentage of Na+ within the soil exchange complex (Mahmud and Roy, 2020). Metallic trace elements (MTEs) are another important characteristic that determines the quality of irrigation water. Long-term irrigation with TWW would result in MTEs accumulation in soil (Hasan et al., 2020; Mkhinini et al., 2020), surface runoff, or GW leaching (Khaskhoussy et al., 2015; Alexakis, 2020; Lerat-Hardy et al., 2021). Several studies suggested the use of some indices such as geoaccumulation index (Igeo) and pollution load index (PLI) to evaluate soil enrichment by MTEs (Jimoh et al., 2020; Han et al., 2021; Hechmi et al., 2021; Kowalik et al., 2021). The Igeo compares the content of a certain metallic trace element (MTE) brought by the anthropogenic activity to its natural background content in soil (Hechmi et al., 2021). The PLI represents the number of times the MTE content in soil exceeds the average natural background concentration, and gives a summation of the overall level of MTE toxicity in a particular soil sample (Tyopine et al., 2018; Jimoh et al., 2020). The value of these indices is strongly dependent on the type of anthropogenic source and the condition of soil (Kowalik et al., 2021). The spatial distribution of these parameters is essential to understand the fundamental properties of soils.
Several researchers carried out extensive studies on the water quality of urban wastewater treatment plants in Tunisian. For instance, Bahri (1987) studied the fertilization value and pollution load of TWW in wastewater treatment plants of Nabeul and its effects on sandy soils and reported that the reuse of TWW in arid and semi-arid areas is important. Klay et al. (2010) evaluated the impact of TWW irrigation on the perimeter of Zaouiet Sousse and observed the increase of soil salinity and MTEs content with the irrigation period. El Ayni et al. (2011) evaluated the environmental and health quality of TWW in wastewater treatment plants of Nabeul for irrigation and aquifer recharge purposes. They suggested using infiltration basins as an additional treatment for bacteriological and suspended solid contaminants in TWW and as a coastal barrier to prevent seawater intrusion. Belaid et al. (2012) and Kallel et al. (2012) studied the effect of TWW on soil properties in wastewater treatment plants of Sfax City. Their findings indicated an increase in soil salinity and sodicity, as evidenced by higher levels of SAR and SSP. Khaskhoussy et al. (2015) investigated the total concentrations of Zn2+, Co2+, Pb2+, Ni2+, Cd2+, and Cu2+ in the soil after one cycle of irrigation with TWW in wastewater treatment plant of Chotrana City and found that the concentrations of Cd2+ and Ni2+ exceed the maximum permissible limits in irrigated soil (3 and 75 mg/kg, respectively). Recently, Gargouri et al. (2022) showed that irrigating olive trees with TWW increases soil pH and major nutrients, particularly in the upper layers next to olive roots. Similar observations were made by Bekir et al. (2022), they found higher concentrations of Mg2+, Ca2+, and K+ in the topsoil.
This study was carried out at the experimental station of Oued Souhil watershed in Nabeul Governorate of Tunisia, where plot has been irrigated with TWW for over 40 years. The aims of this study are to evaluate the effects of both water types (i.e., TWW and GW) on soil fertility parameters, including organic matter (OM) and cation exchange capacity (CEC), soil potential degradation parameters, such as pH, EC, SAR, and ESP, and the risk of soil polluted by MTEs using Igeo and PLI. The spatial distribution of soil sodicity and MTEs was also presented. This study is helpful in providing data for further water quality monitoring and soil remediation studies on soil pollution after long-term unconventional water irrigation.

2 Materials and methods

2.1 Study area

The study area (36°43′76″-36°46′96″N, 10°69′86″-10°70′26″E; Fig. 1) is located in the east of Nabeul Governorate in northeastern Tunisia. Nabeul has a Mediterranean climate, characterized by mild weather in winter and hot and dry in summer. The semi-arid bioclimatic stage is dominant in Oued Souhil watershed. Table 1 shows the monthly average temperature, rainfall, evaporation, and wind speed at Nabeul Station during the period from 1990 to 2019. Average minimum temperatures are recorded during the winter, with a minimum of 8.8°C in February; average maximum temperatures are measured during the summer, with a maximum of 30.1°C in August. The average annual rainfall during 1990-2019 is 538.4 mm. The monthly average rainfall varies between 82.2 mm in December (the rainiest month) and 4.3 mm in July (the driest month). The average annual evaporation at the Nabeul Station is 1182.3 mm, ranging from 70.4 mm in February to 148.5 mm in July. The wind in the study area usually comes from the northwest region, with monthly average wind speed between 2.6 and 3.4 m/s. They are the source of precipitation during the cold and wet seasons.
Table 1 Monthly average temperature, rainfall, evaporation, and wind speed at Nabeul Station during the period from 1990 to 2019
Jan Feb Mar Apr May Jun Jul Aug Sep Oct Nov Dec
Temperature (°C) 12.1 12.2 13.3 15.0 18.4 22.2 25.1 26.1 24.0 20.7 16.5 13.3
Rainfall (mm) 71.7 59.7 48.3 35.4 20.5 7.3 4.3 6.5 45.0 81.6 75.9 82.2
Evaporation (mm) 73.2 70.4 80.7 85.0 98.3 125.0 148.5 136.4 114.1 94.4 80.5 75.8
Wind speed (m/s) 3.2 3.4 3.3 3.3 3.1 3.1 3.1 2.7 2.7 2.6 2.8 3.0
The study area is located in the Cap Bon Peninsula, which is marked by the anticline of the Atlas Mountains, trending from southwest to northeast (Ben Salem, 1992). The study area is mainly drained by the Oued Souhil watershed (Fig. 1). The Oued Souhil watershed is one of the main sub-watersheds of the Nabeul-Hammamet hydrological basin with an area of 25 km², which can store 8.0×10⁵ m3 water. The surface water is carried away towards the Hammamet Gulf with a maximum flood flow of 17.7 m3/s. The river bed is distinguished by the abundance of permeable sandy soil, which is conducive to the infiltration of surface water, thus supplementing GW (Ben Moussa, 2011). The irrigated plot is characterized by poorly developed soils, which contain less organic matter and more mineral elements. These soils are of great importance because they are close to the groundwater. However, they may suffer from very significant salinization, especially in arid and semi-arid areas.
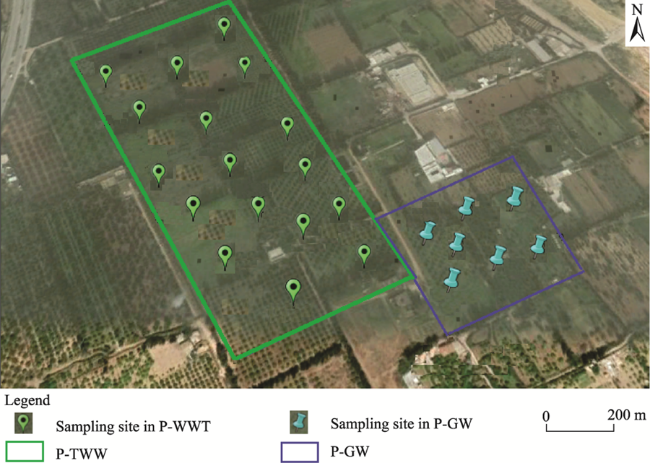
Fig. 1 Overview of the study area and soil sampling sites. P-TWW, plot irrigated with treated wastewater (TWW); P-GW, plot irrigated with groundwater (GW).

2.2 Field plots and sampling procedures

This study was conducted at the experimental station of Oued Souhil watershed. The experimental field was established in 1979 as the first pilot site in Tunisia to study the impact of reusing unconventional water on soil fertility and productivity. The irrigation water included TWW and GW. TWW used for the irrigated plot is derived from a close urban wastewater treatment plant in Nabeul. The wastewater treatment plant in Nabeul has a treatment capacity of 7500.0 m3/d and the actual reception capacity is about 7000.0 m3/d. The treatment process consists of three successive steps, including pre-treatment, secondary treatment, and tertiary treatment (El Ayni et al., 2011). Since 2008, about 1500.0 m3/d TWW has been reused to recharge the Nabeul aquifer through three infiltration basins (each with an area of 1500.0 m2) (Cherif et al., 2013). GW was then extracted from surface wells located in the agricultural perimeters of the watershed. The recharged GW brings an additional resource for the irrigation of 8480.0 hm2 agricultural land in this region. Refilling the aquifer also serves as a buffer against seawater intrusion (Kouzana et al., 2009). Currently, most of TWW is utilized for irrigation with an average of 5500.0 m3/d.
In this study, the plot irrigated with TWW was compared to the plot irrigated with GW. The vegetation cover in both plots is marked by citrus trees (87%), olive trees (7%), fodder crops (3%), and others (3%). For both treatments, irrigation is supplied by a surface drip irrigation system, which consists of double ramps of integrated drippers at a distance of 1 m and has a flow rate of 4 L/h. Surface drip irrigation systems have become increasingly popular and are considered to be efficient, which can conserve water from runoff, deep percolation, or evaporation (Mahmoudi et al., 2022). A sampling campaign was carried out in June 2021. GW was obtained from a surface well close to the plot. TWW was collected from the irrigation reservoir of the experimental station. For each water sample, we took 20-L samples and stored them in polyethylene bottles at 4°C. Soil samples were collected at the soil depth of 0-20 cm because it corresponds to the zone of high rhizosphere activity in water-saving irrigation systems (Mahgoubet al., 2017). A total of 24 surface soil samples were collected across the study area using a stainless-steel augerand, and packed them in polyethylene bags. The spatial coordinates of sampling sites were recorded using a handheld global positioning system. The sampling density was 1 sample per about 2 m2 (Fig. 1). Soil samples were taken outside the dripping points to prevent results from being biased by recent wastewater input.

2.3 Analysis of water samples

Water pH and EC were measured in situ using portable meters. The chemical oxygen demand (COD) was determined by the Dichromate method. A total of 10-mL water sample was refluxed at elevated temperatures for up to 2 h with 15-mL potassium dichromate and 20-mL sulfuric acid. The amount of potassium dichromate remaining after the digestion of organic matter was titrated with a standard ferrous ammonium sulfate solution using orthophenanthroline ferrous complex as an indicator. The samples were filtered through a pre-weighed filter (0.45 µm) to determine TSS (Rodier, 2018). The residue retained on the filter was dried in an oven at 105°C until the weight of the filter no longer changed. Water nutrients (NH4+, NO3-, PO43-) were determined using an ion chromatograph (Compact IC Pro 881, Metrohm AG, Hannover, Switzerland). After water filtration, chloride (Cl-) was measured by the argentometric method using a standard AgNO3 solution. Major elements (Ca2+, Mg2+, Na+, and K+) and MTEs (Cu2+, Ni2+, Pb2+, and Cd2+) were also measured on the filtered sample by an atomic absorption spectrometry (PinAAcle 500, PerkinElmer, Essonne, France). The data quality was guaranteed through careful standardization, procedural blank measurements, and duplicate samples. The suitability of irrigation water quality was assessed by SAR and SSP (Saha et al., 2019), the calculation formulas are as follows:
$\text{SAR}=\frac{\text{N}{{\text{a}}^{+}}}{\sqrt{\frac{\text{C}{{\text{a}}^{2+}}+\text{M}{{\text{g}}^{2+}}}{2}}}$,
$\text{SSP}=\frac{\text{N}{{\text{a}}^{+}}+{{\text{K}}^{+}}}{\text{C}{{\text{a}}^{2+}}+\text{M}{{\text{g}}^{2+}}+\text{N}{{\text{a}}^{+}}+{{\text{K}}^{+}}}\times 100\%$,
where SAR is sodium adsorption ratio; SSP is soluble sodium percentage (%); and Na+, Ca2+, Mg2+, and K+ represent the concentrations of Na+, Ca2+, Mg2+, and K+, respectively (mmol/L).

2.4 Analysis of soil samples

According to Pauwels et al. (1992), we carried out soil physico-chemical analysis for air-dried samples sieved at 2 mm. Soil texture has been determined by the Robinson pipette method using 100-g soil sample (Pauwels et al., 1992). After destroying soil organic matter with H2O2 and removing CaCO3 content with HCl, 50-mL sodium-hexametaphosphate was added to disperse the different fractions. Then, after stirring the suspension for a specific time, aliquots were taken at a specific depth using a pipette with a known volume. Next, the samples were dried to constant weight in an oven at 105°C (FT6060, Thermo Scientific, Loughborough, UK) to determine the percentages of clay, silt, and sand. Soil pH was measured at a 1.0:2.5 soil:water suspension after 2-h shaking (Pauwels et al., 1992). We determined EC according to the method of Loveday (1974). Specifically, 10-g soil was mixed in 50-mL distilled water and shaken for 1 h, then kept to rest for 20 min before the analysis. We also determined soil organic matter by calcination at 550°C for 3 h according to Zoghlami et al. (2021). Firstly, air-dried samples were weighed and then combusted in a furnace. The final weight was also recorded using the same calibrated analytical balance. The volatile matter corresponds to the soil organic matter content. Total nitrogen (TN) was measured using the Kjeldahl digestion-distillation method (Bremner and Mulvaney, 1982). In the presence of Missouri catalyst, we mixed 1-g soil with 10-mL H2SO4 at 400°C for 2 h. After digestion, 50-mL NaOH (40%) was added to the sample and the distillate was received in H3BO3 (5%). The titration was assessed with HCl in the presence of Tashiro's indicator until the solution showed a slightly violet colour. The same method was applied to determine total phosphorus (TP) as described by Taylor (2000); TP was measured at 880 nm using a UV/Visible spectrophotometer (Bk-V1900, Biobase, Ji'nan, China). Exchangeable bases (Ca2+, Mg2+, Na+, and K+) were analysed using a flame spectrophotometer after extraction with ammonium acetate solution (1 mol/L) at pH equals to 7.00 (Hechmi et al., 2022). CEC was determined by the diamine copper method (Pauwels et al., 1992). ESP in soil was calculated by:
$\text{ESP}=\frac{\text{N}{{\text{a}}^{+}}}{\text{CEC}}\times 100\text{ }\%$,
where ESP is exchangeable sodium percentage (%); and CEC is cation exchange capacity (mmol/kg).
We determined SAR on soil paste extracts according to Hechmi et al. (2020a). Specifically, deionized water was gradually added to 500-g dry soil under continuous mixing until it reached complete saturation. After standing for 18 h, the samples were filtered, and Na+, Ca2+, and Mg2+ were measured in the extracts using the atomic absorption spectrometry (PinAAcle 500, PerkinElmer, Essonne, France). The concentrations of the exchangeable bases were converted before calculating the SAR of soil samples. Total concentrations of MTEs (Cu2+, Ni2+, Pb2+, and Cd2+) were measured by an atomic absorption spectrophotometer (PinAAcle 500, PerkinElmer, Essonne, France) after extraction with a mixture of HF and HClO4 (Pauwels et al., 1992).
We calculated Igeo using the following formula (Hechmi et al., 2021):
$\text{Igeo}=\text{lo}{{\text{g}}_{2}}\frac{Cn}{1.5\times Bn}$,
where Igeo is geoaccumulation index; Cn (mg/kg) is the total concentration of an element in the tested soil (Loska et al., 2004); and Bn (mg/kg) is the background concentration of the element. The background concentration of element used in this study was 1.00 mg/kg for Cu2+, 0.44 mg/kg for Ni2+, 0.74 mg/kg for Cd2+, and 16.50 mg/kg for Pb2+. These values are taken from the records of the experimental station. According to Muller (1969), we classified Igeo into seven levels: including un-contamination (Igeo≤0.00), un-contamination to moderate contamination (0.00 <Igeo≤1.00), moderate contamination (1.00<Igeo≤2.00), moderate to heavy contamination (2.00<Igeo≤3.00), heavy contamination (3.00<Igeo≤4.00), heavy to extreme contamination (4.00<Igeo≤5.00), and extreme contamination (Igeo>5.00).
Soil PLI was computed using the following formula (Jimoh et al., 2020):
$\text{PLI}=n\sqrt[{}]{\text{P}{{\text{I}}_{1}}\times \text{P}{{\text{I}}_{2}}\times...\times \text{P}{{\text{I}}_{n}}}$,
$\text{PI}=\frac{Cn}{Bn}$,
where PLI is pollution load index; n is the number of pollutants; PI is pollution index; and PI1, PI2, …, PIn represent the single factor pollution index of each metal. According to Chakravarty and Patgiri (2009), we divided PLI into six levels, including un-pollution (0.00<PLI≤1.00), un-pollution to moderate pollution (1.00<PLI≤2.00), moderate pollution (2.00<PLI≤3.00), moderate to high pollution (3.00<PLI≤4.00), high pollution (4.00<PLI≤5.00), and extreme pollution (PLI>5.00).

2.5 Statistical analysis

The descriptive statistics of data, including minimum, maximum, mean, and standard deviation (SD), were used in this study. The characteristics difference between TWW and GW as well as their effect on soil parameters were evaluated by analysis of variance with post hoc Duncan's multiple range test at P≤0.05 level using IBM SPSS Statistics 20 software. In order to compare the variability of the soil properties among themselves across the study area, we also calculated the coefficient of variation (CV). The CV is a statistical index of the relative dispersion of data points in a data series around the mean. The formula for calculating CV is as follows:
$\text{CV}=\frac{\text{SD}}{\text{Mean}}\times 100\text{ }\%$,
where CV is coefficient of variation (%); and SD and Mean represent the standard deviation and the mean value, respectively. We further categorized the result of CV according to Warrick and Nielsen (1980): low variability (CV<20.0%), moderate variability (20.0%≤CV≤50.0%), high variability (50.0%<CV<100.0%), and very high variability (CV≥100.0%).

2.6 Spatial analysis

ArcGIS 10.2.1 software was used to analyse map organization and georeferenced information and generate spatial variation maps of certain analysis variables. The inverse spline interpolation method was used to interpolate all soil sampling sites and their concentration levels. This technique estimates the value of geographic features in an area by using a set of sampling sites. The theme is divided into multiple regions, and the sampling sites found in each region are used to predict individual cell value for that region. The number of regions in a theme depends on the number of sites selected for estimating the cell values (Zhu et al., 2012).

3 Results

3.1 Physico-chemical characteristics of treated wastewater (TWW) and groundwater (GW)

Table 2 demonstrates the physico-chemical characteristics of TWW and GW used for irrigation compared to the characteristic values reported in standard files (USDA, 1954; Wilcox, 1955; INNORPI, 1989; FAO, 2003). As shown in Table 2, the pH of both samples was neutral (7.35 and 7.45 for TWW and GW, respectively). The concentrations of NH4+ and PO43- were higher in TWW, with values of 3.8 and 30.5 mg/L, respectively. The concentration of NO3- was similar in both water samples (23.7 mg/L in TWW and 24.0 mg/L in GW). The maximum concentration of Na+ was observed in TWW with a value of 509.5 mg/L. The concentration of Na+ in GW was slightly lower, with a value of 420.8 mg/L. The concentration of Ca2+ was 311.9 mg/L for TWW and 251.1 mg/L for GW. The concentration of Mg2+ in GW (116.2 mg/L) was two times higher than that in TWW (51.3 mg/L). Among the cations, K+ was the lowest constituent in both water samples, with values of 21.7 mg/L in TWW and 21.6 mg/L in GW. SAR and SSP values were 6.71 and 50.90% for TWW, respectively, and 5.50 and 44.7% for GW. The concentration of Cl- was 624.8 mg/L in TWW and 656.8 mg/L in GW. EC and COD of both water samples were under the limit recommended by the standard file (7000.0 µS/cm and 90.0 mg/L, respectively). It can be seen from Table 2 that the decreasing trend of trace and heavy metal concentrations in TWW is as follows: Cu2+>Cd2+>Pb2+>Ni2+, where the concentrations of Cu2+ and Cd2+ exceed the permissible limits set by INNORPI (1989).
Table 2 Physico-chemical characteristics of treated wastewater (TWW) and groundwater (GW) used for irrigation compared to the characteristic values reported in standard files
Physico-chemical characteristic TWW GW Characteristic values reported in standard files
pH 7.35±0.20a 7.45±0.30a 6.50-8.50#
EC (µS/cm) 2950.0±35.0a 3610.0±20.0b <7000.0#
TSS (mg/L) 14.0±0.5b 4.2±0.7a <30.0#
COD (mg/L) 28.8±2.0b 9.6±1.2a <90.0#
NH4+ (mg/L) 3.8±0.7b 0.5±0.2a <1.0#
NO3- (mg/L) 23.7±2.0a 24.0±2.5a <50.0#
PO43- (mg/L) 30.5±5.7b 2.3±0.9a <0.3*
Ca²⁺ (mg/L) 311.9±24.5b 251.1±19.0a <500.0#
Mg²⁺ (mg/L) 51.3±9.0a 116.2±10.2b <200.0#
Na⁺ (mg/L) 485.5±24.0a 420.8±50.0a <500.0#
K⁺ (mg/L) 21.7±2.0a 21.6±1.7a <50.0#
Cl- (mg/L) 624.8±35.0a 656.8±51.2a <2000.0#
SAR 6.71 5.50 <10.00**
SSP (%) 50.90 44.70 <60.00***
Cu2+ (mg/L) 0.92±0.02b 0.08±0.01a <0.50#
Ni2+ (mg/L) 0.03±0.01 <Detection limit <0.20#
Pb2+ (mg/L) 0.04±0.01 <Detection limit <1.00#
Cd2+ (mg/L) 0.06±0.01 <Detection limit <0.01#

Note: EC, electrical conductivity; TSS, total suspended solids; COD, chemical oxygen demand; SAR, sodium adsorption ratio; SSP, soluble sodium percentage. #, *, **, and *** represent the characteristic values are reported in INNORPI (1989), FAO (2003), USDA (1954), and Wilcox (1955), respectively.

3.2 Soil physico-chemical characteristics

The analysis of soil granulometry indicated that both soil samples had high sand content, with the lowest value (58.8%) in the plot irrigated with TWW (P-TWW) and the highest value (79.5%) in the plot irrigated with GW (P-GW), whereas silt and clay contents were higher in P-TWW (41.0%) and lower in P-GW (19.9%). According to the textural classification scale of Baize (1988), we found that both soil samples were sandy loam. Soil physico-chemical characteristics after irrigation with TWW and GW are illustrated in Table 3.
Table 3 Soil physico-chemical characteristics after irrigation with GW and TWW
Plot Sample pH EC (μS/cm) OM (g/kg) TN (g/kg) TP (g/kg) Ca2+ (mmol/kg) Mg2+ (mmol/kg)
GW S1 8.06 106.8 25.9 0.64 0.32 127.0 16.5
S2 8.16 64.2 17.1 0.50 1.88 212.0 11.9
S3 8.32 68.5 16.4 0.27 1.52 194.0 6.7
S4 8.29 112.2 32.1 0.87 1.68 207.0 19.4
S5 8.18 84.9 16.7 0.31 0.93 129.0 13.9
S6 8.88 125.1 26.0 0.36 1.07 104.0 13.3
S7 8.50 206.0 11.7 0.56 8.15 48.0 13.3
Mean 8.34±0.28a 109.7±48.2a 20.8±7.2a 0.50±0.21a 2.22±2.67a 146.0±61.0a 13.6±3.9a
Plot Sample Na+ (mmol/kg) K+ (mmol/kg) CEC (mmol/kg) Cu2+ (mg/kg) Ni2+ (mg/kg) Pb2+ (mg/kg) Cd2+ (mg/kg)
GW S1 6.2 2.5 153 100.00 4.00 14.00 0.70
S2 2.2 1.2 227 110.00 6.00 14.00 0.70
S3 3.7 3.3 208 100.00 6.00 11.00 0.50
S4 14.0 4.0 245 100.00 2.00 18.00 0.60
S5 19.6 1.6 164 90.00 2.00 37.00 0.50
S6 41.5 3.5 163 80.00 2.00 16.00 0.60
S7 16.1 3.6 81 90.00 3.00 3.00 0.30
Mean 14.8±13.5a 2.8±1.1a 177±55a 96.00±10.00a 4.00±2.00a 16.00±10.00a 0.60±0.10a
Plot Sample pH EC (μS/cm) OM (g/kg) TN (g/kg) TP (g/kg) Ca2+ (mmol/kg) Mg2+ (mmol/kg)
TWW S8 8.50 131.8 19.7 0.97 0.21 131.0 17.1
S9 8.90 135.4 11.1 0.95 0.42 182.0 24.1
S10 8.40 295.0 20.9 0.42 0.20 172.0 20.8
S11 8.30 134.7 40.9 0.48 1.21 389.0 36.3
S12 8.20 225.0 38.6 0.34 1.47 259.0 29.3
S13 8.30 87.2 24.8 0.98 0.19 141.0 26.0
S14 7.70 132.3 27.9 1.06 0.72 66.0 24.1
S15 8.04 115.5 19.5 0.22 1.10 65.0 17.0
S16 7.90 548.0 12.4 0.88 1.07 62.0 14.6
S17 8.60 360.0 30.3 1.06 2.07 226.0 29.3
S18 8.06 120.4 95.9 0.99 12.90 93.0 19.8
S19 8.30 216.0 29.9 1.23 2.43 158.0 29.2
S20 8.30 561.0 35.1 1.32 0.17 153.0 34.4
S21 8.60 233.0 30.3 0.81 7.71 227.0 33.1
S22 8.60 414.0 22.8 0.20 23.10 208.0 23.3
S23 8.80 205.0 30.1 0.66 22.10 288.0 28.3
S24 8.50 166.7 26.5 0.57 1.93 33.0 19.7
Mean 8.35±0.31a 240.1±148.2a 30.4±18.7a 0.77±0.35a 4.65±7.51a 168.0±93.0a 25.1±6.4b
Plot Sample Na+ (mmol/kg) K+ (mmol/kg) CEC (mmol/kg) Cu2+ (mg/kg) Ni2+ (mg/kg) Pb2+ (mg/kg) Cd2+ (mg/kg)
TWW S8 13.5 3.1 165 150.00 22.00 96.00 0.70
S9 8.9 2.5 217 140.00 29.00 129.00 0.60
S10 14.2 4.1 211 120.00 16.00 32.00 0.60
S11 3.5 9.6 438 170.00 44.00 52.00 0.80
S12 8.8 1.9 309 110.00 19.00 66.00 0.60
S13 5.7 5.1 178 140.00 11.00 32.00 0.80
S14 14.2 3.2 107 130.00 25.00 19.00 0.60
S15 9.1 2.7 94 260.00 14.00 42.00 0.90
S16 24.9 2.4 104 130.00 27.00 150.00 0.70
S17 21.4 5.0 282 180.00 24.00 57.00 0.90
S18 9.3 2.0 124 110.00 8.00 44.00 0.80
S19 16.7 5.4 209 220.00 23.00 54.00 0.60
S20 40.7 6.5 235 120.00 28.00 45.00 0.80
S21 20.2 5.9 286 120.00 8.00 101.00 0.70
S22 35.7 7.7 275 150.00 13.00 44.00 0.80
S23 18.3 3.5 338 190.00 18.00 194.00 0.80
S24 14.2 4.6 364 150.00 27.00 70.00 0.70
Mean 16.4±1.0a 5.0±2.7a 232±99a 152.00±41.00b 21.00±9.00b 72.00±47.00a 0.70±0.10a

Note: OM, organic matter; TN, total nitrogen; TP, total phosphorus; CEC, cation exchange capacity. For each parameter, different lowercase letters within the same column indicate the significant difference between TWW and GW at P≤0.05 level. Mean±SD.

As shown in Table 3, the mean contents of OM, TN, and TP reached 30.4, 0.77, and 4.65 g/kg in P-TWW, respectively; while they were 20.8, 0.50, and 2.22 g/kg in P-GW, respectively. The concentration of Ca2+ ranged between 48.0 and 212.0 mmol/kg in P-GW and from 33.0 to 389.0 mmol/kg in P-TWW (Table 3). The same trend was observed for Mg2+ and K+. The concentrations of Mg2+ and K+ reached 13.6 and 2.8 mmol/kg in P-GW, respectively, and 25.1 and 5.0 mmol/kg in P-TWW, respectively. Subsequently, soil CEC was greater in P-TWW (232 mmol/kg) compared to P-GW (177 mmol/kg). The accumulation of Ca2+, Mg2+, and K+ also resulted in higher pH and EC in P-TWW. The mean values of Cu2+, Pb2+, Ni2+, and Cd2+ reached 152.00, 72.00, 21.00, and 0.70 mg/kg in P-TWW, respectively, and they were 96.00, 16.00, 4.00, and 0.60 mg/kg in P-GW, respectively.

3.3 Soil pollution indices

Soil pollution indices, including SAR, ESP, Igeo, and PLI, are presented in Table 4. In this study, SAR ranged between 0.05 and 1.21 in P-GW and between 0.05 and 0.94 in P-TWW, with mean values of 0.42 and 0.41 in P-GW and P-TWW, respectively. ESP varied from 0.97% to 25.50% in P-GW, with mean value of 9.98%, and from 0.80% to 23.90% in P-TWW, with mean value of8.38%. The Igeo related to Cu2+ was higher than 5.00 in both plots, exhibiting extreme contamination. The Igeo related to Ni2+ varied from 1.60 to 3.18 in P-GW (moderate to heavy contamination) and from 3.60 to 6.06 in P-TWW (heavy to extreme contamination). The Igeo related to Pb2+ was below 0.00 in P-GW, and varied between -0.38 and 2.97 in P-TWW. The Igeo related to Cd2+ was below 0.00 for both plots, indicating un-contamination. PLI is useful to determine the risk of multi-metal pollution in soil. PLI results showed that the highest PLI is recorded in P-TWW, with a mean value of 2.33.
Table 4 Variation of soil pollution indices after irrigation with GW and TWW
Plot Sample SAR ESP (%) Igeo PLI
Pb2+ Cd2+ Ni2+ Cu2+
GW S1 0.16 4.06 -0.82 -0.67 2.60 6.06 1.51
S2 0.05 0.97 -0.82 -0.67 3.18 6.20 1.61
S3 0.08 1.78 -1.17 -1.15 3.18 6.06 1.48
S4 0.29 5.72 -0.46 -0.89 1.60 6.06 1.40
S5 0.52 11.90 0.58 -1.15 1.60 5.91 1.48
S6 1.21 25.50 -0.63 -0.89 1.60 5.74 1.34
S7 0.65 19.90 -3.04 -1.89 2.18 5.91 1.07
Mean 0.42±0.41a 9.98±9.53a -0.91±1.1a -1.04±0.42a 2.28±0.72a 5.99±0.15a 1.41±0.17a
TWW S8 0.35 8.19 2.38 -0.67 5.06 6.64 2.59
S9 0.20 4.09 0.37 -0.89 5.46 6.54 2.19
S10 0.32 6.73 1.07 -0.89 4.60 6.32 2.12
S11 0.05 0.80 1.42 -0.47 6.06 6.82 2.69
S12 0.16 2.84 0.37 -0.89 4.85 6.20 2.02
S13 0.14 3.20 -0.38 -0.47 4.06 6.54 1.89
S14 0.47 13.20 0.76 -0.89 5.24 6.44 2.21
S15 0.32 9.71 2.60 -0.30 4.41 7.44 2.76
S16 0.90 23.90 1.20 -0.67 5.35 6.44 2.36
S17 0.42 7.58 0.83 -0.30 5.18 6.91 2.42
S18 0.28 7.52 1.13 -0.47 3.60 6.20 2.00
S19 0.39 7.98 0.86 -0.89 5.12 7.20 2.35
S20 0.94 17.30 2.03 -0.47 5.41 6.32 2.56
S21 0.40 7.07 0.83 -0.67 3.60 6.32 1.94
S22 0.74 12.90 2.97 -0.47 4.30 6.64 2.60
S23 0.33 5.42 1.50 -0.47 4.77 6.98 2.45
S24 0.62 3.90 1.54 -0.67 5.35 6.64 2.47
Mean 0.41±0.25a 8.38±5.78a 1.26±0.86a -0.62±0.21a 4.85±0.68b 6.62±0.35b 2.33±0.27b

Note: ESP, exchangeable sodium percentage; Igeo, geoaccumulation index; PLI, pollution load index. For each parameter, different lowercase letters within the same column indicate the significant difference between TWW and GW at P≤0.05 level. Mean±SD.

3.4 Coefficient of variation (CV) of soil parameters

The CV of soil parameters is showed in Figure 2. In P-GW, Cu2+ and PLI had a lower CV value (10.2% and 12.3%, respectively), whereas Ca2+, Mg2+, CEC, and Cd2+ varied moderately, with CV values of 41.8%, 29.0%, 31.1%, and 25.1%, respectively. Higher CV was recorded for Na+ (91.5%), SAR (97.5%), ESP (95.5%), Pb2+ (64.3%), and Ni2+ (50.8%). In P-TWW, Cd2+ and PLI had a lower CV value (14.3% and 11.7%, respectively), while Mg2+, CEC, Ni2+, and Cu2+ varied moderately, with CV values of 25.6%, 42.6%, 43.6%, and 26.8%, respectively. Higher CV was recorded for Na+ (60.9%), K+ (53.9%), SAR (61.4%), ESP (69.1%), and Pb2+ (65.6%).
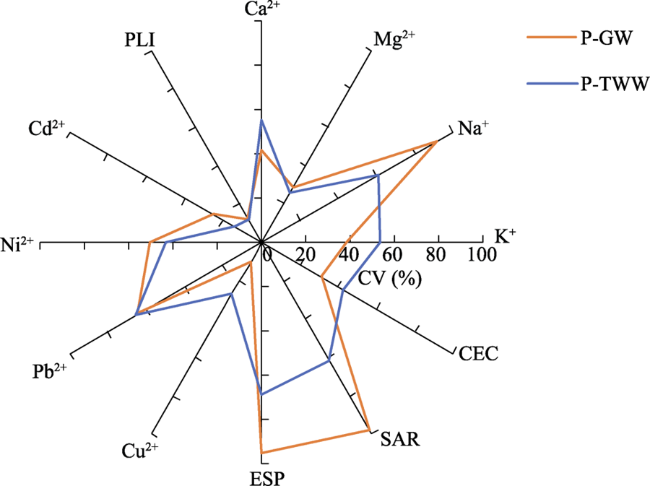
Fig. 2 Comparison of coefficient of variation (CV) of soil parameters between P-TWW and P-GW. CEC, cation exchange capacity; SAR, sodium adsorption ratio; ESP, exchangeable sodium percentage; PLI, pollution load index.

3.5 Spatial distribution of soil sodicity and metallic trace elements (MTEs)

The risk assessments of soil sodicity and MTEs were spatially analysed to further understand the soil conditions in the study area (Fig. 3). According to the Figure 3, we can see that SAR, ESP, and Na+ in P-TWW were highly abundant in the north-western (S8), south-western (S22 and S24), and south-eastern (S16 and S20) parts of the study area, reaching the maximum values for SAR (4.00-5.00), ESP (15.00%-25.00%), and Na+ (40.0-50.0 mmol/kg). Soil Ca2+ was most abundant in the north-western (S11 and S12), middle (S17), and south-eastern (S21, S22, and S23) parts of the study area. In P-TWW, Pb2+ and Ni2+ showed common hot spots in the western (S8, S15, S18, and S22), middle (S14, S17, S19, and S24), and eastern parts (S9, S10, S16, S20, and S23). In P-GW, Pb2+ was mainly concentrated in the middle (S5), whereas Ni2+ was highly abundant in the western part of study area.
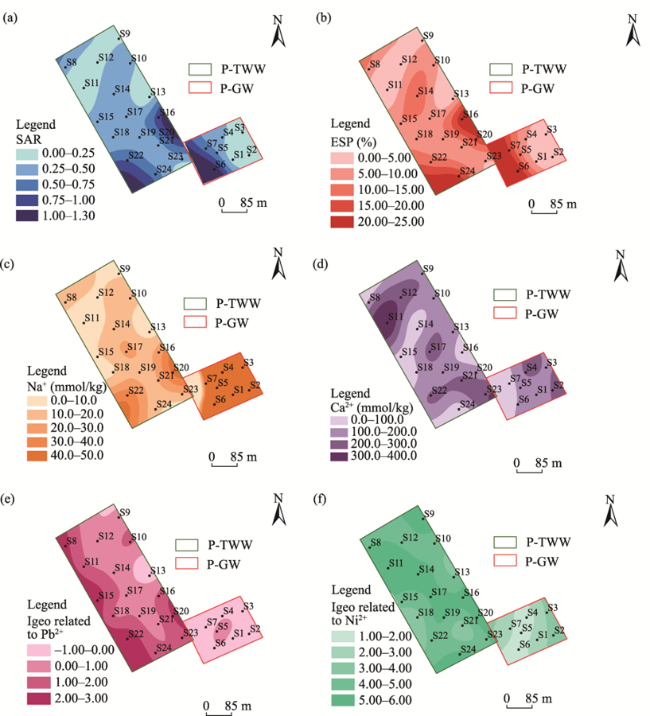
Fig. 3 Spatial distribution of SAR (a), ESP (b), Na+ (c), Ca2+ (d), geoaccumulation index (Igeo) related to Pb2+ (e), and Igeo related to Ni2+ (f) in P-TWW and P-GW

4 Discussion

4.1 Characteristics of irrigation water

The quality of irrigation water can affect soil quality positively by providing more nutrients or negatively by accumulating toxic elements that degrading the soil (Saha et al. 2019). The pH of water is an important factor that is influenced by the chemical and biological parameters of the water (Saha et al., 2019). According to the standard files, the pH value of both water samples is within the acceptable range for irrigation (6.50-8.50; Table 2). Water nutrient is determined by analyzing the concentrations of NH4+, NO3-, and PO43- (Table 2). By referring to some standard files, we found that the concentration of NH4+ exceeded the maximum allowed concentrations (1.00 mg/L) probably due to a low oxygen level in the oxidation stage of the secondary treatment. High concentration of NO3- in GW can be attributed to seawater intrusion due to the overexploitation of GW resources or the use of fertilizers in this area. Overall, the concentrations of NH4+, NO3-, and PO43- in TWW are important since they ameliorate the soil fertility by improving the plant's physiological performance (Rezapour et al., 2021). According to USDA (1954), SAR and SSP reasonably estimate the degree of irrigation water entering the soil cation exchange reaction. Irrigation water with high SAR levels can lead to the build-up of high soil Na+ levels over time, which can adversely affect soil permeability. SAR less than or equal to 10.00 is considered as excellent water quality, 10.00-18.00 as good water quality, 18.00-26.00 as doubtful water quality, and more than 26.00 as unsuitable water quality for irrigation (USDA, 1954). Water with SSP exceeding 60.00% may result in Na+ accumulation that will cause a breakdown in the soil's physical properties (Wilcox, 1955; Kadyampakeni et al., 2017). Irrigation water with the concentration of Cl- higher than the threshold may cause plant toxicity problems. Toxicity usually results in impaired growth, reduced yield, changes in the morphology of the plant, and even death. The degree of damage depends on the crop types, growth stage, the concentration of toxic ion, and climate and soil conditions (Hechmi et al., 2020a). GW samples contain higher Cl-, which may be attributed to a potential seawater intrusion (Kouzana et al., 2009), or contamination by domestic sewage used in agricultural activities in this area (Hechmi et al., 2020a). Therefore, the major element composition of GW is not controlled by water-rock reactions within the aquifer, but it is more likely to be influenced by the dissolution of soluble minerals in the unsaturated zone. The high salt content in irrigation water can affect crop yields, degrade the land, and pollute the GW (Saha et al., 2019). We can obtain the concentration of soluble salts according to EC. Comparing the irrigation water, EC is higher in GW (3610.0 µS/cm), probably due to the higher concentrations of Mg2+ and Cl- (Table 2). TSS is important in the evaluation of water quality, which is the measurement of all suspended materials in solution, whether ionized or unionized. Water pollution is determined by the analysis of COD. COD indicates the presence of suspended and dissolved organic and inorganic solids. The highest COD is observed in TWW (28.8 mg/L), but it does not exceed the maximum admissible concentration (90.0 mg/L). The possible residual organic substances in TWW may be the by-products of carbohydrate, lignin, fat, soap, synthetic detergent, and protein. The inorganic substances in TWW include a number of potentially toxic elements that have not been eliminated by the treatment process. According to the study conducted by Cherif et al. (2018), very few Tunisian wastewater treatment plants meet all the thresholds for water quality parameters regulated by the related standard. Most of the wastewater treatment plants had two or more parameters exceeding the maximum threshold values (e.g., COD, TTS, PO43-, and NO3-). Soil fertigation with such TWW can pose a potential ecological risk for soil organisms and plant growth in long-term use (Alexakis et al., 2020). Therefore, some measures should be taken to strictly monitor the wastewater treatment plants, especially when the aquifer has been recharged with these TWW (Gaaloul et al., 2012). In this case, GW shows lower levels in terms of metal and nutrient concentrations than TWW. This could be attributed to the recharge process using infiltration basins. El Ayni et al. (2011) explained that the recharge ponds serve as an additional treatment for TWW, which helps eliminate the residual pathogens contamination and fixes excessive phosphorus in the soil.

4.2 Assessment of soil quality after long-term irrigation with TWW and GW

Soil quality is influenced by three soil characteristics, namely, physical, chemical, and biological properties (Delgado and Gómez, 2016). Long-term irrigation with TWW has resulted in higher contents in soil chemical fertility parameters (e.g., OM, TN, and TP) as illustrated in Table 3. This confirms that reusing TWW can improve soil quality, the result is agreed with other research findings reported by Hadera. (2018) and Demelash et al. (2020). Soil macronutrients (Ca2+, Mg2+, and K+) have also shown higher contents in P-TWW resulting in greater CEC. Alemayehu and Bewket. (2016), Hadera (2018), and Demelash et al. (2020) reported similarly higher values of these parameters under different irrigated water sources. However, the long-term irrigation with TWW has caused an increase in soil salinity in P-TWW (Table 3). The EC values in some samples have exceeded the upper limit for non-saline soils (500.0 µS/cm; USDA, 1954). This is mainly attributed to the increase of Na+ content. Consequently, soil salinization is mainly located in the southeastern parts of the study area. Despite the high salinity of GW (EC=3610.0 µS/cm; Table 2), P-GW presented a lower EC value (109.7 µS/cm). This can be attributed to the higher sand content in P-GW (79.5%), favoring salt leaching. Pérez-Gimeno et al. (2016), Miranda et al. (2018), and Hechmi et al. (2020a, b) conducted same observations and proved that light-textured soils (with higher sand content) are generally well-drained and allow for easy leaching of soluble salts to deeper profiles under the action of rain or irrigation. Overall, the mean of SAR and ESP is below the permissible limits (13.00 and 15.00%, respectively) set by USDA (1954). Microelements, such as Cu2+, Cr2+, Fe2+, Co2+, Mn2+, Mo2+, Ni2+, Se2+, and Zn2+, are essential for soil organisms in trace amounts and become toxic at higher levels. As2+, Sb2+, Cd2+, Pb2+, Hg2+, Sn2+, and Ag2+ are, on the other hand, toxic and non-essential elements for soil organisms (Hasan et al. 2020; Hechmi et al. 2020a). Therefore, the accumulation of these elements in the soil should be considered when reusing unconventional water such as TWW in agricultural lands (Dadban Shahamat et al., 2018). Previous studies reported that the metal content is also high in the soil irrigated with TWW. For instance, Rattan et al. (2005) found that the accumulation of Zn2+, Pb2+, Ni2+, Mn2+, Fe2+, Cu2+, Cr2+, Co2+, and As2+ in the soil irrigated with TWW is higher than that irrigated with GW. Aghabarati et al. (2008) also observed a significant increase in Zn2+, Pb2+, Ni2+, and Cr2+ concentrations after seven-year urban wastewater irrigation compared to GW. Soil degradation resulting from sodicity is a major environmental impediment with severe adverse impacts on soil quality and productivity (Chaganti and Crohn, 2015). Soil degradation due to the accumulation of MTEs is another potent threat to soil quality (Golui et al., 2019). In order to understand the harm caused by Na+ in soil, it is crucial to study SAR and ESP (Kadyampakeni et al., 2017). High values of SAR imply that Na+ can replace the adsorbed Ca2+ and Mg2+, resulting in damage to the soil structure and plant root. ESP evaluates the soil sodicity; the larger the ESP, the worse the soil quality (Gao et al., 2022). Due to the strong contamination of Cu2+ and Ni2+ in the study area, heavy metals may accumulate in biological tissues through the food chain and cause deleterious effects on humans. In this study, SAR, ESP, and Na+ show a similar distribution in P-TWW, suggesting that Na+ is the major contributor to soil sodicity and alkalinization. In P-GW, SAR and ESP levels indicate higher abundances in the western part, whereas Na+ and Ca2+ accumulations are observed within the whole plot, which suggests the presence of other elements such as K+ has led to a decrease in SAR and ESP in the eastern part. The wide distribution of these parameters can be attributed to the complex interactions between intrinsic (soil texture and topography) and extrinsic factors (soil use and field management) under the climate conditions of the study area (Song et al., 2020). Previous studies verified the impacts of soil use on the spatial distribution of soil variables (Qu et al., 2012; Ferreiro et al., 2016), topographical parameters (Tang et al., 2017), and field management practices (Behera and Shukla, 2015; Guo et al., 2018). The diversity of these factors regularly leads to the redistribution of soil particles from one location to the other through erosion and deposition processes.

5 Conclusions

In this study, the potential risk of soil irrigation with TWW over 40 years is assessed and compared with a field irrigated with GW. Water analysis shows that TWW and GW samples meet the minimum requirements given by the standard files in terms of water salinity (EC, Na+, and Cl-) and sodicity (SAR and SSP). However, the concentrations of NH4+, PO43-, Cu2+, and Cd2+ in TWW exceed the permissible limits. SAR and SSP in TWW are within the recommended ranges, whereas the concentration of Cu2+ exceeds the permissible limits. The results of Igeo show that Cu2+ is the metal with the highest risk of soil pollution in both plots (Igeo>5.00). On the other hand, Cd2+ shows the lowest risk levels in both plots (Igeo<1.00). Despite the low concentrations of Pb2+ and Ni2+ in both water samples, P-TWW is moderately contaminated by Pb2+ (1.00<Igeo<2.00) and heavily to extremely contaminated by Ni2+ (4.00<Igeo≤5.00). Overall, PLI indicates that P-TWW is moderate pollution (2.33) and P-GW is un-pollution to moderate pollution (1.41). The spatial distribution of Ca2+, Na+, Ni2+, and Pb2+ is high (CV>50.0%), probably due to their mobility and leaching potential under the influence of climate, soil topography, soil texture, soil use, and anthropogenic activities. The findings recorded in this study are instructive and encourage farmers to reuse TWW. However, in order to reduce the risk of MTEs accumulation in soil, it is necessary to ensure appropriate management of unconventional water reuse.
[1]
Aghabarati A, Hosseini S M, Maralian H. 2008. Heavy metal contamination of soil and olive trees (Olea europaea L.) in suburban areas of Tehran, Iran. Research Journal of Environmental Sciences, 2(5): 323-329.

[2]
Alemayehu A, Bewket W. 2016. Local climate variability and crop production in the central highlands of Ethiopia. Environmental Development, 19: 36-48.

[3]
Alexakis D E. 2020. Suburban areas in flames: Dispersion of potentially toxic elements from burned vegetation and buildings. Estimation of the associated ecological and human health risk. Environmental Research, 183: 109153, doi: 10.1016/j.envres.2020.109153.

[4]
Bahri A. 1987. Utilization of treated wastewaters and sewage sludge in agriculture in Tunisia. Desalination, 67: 233-244.

[5]
Baize D. 1988. Guide to Common Analyzes in Soil Science. Paris: National Institute for Agronomic Research.

[6]
Behera S K, Shukla A K. 2015. Spatial distribution of surface soil acidity, electrical conductivity, soil organic carbon content and exchangeable potassium, calcium and magnesium in some cropped acid soils of India. Land Degradation & Development, 26(1): 71-79.

[7]
Bekir S, Zoghlami R I, Boudabbous K, et al. 2022. Soil physicochemical changes as modulated by treated wastewater after medium-and long-term irrigations: A case study from Tunisia. Agriculture, 12(12): 2139, doi: 10.3390/agriculture12122139.

[8]
Belaid N, Neel C, Kallel M, et al. 2012. Long term effects of treated wastewater irrigation on calcisol fertility: A case study of Sfax-Tunisia. Agricultural Sciences, 3(5): 702-713.

[9]
Ben Moussa A. 2011. Hydrogeological, hydrochemical and isotope study of the aquifer system of Hammamet-Nabeul, Cap Bon, North-Eastern Tunisia. PhD Dissertation. Sfax: National School of Sfax, 24-36. (in French)

[10]
Ben Salem H. 1992. Contribution to the knowledge of the geology of Cap Bon:stratigraphy, tectonics and sedimentology. PhD Dessertation. Tunis: University of Tunis, 134.

[11]
Bremner J M, Mulvaney C S. 1982. Nitrogen-total. In: Page A L, Miller R H, Keeney D R. Methods of Soil Analysis. Part 2. Chemical and Microbiological Properties. Madison: American Society of Agronomy and Soil Science Society of America, 595-624.

[12]
Chaganti V N, Crohn D M. 2015. Evaluating the relative contribution of physiochemical and biological factors in ameliorating a saline-sodic soil amended with composts and biochar and leached with reclaimed water. Geoderma, 259-260: 45-55.

[13]
Chakravarty I M, Patgiri A D. 2009. Metal pollution assessment in sediments of the Dikrong River, N.E. India. Journal of Human Ecology, 27(1): 63-67.

[14]
Chen C Y, Wang S W, Kim H, et al. 2021. Non-conventional water reuse in agriculture: A circular water economy. Water Research, 199: 117193, doi: 10.1016/j.watres.2021.117193.

[15]
Cherif H, Saidi H, Elfil H. 2018. Impact of treated wastewater reuse for irrigation purposes in Tunisia on crops growth, human health and soil. CPQ Nutrition, 1(6): 1-20.

[16]
Cherif S, El Ayni F, Jrad A, et al. 2013. Aquifer recharge by treated wastewaters: Korba case study (Tunisia). Sustainable Sanitation Practice, 14: 41-48.

[17]
Dadban Shahamat Y, Asgharnia H, Kalankesh L R, et al. 2018. Data on wastewater treatment plant by using wetland method, Babol, Iran. Data in Brief, 16: 1056-1061.

[18]
Dare A E, Mohtar R H, Jafvert C T, et al. 2017. Opportunities and challenges for treated wastewater reuse in the West Bank, Tunisia, and Qatar. Transactions of the American Society of Agricultural and Biological Engineers, 60(5): 1563-1574.

[19]
Delgado A, Gómez J A. 2016. The Soil. Physical, chemical and biological properties. In: Villalobos F J, Fereres E. Principles of Agronomy for Sustainable Agriculture. Cham: Springer, 15-26.

[20]
Demelash W, Mekonen A, Partap S, et al. 2020. Effect of on-farm water management practices and irrigation water source on soil quality in Central Ethiopia. African Journal of Agricultural Research, 16(11): 1481-1495.

[21]
El Ayni F, Cherif S, Jrad A, et al. 2011. Impact of treated wastewater reuse on agriculture and aquifer recharge in a coastal area: Korba case study. Water Resources Management, 25: 2251-2265.

[22]
FAO Food and Agriculture Organization of the United Nations. 2003. FAO Yearbook: Production. Rome: FAO, 164-166.

[23]
Ferreiro J P, de Almeida V P, Alves M C, et al. 2016. Spatial variability of soil organic matter and cation exchange capacity in an Oxisol under different land uses. Communications in Soil Science and Plant Analysis, 47: 75-89.

[24]
Gaaloul N. 2008. The role of groundwater during drought in Tunisia. In: Zereini F, Hötzl H. Climatic Changes and Water Resources in the Middle East and North Africa. Environmental Science and Engineering. Heidelberg: Springer.

[25]
Gaaloul N. 2011. Water resources and management in Tunisia. International Journal of Water, 6: 92-116.

[26]
Gaaloul N, Carry L, Casanova J, et al. 2012. Effect of artificial recharge by treated wastewater on the quality and quantity of the Korba-Mida coastal aquifer (Cap Bon, Tunisia). La Houille Blanche - Revue internationale de l'eau, 4-5: 24-33.

[27]
Gao J Z, Zhao Q Z, Chang D D, et al. 2022. Assessing the effect of physicochemical properties of saline and sodic soil on soil microbial communities. Agriculture, 12(6): 782, doi: 10.3390/agriculture12060782.

[28]
Gargouri B, Ben Brahim S, Marrakchi F, et al. 2022. Impact of wastewater spreading on properties of Tunisian soil under arid climate. Sustainability, 14(6): 3177, doi: 10.3390/su14063177.

[29]
Gatta G, Libutti A, Gagliardi A, et al. 2020. Wastewater reuse in agriculture:Effects on soil-plant system properties. In: Pérez Solsona S, Montemurro N, Chiron S, et al. Interaction and Fate of Pharmaceuticals in Soil-Crop Systems. The Handbook of Environmental Chemistry. Cham: Springer.

[30]
Golui D, Datta S P, Dwivedi B S, et al. 2019. Assessing soil degradation in relation to metal pollution-A multivariate approach. Soil and Sediment Contamination: An International Journal, doi: 10.1080/15320383.2019.1640660.

[31]
Guo X, Li H Y, Yu H M, et al. 2018. Drivers of spatio-temporal changes in paddy soil pH in Jiangxi Province, China from 1980 to 2010. Scientific Reports, 8: 2702, doi: 10.1038/s41598-018-20873-5.

[32]
Hadera D. 2018. Impact of surface and ground water salinity on soil and plant productivity in the central rift valley region around Lake Ziway. Academia Journal of Environmental Sciences, 6: 67-84.

[33]
Han J, Mammadov Z, Kim M, et al. 2021. Spatial distribution of salinity and heavy metals in surface soils on the Mugan Plain, the Republic of Azerbaijan. Environmental Monitoring and Assessment, 193: 95, doi: 10.1007/s10661-021-08877-7.

[34]
Hasan A B, Reza A H M S, Kabir S, et al. 2020. Accumulation and distribution of heavy metals in soil and food crops around the ship breaking area in southern Bangladesh and associated health risk assessment. SN Applied Sciences, 2: 155, doi: 10.1007/s42452-019-1933-y.

[35]
Hechmi S, Hamdi H, Mokni-Tlili S, et al. 2020a. Impact of urban sewage sludge on soil physico-chemical properties and phytotoxicity as influenced by soil texture and reuse conditions. Journal of Environmental Quality, 49(4): 973-986.

[36]
Hechmi S, Hamdi H, Mokni-Tlili S, et al. 2020b. Carbon mineralization, biological indicators, and phytotoxicity to assess the impact of urban sewage sludge on two light-textured soils in a microcosm. Journal of Environmental Quality, 49(2): 460-471.

[37]
Hechmi S, Hamdi H, Mokni-Tlili S, et al. 2021. Variation of soil properties with sampling depth in two different light-textured soils after repeated applications of urban sewage sludge. Journal of Environmental Management, 297: 113355, doi: 10.1016/j.jenvman.2021.113355.

[38]
Hechmi S, Zoghlami R I, Khelil M N, et al. 2022. Cumulative effect of sewage sludge application on soil adsorption complex and nutrient balance: a field study in semi-arid region (Oued Souhil, Tunisia). Arabian Journal of Geosciences, 15: 54, doi: 10.1007/s12517-021-09369-1.

[39]
INNORPI (National Institute for Standardization and Industrial Property) 1989. Environmental Protection-Use of Treated Wastewater for Agricultural Purposes: Physico-chemical and Biological Specifications (NT 106.03). National Institute for Standardization and Intellectual Property, Tunisia. (in French)

[40]
Jimoh A, Agbaji E B, Ajibola V O, et al. 2020. Application of pollution load indices, enrichment factors, contamination factor and health risk assessment of heavy metals pollution of soils of welding workshops at Old Panteka market, Kaduna-Nigeria. Open Journal of Analytical and Bioanalytical Chemistry, 4(1): 11-19.

[41]
Kadyampakeni D, Appoh R, Barron J, et al. 2017. Analysis of water quality of selected irrigation water sources in northern Ghana. Water Science and Technology: Water Supply, 18: 1308-1317.

[42]
Kallel M, Belaid N, Ayoub T, et al. 2012. Effects of Treated Wastewater Irrigation on Soil Salinity and Sodicity at El Hajeb Region (Sfax-Tunisia). Journal of Arid Land Studies, 22: 65-68.

[43]
Khaskhoussy K, Kahlaoui B, Nefzi B M, et al. 2015. Effect of treated wastewater irrigation on heavy metals distribution in a Tunisian soil. Engineering, Technology & Applied Science Research, 5: 805-810.

[44]
Klay S, Charef A, Ayed L, et al. 2010. Effect of irrigation with treated wastewater on geochemical properties (saltiness, C, N and heavy metals) of isohumic soils (Zaouit Sousse perimeter, Oriental Tunisia). Desalination, 253: 180-187.

[45]
Kouzana L, Mammou A B, Felfoul M S. 2009. Seawater intrusion and associated processes: Case of the Korba aquifer (Cap-Bon, Tunisia). Comptes Rendus Geoscience, 341: 21-35.

[46]
Kowalik R, Latosińska J, Gawdzik J. 2021. Risk analysis of heavy metal accumulation from sewage sludge of selected wastewater treatment plants in Poland. Water, 13(15): 2070, doi: 10.3390/w13152070.

[47]
Kumar S, Sachdeva S, Bhat K V, et al. 2018. Plant responses to drought stress:Physiological, biochemical and molecular basis. In: Vats S. Biotic and Abiotic Stress Tolerance in Plants. Singapore: Springer.

[48]
Lerat-Hardy A, Coynel A, Schäfer J, et al. 2021. Impacts of highway runoff on metal contamination including rare earth elements in a small urban watershed: Case study of Bordeaux Metropole (SW France). Archives of Environmental Contamination and Toxicology, 82: 206-226.

[49]
Loska K, Wiechuła D, Korus I. 2004. Metal contamination of farming soils affected by industry. Environment International, 30: 159-165.

[50]
Loveday J. 1974. Methods for Analysis of Irrigated Soils. Farnham Royal: Commonwealth Bureau of Soils and Commonwealth Agricultural Bureau.

[51]
Mahgoub N, Mohamed A I, Ali O M. 2017. Effect of different irrigation systems on root growth of maize and cowpea plants in sandy soil. Eurasian Journal of Soil Science, 64: 374-379.

[52]
Mahmoudi M, Khelil M N, Hechmi S, et al. 2022. Effect of surface and subsurface drip irrigation with treated wastewater on soil and water productivity of Okra (Abemoschus esculentus) crop in semi-arid region of Tunisia. Agriculture, 12(12): 2048, doi: 10.3390/agriculture12122048.

[53]
Mahmud M S, Roy S. 2020. Physico-chemical properties of soils collected from different agricultural lands of Chittagong district of Bangladesh. Academia Journal of Environmental Science, 8: 22-29.

[54]
Mkhinini M, Boughattas I, Alphonse V, et al. 2020. Heavy metal accumulation and changes in soil enzymes activities and bacterial functional diversity under long-term treated wastewater irrigation in East Central region of Tunisia (Monastir governorate). Agricultural Water Management, 235: 106150, doi: 10.1016/j.agwat.2020.106150.

[55]
Miranda A R M, Antunes J E L, Araujo F F, et al. 2018. Less abundant bacterial groups are more affected than the most abundant groups in composted tannery sludge-treated soil. Scientific Reports, 8: 11755, doi: 10.1038/s41598-018-30292-1.

[56]
Muller G. 1969. Index of geoaccumulation in sediments of the Rhine River. Geology Journal, 2: 108-118.

[57]
Omrani N, Ouessar M. 2012. Integrated water management in Tunisia:Meeting the climate hange challenges. In: Choukr-Allah R, Ragab R, Rodriguez-Clemente R. Integrated Water Resources Management in the Mediterranean Region. Dordrecht: Springer.

[58]
Pauwels J, Van Ranst E, Verloo M, et al. 1992. Pedology Laboratory Manual-Methods Soil and Plant Analyses; Glassware and Chemical Equipment and Inventory Management. Belgium: Agricultural Publication, 180. (in French)

[59]
Pérez-Gimeno A, Navarro-Pedreño J, Almendro-Candel M B, et al. 2016. Environmental consequences of the use of sewage sludge compost and limestone outcrop residuefor soil restoration: Salinity and trace elements pollution. Journal of Soils and Sediments, 16: 1012-1021.

[60]
Qu M K, Li W D, Zhang C R, et al. 2012. Effect of land use types on the spatial prediction of soil nitrogen. GI Science & Remote Sensing, 49: 397-411.

[61]
Rattan R K, Datta S P, Chhonkar P K, et al. 2005. Long-term impact of irrigation with sewage effluents on heavy metal content in soils, crops and groundwater—a case study. Agriculture, Ecosystems & Environment, 109(3-4): 310-322.

[62]
Rezapour S, Nouri A, Jalil H M, et al. 2021. Influence of treated wastewater irrigation on soil nNutritional-chemical attributes using soil quality index. Sustainability, 13: 1952, doi: 10.3390/su13041952.

[63]
Saha S, Reza A H M S, Roy M K. 2019. Hydrochemical evaluation of groundwater quality of the Tista floodplain, Rangpur, Bangladesh. Applied Water Science, 9: 198, doi: 10.1007/s13201-019-1085-7.

[64]
Salifu M, Aidoo F, Hayford M S, et al. 2015. Evaluating the suitability of groundwater for irrigational purposes in some selected districts of the Upper West region of Ghana. Applied Water Science, 7: 653-662.

[65]
Song F F, Xu M G, Duan Y H, et al. 2020. Spatial variability of soil properties in red soil and its implications for site-specific fertilizer management. Journal of Integrative Agriculture, 19(9): 2313-2325.

[66]
Tang X L, Xia M P, Pérez-Cruzado C, et al. 2017. Spatial distribution of soil organic carbon stock in Moso bamboo forests in subtropical China. Scientific Reports, 7: 42640, doi: 10.1038/srep42640.

[67]
Taylor M D. 2000. Determination of total phosphorus in soil using simple Kjeldahl digestion. Communications in Soil Sciences and Plant Analysis, 31(15-16): 2665-2670.

[68]
Tortajada C. 2020. Contributions of recycled wastewater to clean water and sanitation Sustainable Development Goals. npj Clean Water, 3: 22, doi: 10.1038/s41545-020-0069-3.

[69]
Tyopine A A, Jayeoye T J, Okoye C O B. 2018. Geoaccumulation assessment of heavy metal pollution in Ikwo soils, eastern Nigeria. Environmental Monitoring and Assessment, 190: 58, doi: 10.1007/s10661-017-6423-3.

[70]
USDA United States Department of Agriculture. 1954. Diagnosis and Improvement of Saline and Alkali Soils. Agricultural Handbook. CA: United States Salinity Laboratory.

[71]
Warrick A W, Nielsen D R. 1980. Spatial variability of soil physical properties in the field. In: Hillel D. Applications of Soil Physics. New York: Academic Press.

[72]
Wilcox V. 1955. Classification and Use of Irrigation Water. Washington DC: US Department of Agriculture.

[73]
World Bank. 2017. Water Security. Beyond Scarcity: Water Security in the Middle East and North Africa. [2022-05-19]. https://doi.org/10.1596/978-1-4648-1144-9_ch1.

[74]
Zhu G F, He Y Q, Pu T, et al. 2012. Spatial distribution and temporal trends in potential evapotranspiration over Hengduan Mountains region from 1960 to 2009. Journal of Geographical Sciences, 22: 71-85.

[75]
Zoghlami R I, Hechmi S, Weghlani R, et al. 2021. Biochar derived from domestic sewage sludge: Influence of temperature pyrolysis on biochars' chemical properties and phytotoxicity. Journal of Chemistry, 2021: 1818241, doi: 10.1155/2021/1818241.

Outlines

/