
Wind dynamic environment and wind-sand erosion and deposition processes on different surfaces along the Dunhuang-Golmud railway, China
Received date: 2022-12-09
Revised date: 2023-03-06
Accepted date: 2023-03-21
Online published: 2023-04-30
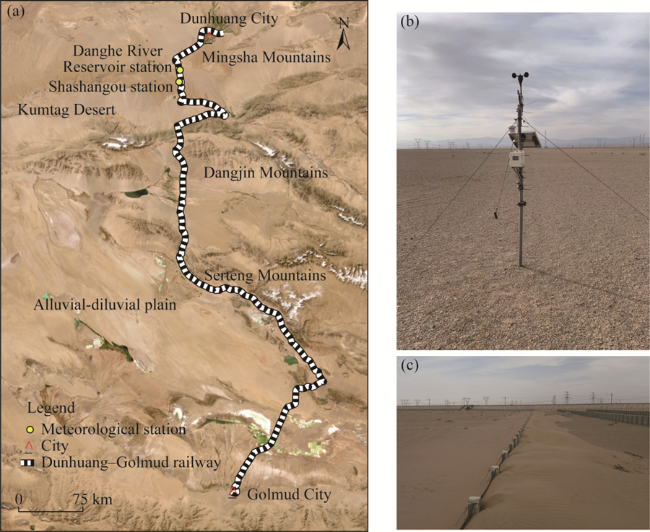
The Dunhuang-Golmud railway passes through different deserts in arid areas, especially drifting-sand desert and sandy-gravel Gobi. The near-surface wind environment and wind-sand transport process vary due to different external factors, such as topography, vegetation, and regional climate, resulting in evident spatial differences in surface erosion and deposition. Consequently, the measures for preventing wind-sand hazards will differ. However, the mechanism and control theory of sand damage remain poorly understood. In this study, we used meteorological observation, three-dimensional (3D) laser scanning, and grain-size analysis to compare and evaluate the spatial distribution of wind conditions, sand erosion and deposition patterns, and grain composition in the drifting-sand desert and sandy-gravel Gobi along the Dunhuang-Golmud railway in China. Results show that the annual mean wind speed, the frequency of sand-driving wind, and the drift potential of sandy-gravel Gobi are higher than those of drifting-sand desert, indicating a greater wind strength in the sandy-gravel Gobi, which exhibits spatial heterogeneity in wind conditions. The major sediment components in sandy-gravel Gobi are very fine sand, fine sand, and medium sand, and that in drifting-sand desert are very fine sand and fine sand. We found that the sediment in the sandy-gravel Gobi is coarser than that in the drifting-sand desert based on mean grain size and sediment component. The spatial distributions of sand erosion and deposition in the sandy-gravel Gobi and drifting-sand desert are consistent, with sand deposition mainly on the west side of the railway and sand erosion on the east side of the railway. The area of sand deposition in the drifting-sand desert accounts for 75.83% of the total area, with a mean deposition thickness of 0.032 m; while the area of sand deposition in the sandy-gravel Gobi accounts for 65.31% of the total area, with a mean deposition thickness of 0.028 m, indicating greater deposition amounts in the drifting-sand desert due to the presence of more fine sediment components. However, the sand deposition is more concentrated with a greater thickness on the embankment and track in the sandy-gravel Gobi and is dispersed with a uniform thickness in the drifting-sand desert. The sand deposition on the track of the sandy-gravel Gobi mainly comes from the east side of the railway. The results of this study are helpful in developing the preventive measures and determining appropriate selection and layout measures for sand control.
ZHANG Hongxue , ZHANG Kecun , AN Zhishan , YU Yanping . Wind dynamic environment and wind-sand erosion and deposition processes on different surfaces along the Dunhuang-Golmud railway, China[J]. Journal of Arid Land, 2023 , 15(4) : 393 -406 . DOI: 10.1007/s40333-023-0099-z
Fig. 1 Overview of the Dunhuang-Golmud railway (a) and the photos of the sandy-gravel Gobi (b) and drifting-sand desert (c) |
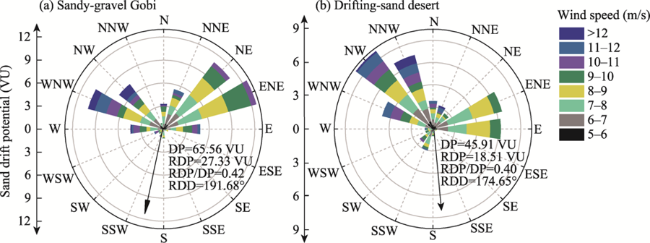
Fig. 2 Rose of sand drift potential (DP) in the sandy-gravel Gobi (a) and drifting-sand desert (b). RDP and RDD represent resultant drift potential and resultant drift direction, respectively. N, north; NNE, north-northeast; NE, northeast; ENE, east-northeast; E, east; ESE, east-southeast; SE, southeast; SSE, south-southeast; S, south; SSW, south-southwest; SW, southwest; WSW, west-southwest; W, west; WNW, west-northwest; NW, northwest; NNW, north-northwest. |
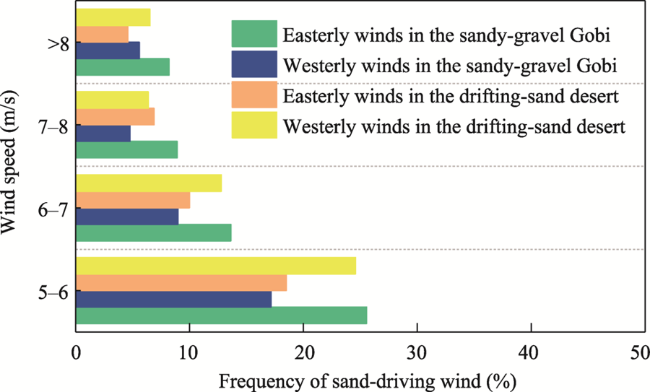
Fig. 3 Frequency of sand-driving wind of easterly and westerly winds in the sandy-gravel Gobi and drifting-sand desert |
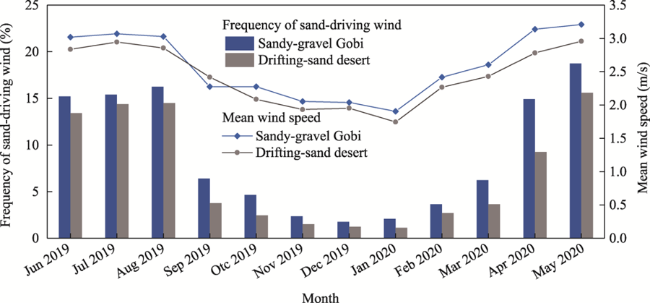
Fig. 4 Monthly variation of the frequency of sand-driving wind and mean wind speed in the sandy-gravel Gobi and drifting-sand desert |
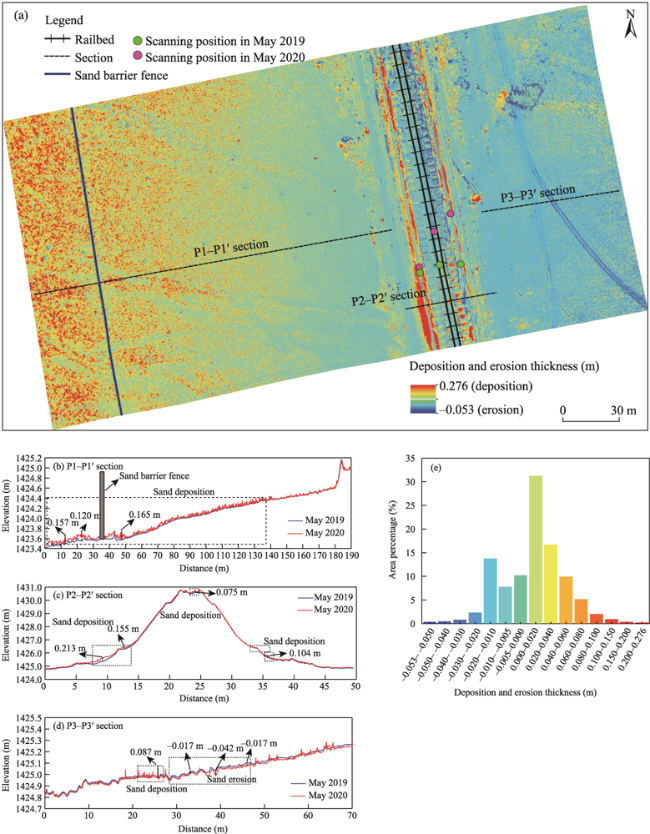
Fig. 5 (a), erosion and deposition on the surfaces of the sandy-gravel Gobi; (b, c, and d), elevation changes along the P1-P1° P2-P2° and P3-P3° sections, respectively; (e), the area percentage of different deposition and erosion thicknesses on the surfaces of the sandy-gravel Gobi. The positive values of deposition and erosion thickness indicate sand deposition, and the negative values of deposition and erosion thickness represent erosion. |
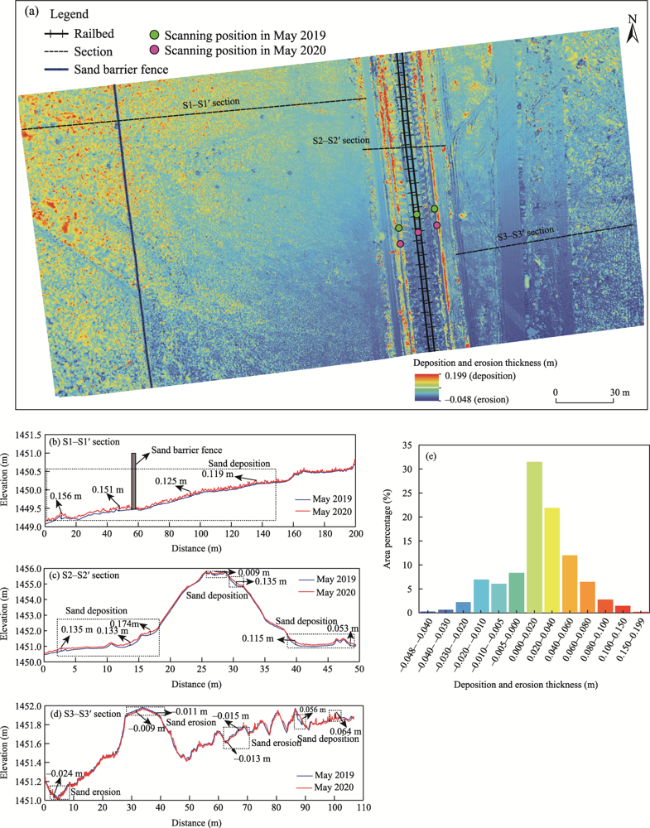
Fig. 6 (a), erosion and deposition on the surfaces of the drifting-sand desert; (b, c, and d), elevation changes along the S1-S1°, S2-S2°, and S3-S3° sections, respectively; (e), the area percentage of different deposition and erosion thicknesses on the surfaces of the drifting-sand desert. The positive values of deposition and erosion thickness indicate sand deposition, and the negative values of deposition and erosion thickness represent erosion. |
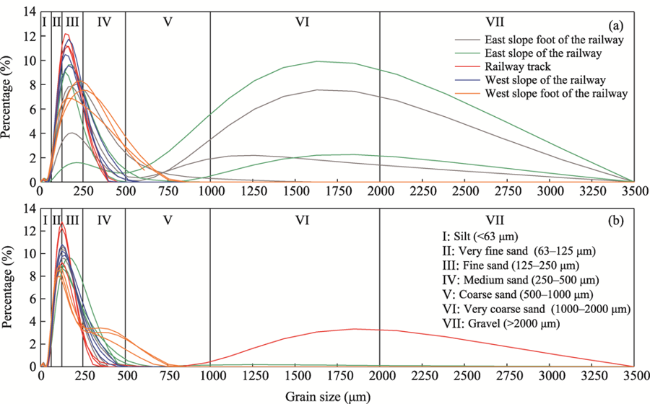
Fig. 7 Grain size distribution of sediments in the sandy-gravel Gobi (a) and drifting-sand desert (b). Each color has three grain size distribution curves, representing three samples from the same sampling site. |
Table 1 Grain size composition and characteristic in the sandy-gravel Gobi and drifting-sand desert |
| Desert type | Sample site | Grain size composition | Grain size characteristic | ||||||||
|---|---|---|---|---|---|---|---|---|---|---|---|
| Silt (%) | Very fine sand (%) | Fine sand (%) | Medium sand (%) | Coarse sand (%) | Very coarse sand (%) | Gravel (%) | Mz (μm) | σ | SK | ||
| Sandy- gravel Gobi | ESF | 5.17 | 14.23 | 36.67 | 16.56 | 6.13 | 14.29 | 6.94 | 336.63 | 1.41 | 0.09 |
| ES | 3.51 | 16.38 | 36.05 | 10.94 | 5.66 | 17.64 | 9.83 | 333.36 | 1.07 | 0.11 | |
| RT | 3.76 | 26.50 | 60.27 | 9.48 | 0.00 | 0.00 | 0.00 | 155.60 | 0.62 | 0.07 | |
| WS | 4.49 | 24.24 | 57.04 | 14.13 | 0.10 | 0.00 | 0.00 | 165.06 | 0.69 | 0.06 | |
| WSF | 6.88 | 17.36 | 41.19 | 29.09 | 5.48 | 0.00 | 0.00 | 201.98 | 0.98 | 0.13 | |
| Drifting- sand desert | ESF | 8.87 | 34.88 | 49.42 | 6.70 | 0.13 | 0.00 | 0.00 | 135.49 | 0.75 | 0.10 |
| ES | 7.89 | 30.01 | 47.75 | 12.94 | 1.08 | 0.25 | 0.08 | 150.43 | 0.81 | 0.03 | |
| RT | 4.94 | 37.14 | 48.31 | 2.66 | 0.24 | 3.81 | 2.89 | 170.10 | 0.98 | -0.17 | |
| WS | 6.62 | 34.36 | 50.39 | 8.53 | 0.10 | 0.00 | 0.00 | 141.79 | 0.71 | 0.03 | |
| WSF | 10.68 | 35.83 | 34.50 | 12.30 | 6.70 | 0.00 | 0.00 | 146.46 | 1.00 | -0.17 | |
Note: Mz, mean grain size; σ, sorting coefficient; SK, skewness. ESF, ES, RT, WS, and WSF represent the east slope foot of the railway, the east slope of the railway, the railway track, the west slope of the railway, and the west slope foot of the railway, respectively. |
| [1] |
|
| [2] |
|
| [3] |
|
| [4] |
|
| [5] |
|
| [6] |
|
| [7] |
|
| [8] |
|
| [9] |
|
| [10] |
|
| [11] |
|
| [12] |
|
| [13] |
|
| [14] |
|
| [15] |
|
| [16] |
|
| [17] |
|
| [18] |
|
| [19] |
|
| [20] |
|
| [21] |
|
| [22] |
|
| [23] |
|
| [24] |
|
| [25] |
|
| [26] |
|
| [27] |
|
| [28] |
|
| [29] |
|
| [30] |
|
| [31] |
|
| [32] |
|
| [33] |
|
| [34] |
|
| [35] |
|
| [36] |
|
| [37] |
|
| [38] |
|
| [39] |
|
| [40] |
|
| [41] |
|
| [42] |
|
| [43] |
|
| [44] |
|
| [45] |
|
| [46] |
|
| [47] |
|
| [48] |
|
| [49] |
|
| [50] |
|
/
| 〈 |
|
〉 |