
Predicting potential invasion risks of Leucaena leucocephala (Lam.) de Wit in the arid area of Saudi Arabia
Received date: 2024-01-29
Revised date: 2024-05-28
Accepted date: 2024-06-21
Online published: 2025-08-14
Haq S MARIFATUL , Darwish MOHAMMED , Waheed MUHAMMAD , Kumar MANOJ , Siddiqui H MANZER , Bussmann W RAINER . [J]. Journal of Arid Land, 2024 , 16(7) : 983 -999 . DOI: 10.1007/s40333-024-0020-4
The presence of invasive plant species poses a substantial ecological impact, thus comprehensive evaluation of their potential range and risk under the influence of climate change is necessary. This study uses maximum entropy (MaxEnt) modeling to forecast the likelihood of Leucaena leucocephala (Lam.) de Wit invasion in Saudi Arabia under present and future climate change scenarios. Utilizing the MaxEnt modeling, we integrated climatic and soil data to predict habitat suitability for the invasive species. We conducted a detailed analysis of the distribution patterns of the species, using climate variables and ecological factors. We focused on the important influence of temperature seasonality, temperature annual range, and precipitation seasonality. The distribution modeling used robust measures of area under the curve (AUC) and receiver-operator characteristic (ROC) curves, to map the invasion extent, which has a high level of accuracy in identifying appropriate habitats. The complex interaction that influenced the invasion of L. leucocephala was highlighted by the environmental parameters using Jackknife test. Presently, the actual geographic area where L. leucocephala was found in Saudi Arabia was considerably smaller than the theoretical maximum range, suggesting that it had the capacity to expand further. The MaxEnt model exhibited excellent prediction accuracy and produced reliable results based on the data from the ROC curve. Precipitation and temperature were the primary factors influencing the potential distribution of L. leucocephala. Currently, an estimated area of 216,342 km2 in Saudi Arabia was at a high probability of invasion by L. leucocephala. We investigated the potential for increased invasion hazards in the future due to climate change scenarios (Shared Socioeconomic Pathways (SSPs) 245 and 585). The analysis of key climatic variables, including temperature seasonality and annual range, along with soil properties such as clay composition and nitrogen content, unveiled their substantial influence on the distribution dynamic of L. leucocephala. Our findings indicated a significant expansion of high risk zones. High-risk zones for L. leucocephala invasion in the current climate conditions had notable expansions projected under future climate scenarios, particularly evident in southern Makkah, Al Bahah, Madina, and Asir areas. The results, backed by thorough spatial studies, emphasize the need to reduce the possible ecological impacts of climate change on the spread of L. leucocephala. Moreover, the study provides valuable strategic insights for the management of invasion, highlighting the intricate relationship between climate change, habitat appropriateness, and the risks associated with invasive species. Proactive techniques are suggested to avoid and manage the spread of L. leucocephala, considering its high potential for future spread. This study enhances the overall comprehension of the dynamics of invasive species by combining modeling techniques with ecological knowledge. It also provides valuable information for decision-making to implement efficient conservation and management strategies in response to changing environmental conditions.
Key words: area under the curve; invasive species; invasion risks; climate change; MaxEnt model
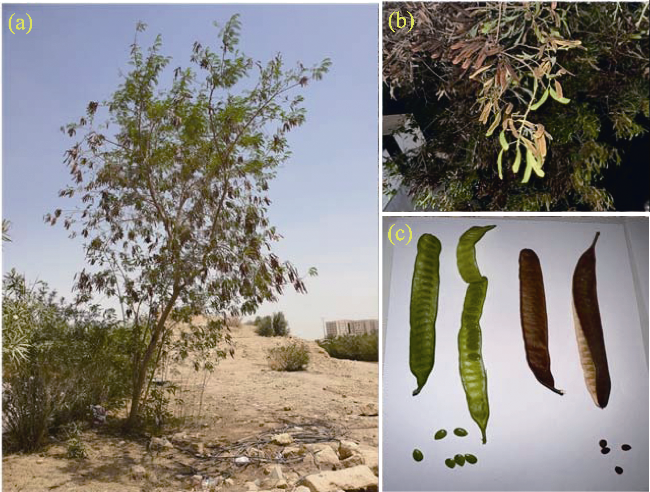
Fig. 1 Leucaena leucocephala (Lam.) de Wit tree in Saudi Arabia. (a), invaded in degraded habitat; (b), mature tree with saplings; (c), seeds and fruit. |
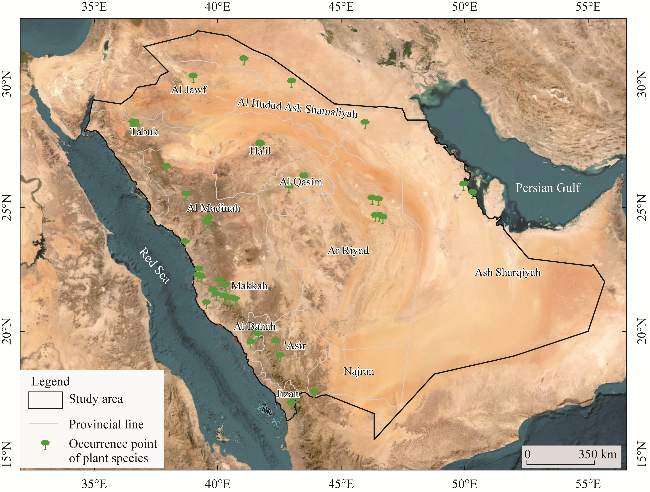
Fig. 2 Occurrence points of L. leucocephala in Saudi Arabia |
Table S1 Environmental predictors used in the species distribution model (SDM) for Leucaena leucocephala (Lam.) de Wit |
| Name of variable & description | Code | Unit | Resolution | Database |
|---|---|---|---|---|
| Annual mean temperature | bio1 | °C | 30 arc s | WorldClim |
| Mean diurnal range of temperature | bio2 | °C | 30 arc s | WorldClim |
| Isothermality ((Bio2/Bio7)×100%) | bio3 | % | 30 arc s | WorldClim |
| Temperature seasonality | bio4 | °C | 30 arc s | WorldClim |
| Maximum temperature of the warmest month | bio5 | °C | 30 arc s | WorldClim |
| Minimum temperature of the coldest month | bio6 | °C | 30 arc s | WorldClim |
| Temperature annual range | bio7 | °C | 30 arc s | WorldClim |
| Mean temperature of the wettest quarter | bio8 | °C | 30 arc s | WorldClim |
| Mean temperature of the driest quarter | bio9 | °C | 30 arc s | WorldClim |
| Mean temperature of the warmest quarter | bio10 | °C | 30 arc s | WorldClim |
| Mean temperature of the coldest quarter | bio11 | °C | 30 arc s | WorldClim |
| Annual precipitation | bio12 | mm | 30 arc s | WorldClim |
| Precipitation of the wettest month | bio13 | mm | 30 arc s | WorldClim |
| Precipitation of the driest month | bio14 | mm | 30 arc s | WorldClim |
| Precipitation seasonality (CV) | bio15 | % | 30 arc s | WorldClim |
| Precipitation of the wettest quarter | bio16 | mm | 30 arc s | WorldClim |
| Precipitation of the driest quarter | bio17 | mm | 30 arc s | WorldClim |
| Precipitation of the warmest quarter | bio18 | mm | 30 arc s | WorldClim |
| Precipitation of the coldest quarter | bio19 | mm | 30 arc s | WorldClim |
| Bulk density | BD | cg/cm3 | 30 arc s | SoilGrids |
| Cation exchange capacity (pH=7) | CEC | mmol/kg | 30 arc s | SoilGrids |
| Volumetric fraction of coarse fragments (>2 mm) | cfvo | cm3/dm3 | 30 arc s | SoilGrids |
| Clay content | clay | g/kg | 30 arc s | SoilGrids |
| Total nitrogen | nitrogen | cg/kg | 30 arc s | SoilGrids |
| Organic carbon density | OCD | μg/dm3 | 30 arc s | SoilGrids |
| Soil pH | phh2o | - | 30 arc s | SoilGrids |
| Sand content | sand | g/kg | 30 arc s | SoilGrids |
| Silt content | silt | g/kg | 30 arc s | SoilGrids |
| Soil organic carbon | SOC | dg/kg | 30 arc s | SoilGrids |
| Land cover | LC | - | 30 arc s | http://www-modis.bu.edu/landcover |
| Population density | PD | - | 30 arc s | http://www.ornl.gov/sci/landscan |
Note: - means no unit. |
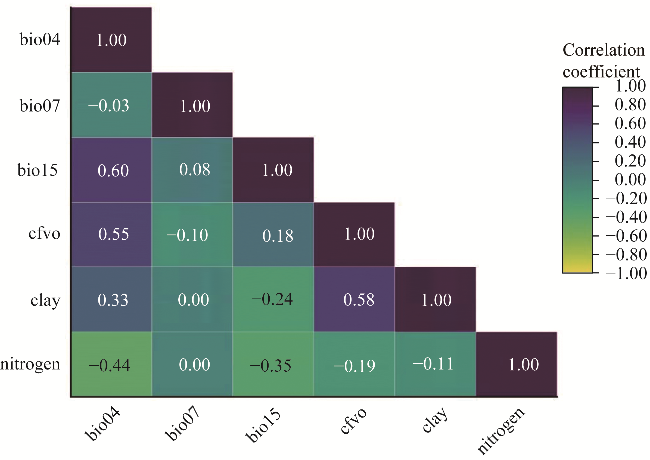
Fig. 3 Pairwise correlation among biophysical and climatic variables in the distribution modeling of L. leucocephala. bio04, temperature seasonality; bio07, temperature annual range; bio15, precipitation seasonality; cfvo, volumetric fraction of coarse fragments (>2 mm). The abbreviations are the same in the following figures. |
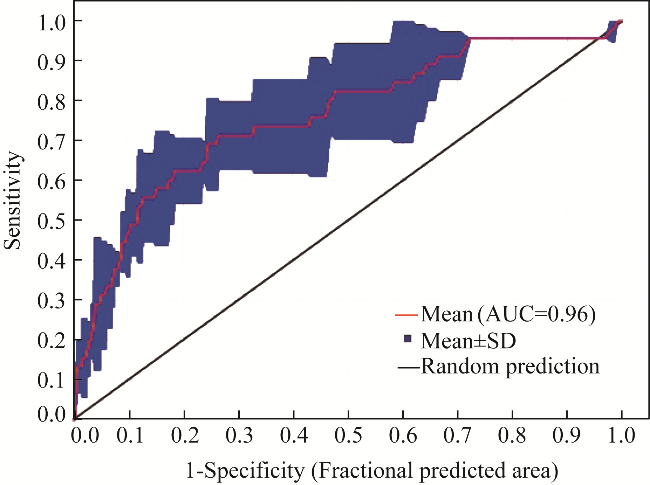
Fig. 4 Graphical representation of the receiver-operator characteristic (ROC) curve, which serves as a visualization of the predictive performance of the MaxEnt model. The precision of the model, quantified by an area under the curve (AUC) score of 0.96, is indicative of its ability to effectively discriminate between true positives and false positives. SD, standard errors. |
Table 1 Weighing the importance of various factors |
| Description | Code | Percentage of contribution (%) |
|---|---|---|
| Temperature seasonality | bio04 | 41.30 |
| Temperature annual range | bio07 | 21.40 |
| Precipitation seasonality | bio15 | 12.70 |
| Volumetric fraction of coarse fragments (>2 mm) | cfvo | 10.80 |
| Clay content | clay | 7.20 |
| Total nitrogen | nitrogen | 6.60 |
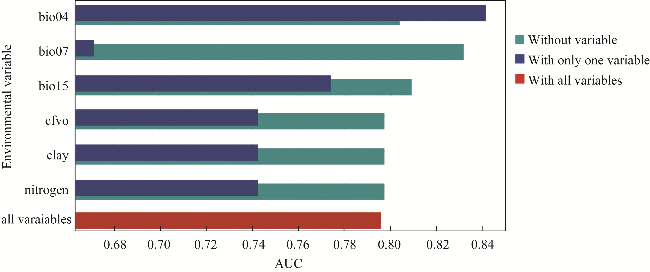
Fig. 5 Analysis result of the MaxEnt model for L. leucocephala using the Jackknife test to evaluate the predictive effectiveness of environmental parameters. AUC, area under the curve. |
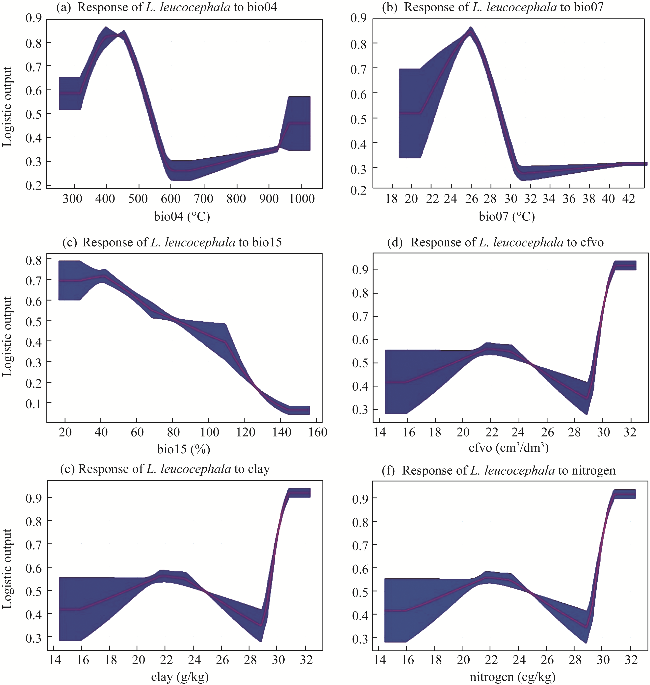
Fig. 6 Parameters influencing the distribution of L. leucocephala. (a), bio04; (b), bio07; (c), bio15; (d), cfvo; (e), clay; (f), nitrogen. |
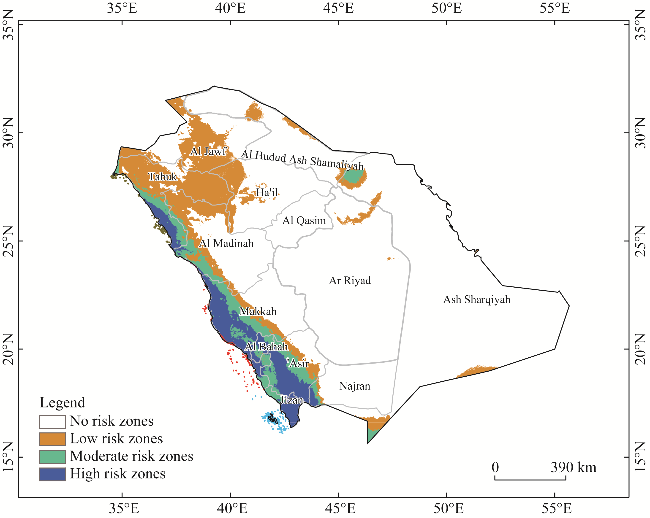
Fig. 7 MaxEnt prediction result showing the distributed areas of L. leucocephala under current climate circumstances |
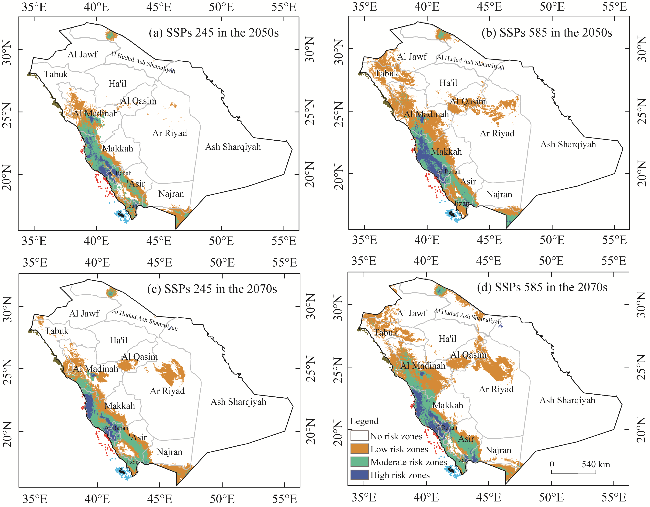
Fig. 8 MaxEnt prediction result showing the distributed areas of L. leucocephala under several climate change scenarios. (a), shared socioeconomic pathways (SSPs) 245 in the 2050s; (b), SSPs 585 in the 2050s; (c), SSPs 245 in the 2070s; (d), SSPs 585 in the 2070s. |
Table 2 Area variation in L. leucocephala invasion under diverse climate change projections |
| Climate change scenario | Area of invasion of L. leucocephala under different evaluated invasion risk classes (km2) | Total area under invasion risks (km2) | |||
|---|---|---|---|---|---|
| No risk zones | Low risk zones | Moderate risk zones | High risk zones | ||
| Current climate | 1,404,315 | 205,320 | 304,235 | 216,342 | 725,897 |
| SSPs 245 in the 2050s | 1,319,352 | 218,303 | 335,737 | 256,820 | 810,860 |
| Rate of change (%) | -3.98 | 0.60 | 1.47 | 1.90 | 3.98 |
| SSPs 585 in the 2050s | 1,269,874 | 250,363 | 332,612 | 277,363 | 860,338 |
| Rate of change (%) | -6.31 | 2.11 | 1.33 | 2.86 | 6.31 |
| SSPs 245 in the 2070s | 1,311,040 | 232,259 | 324,597 | 262,316 | 819,172 |
| Rate of change (%) | -4.37 | 1.26 | 0.95 | 2.15 | 4.37 |
| SSPs 585 in the 2070s | 1,251,753 | 241,514 | 344,614 | 292,331 | 878,459 |
| Rate of change (%) | -7.16 | 1.69 | 1.89 | 3.56 | 7.16 |
Note: SSPs, Shared Socioeconomic Pathways. |
| [1] |
|
| [2] |
|
| [3] |
|
| [4] |
|
| [5] |
|
| [6] |
|
| [7] |
|
| [8] |
|
| [9] |
|
| [10] |
|
| [11] |
|
| [12] |
|
| [13] |
|
| [14] |
|
| [15] |
|
| [16] |
|
| [17] |
|
| [18] |
|
| [19] |
|
| [20] |
|
| [21] |
|
| [22] |
|
| [23] |
|
| [24] |
|
| [25] |
|
| [26] |
|
| [27] |
|
| [28] |
|
| [29] |
|
| [30] |
|
| [31] |
|
| [32] |
|
| [33] |
|
| [34] |
|
| [35] |
|
| [36] |
|
| [37] |
|
| [38] |
|
| [39] |
|
| [40] |
|
| [41] |
|
| [42] |
|
| [43] |
|
| [44] |
|
| [45] |
|
| [46] |
|
| [47] |
|
| [48] |
|
| [49] |
|
| [50] |
|
| [51] |
|
| [52] |
|
| [53] |
|
| [54] |
|
/
| 〈 |
|
〉 |