• DU Lan 1, 2, 3 ,
  • TIAN Shengchuan 1, 2, 3 ,
  • ZHAO Nan 1, 2, 3 ,
  • ZHANG Bin 1, 2, 3 ,
  • MU Xiaohan 1, 2, 3 ,
  • TANG Lisong 1, 3 ,
  • ZHENG Xinjun , 1, 3, * ,
  • LI Yan 4
展开

收稿日期: 2024-01-31

  修回日期: 2024-05-28

  录用日期: 2024-05-30

  网络出版日期: 2025-08-14

Climate and topography regulate the spatial pattern of soil salinization and its effects on shrub community structure in Northwest China

  • DU Lan 1, 2, 3 ,
  • TIAN Shengchuan 1, 2, 3 ,
  • ZHAO Nan 1, 2, 3 ,
  • ZHANG Bin 1, 2, 3 ,
  • MU Xiaohan 1, 2, 3 ,
  • TANG Lisong 1, 3 ,
  • ZHENG Xinjun , 1, 3, * ,
  • LI Yan 4
Expand
  • 1State Key Laboratory of Desert and Oasis Ecology, Xinjiang Institute of Ecology and Geography, Chinese Academy of Sciences, Urumqi 830011, China
  • 2University of Chinese Academy of Sciences, Beijing 100049, China
  • 3Fukang Station of Desert Ecology, Chinese Academy of Sciences, Fukang 831505, China
  • 4State Key Laboratory of Subtropical Silviculture, Zhejiang A&F University, Hangzhou 311300, China
* ZHENG Xinjun (E-mail: )

Received date: 2024-01-31

  Revised date: 2024-05-28

  Accepted date: 2024-05-30

  Online published: 2025-08-14

本文引用格式

DU Lan , TIAN Shengchuan , ZHAO Nan , ZHANG Bin , MU Xiaohan , TANG Lisong , ZHENG Xinjun , LI Yan . [J]. Journal of Arid Land, 2024 , 16(7) : 925 -942 . DOI: 10.1007/s40333-024-0060-9

Abstract

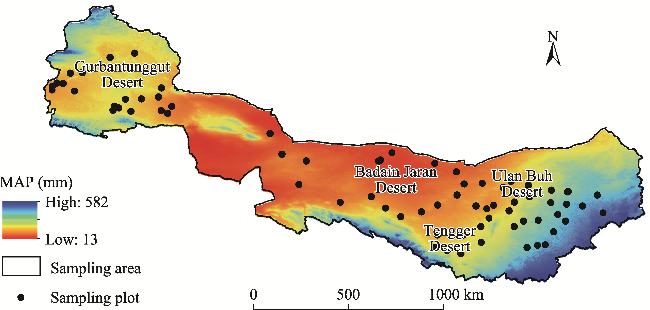
Soil salinization may affect biodiversity and species composition, leading to changes in the plant community structure. However, few studies have explored the spatial pattern of soil salinization and its effects on shrub community structure at the ecosystem scale. Therefore, we conducted a transect sampling of desert shrublands in Northwest China during the growing season (June-September) in 2021. Soil salinization (both the degree and type), shrub community structure (e.g., shrub density and height), and biodiversity parameters (e.g., Simpson diversity, Margalf abundance, Shannon-Wiener diversity, and Pielou evenness indices) were used to assess the effects of soil salinization on shrub community structure. The results showed that the primary degree of soil salinization in the study area was light salinization, with the area proportion of 69.8%. Whereas the main type of soil salinization was characterized as sulfate saline soil, also accounting for 69.8% of the total area. Notably, there was a significant reduction in the degree of soil salinization and a shift in the type of soil salinization from chloride saline soil to sulfate saline soil, with an increase in longitude. Regional mean annual precipitation (MAP), mean annual evapotranspiration (MAE), elevation, and slope significantly contributed to soil salinization and its geochemical differentiation. As soil salinization intensified, shrub community structure displayed increased diversity and evenness, as indicated by the increases in the Simpson diversity, Shannon-Wiener diversity, and Pielou evenness indices. Moreover, the succulent stems and leaves of Chenopodiaceae and Tamaricaceae exhibited clear advantages under these conditions. Furthermore, regional climate and topography, such as MAP, MAE, and elevation, had greater effects on the distribution of shrub plants than soil salinization. These results provide a reference for the origin and pattern of soil salinization in drylands and their effects on the community structure of halophyte shrub species.

1 Introduction

Soil salinization refers to the soil chemical changes caused by natural succession and human activities, and the natural soil salinization is very slow in drylands (Hassani et al., 2021). However, because of the increasing population size and dependence on oasis agriculture, a large number of cultivated land reclamations and unreasonable management have caused prominent secondary salinization problems in drylands (Jolly et al., 2008; Hassani et al., 2021; Singh, 2021). According to incomplete statistics, approximately 8.31×10⁶ km2 of land has been transformed or is being transformed into salinized land worldwide (Prăvălie et al., 2021). Drylands are the ''worst disaster areas'' for soil salinization, and in China, the salinized land in Shanxi Province, Gansu Province, Ningxia Hui Autonomous Region, Qinghai Province, Inner Mongolia Autonomous Region, and Xinjiang Uygur Autonomous Region accounted for 69.03% of the total salinized land in the country (Yang, 2008; Li, 2016). Soil salinization can cause numerous ecological issues, including landscape fragmentation, biodiversity loss, and diminished ecosystem functionality (Schild et al., 2018; Chen et al., 2022a). Consequently, quantifying soil salinization in China's drylands is crucial for providing essential data to support regional ecological security and protect biodiversity.
Most drylands have salinization problems, and the soil salt content of different land use types follows the order of wasteland>forest land>grassland>cultivated land (Zheng et al., 2016). Because of water, fertility, soil thickness, road, and mountainous terrain restrictions, most unreclaimed wastelands in Northwest China have no reclamation value (Kuang et al., 2022). These wastelands mainly have ecological barrier functions, such as wind-breaking, sand-fixing, soil conservation, carbon sequestration, and hydrological regulation, and can act as wild animal and plant germplasm banks (Schild et al., 2018; Chen et al., 2022a). However, owing to the construction of a large number of plain reservoirs and artificial canal networks, the river water originally flowing into the tail-end lake was intercepted into the plain oasis irrigation area, which significantly altered the sedimentation process of salt carried by rivers (Xiao et al., 2007; Wang et al., 2018). Therefore, the wastelands were inevitably affected. It has been 40 a since the Second National Soil Survey was conducted in the 1980s (Shi and Song, 2016). However, the current status of soil salinization in these wastelands remains unknown.
In addition to human activities, geological topography, hydrogeology, bioclimate, and other natural conditions all determine the occurrence and formation of soil salinization, which varies at different spatial scales (Lan, 2023). In general, the surface runoff of weathered minerals, low precipitation, high soil evaporation, and water and salt transport in the soil-groundwater system are the main causes of soil salinization at a macro-scale (Lan, 2023), whereas low-lying depressions and marginal uplift are the main causes of soil salinization at the local scale (Pessarakli, 1991; Zhao et al., 2023). Previous studies mainly focused on the correlation between soil salinization degree and environment but ignored the geochemical differentiation caused by different salt solubilities and the correlation between soil salinization type and environmental factors (Li et al., 2021; Singh, 2021; Zhao et al., 2022b). Therefore, it is necessary to establish correlations among the soil salinization degree, soil salinization type, and regional and microdomain environmental factors.
Soil salinization negatively affects plants by causing osmotic stress and specific ion toxicity, resulting in decreased plant photosynthesis, growth rate, crop yield, and species diversity (Ma et al., 2012; Zhao et al., 2022b). Most plants cannot survive in saline soils, but halophytes can grow and survive in soils with salt content greater than 70 mmol/L (Glenn et al., 1999). At an individual scale, this is because of the evolution of unique salt-resistant (i.e., pseudo-halophytes and euhalophytes) and salt-secreting (e.g., halophytes) characteristics that reduce ionic toxicity (Deinlein et al., 2014; Liang et al., 2018; Xue et al., 2021). The distribution of halophytes at the community and regional scales differs from that of other plants driven by climate, showing an obvious hidden regionality (Xu and Liu, 2004). The degree of soil salinization may directly determine the community structure and species composition of halophytes (Ma et al., 2012; Zhao et al., 2022b). In other words, with an increase in soil salinization degree, the plant community shows noticeable characteristics such as chenopodization (mainly Chenopodiaceae), carnification (mainly succulent stems and leaves), and impoverishment (decreased species diversity) (Xu and Liu, 2004). For example, from desert to grassland ecosystems, the dominant species of a community vary from annual succulent plants, shrubs, and subshrubs to perennial herbs (Xu and Liu, 2004). Therefore, halophyte communities are open ecosystems with frequent exchanges of mass and energy between the external environment and surrounding zonal plants. Understanding the spatial pattern of soil salinization is important to explain the distribution of halophytes.
Shrublands, as crucial ecological barriers within desert-oasis symbiosis systems, play a vital role in maintaining ecosystem functions and services in drylands (Akhtar et al., 2022) and supporting oasis agriculture (Adhikari et al., 2019). For instance, shrublands can provide essential resources such as food, fiber, and energy that are crucial for human survival (Li et al., 2021), and also offer ecological services, including carbon regulation, water retention, and soil erosion control (Schulz et al., 2010; Akhtar et al., 2022). However, despite the adoption of drip irrigation in cotton fields to reduce water consumption, crop water use has not decreased (Zhang et al., 2020). This irrigation method may disrupt horizontal drainage and salt leaching from oases to desert ecosystems (Liu et al., 2010). Furthermore, direct evidence of how soil salinization in shrublands has changed and how these changes affect halophytes is still lacking, impeding our understanding of the current state of desert ecosystems.
In view of the important ecological, economic, and research value of halophytes in shrublands, the aims of this study were: (1) to quantify the spatial distribution of soil salinization and its main environmental factors in Northwest China; and (2) to explore the effects of soil salinization on shrub community structure in Northwest China. This study can provide data for understanding the current state of soil salinization and its potential ecological risks in Northwest China.

2 Materials and methods

2.1 Study area

The study area covers the main desert types in Northwest China (37°26′-46°55′N, 84°58′-111°06′E; Fig. 1), located in the hinterlands of Eurasia. The Tibetan Plateau blocks water vapors from the ocean, and the climate of the study area is temperate continental. The annual precipitation is limited (13-582 mm), and more than 78.9% of the annual precipitation occurs during the growing season. The mean annual temperature ranges from 3.95°C to 9.86°C. The synchronization of water and heat with annual evaporation is greater than 2500 mm. The soil and vegetation in the study area have been described by Liu et al. (2021a).
Fig. 1 Geographical overview of the study area and location of the sampling plots. MAP, mean annual precipitation. Note that the figure is based on the standard map (GS(2023)2767) from the Standard Map Service System (http://bzdt.ch.mnr.gov.cn/index.html) marked by the Ministry of Natural Resources of the People's Republic of China, and the standard map has not been modified.

2.2 Field sampling

Field sampling was conducted during the growing season (June-September) of 2021. Sampling plots were selected near nature reserves or shrublands, far from cities, to reduce the effects of human activities. In total, 78 sampling plots were designed along a longitudinal gradient (Table S1). Four 20 m×20 m quadrats were randomly established in each sampling plot, and the distance between each quadrat was larger than 1 km. A total of 30 shrub species were sampled, and the species richness, abundance, and heights of all shrubs in each quadrat were recorded in the field.
Table S1 Summary of the shrub plant communities in the 72 sampling plots in Northwest China
Plot ID Latitude Longitude Elevation
(m)
Dominant species
A 45°21′20′′N 85°00′17′′E 280 Nitraria tangutorum, Tamarix ramosissima, Anabasis brevifolia, and Haloxylon ammodendron#
B 45°10′30′′N 84°58′58′′E 290 Nitraria tangutorum, Tamarix ramosissima, Reaumuria songarica, and Haloxylon ammodendron#
C 45°29′50′′N 85°30′24′′E 260 Nitraria tangutorum, Tamarix ramosissima, Anabasis brevifolia, Reaumuria songarica, and Haloxylon ammodendron#
D 45°30′20′′N 85°12′27′′E 280 Anabasis brevifolia, Haloxylon ammodendron#, and Kalidium foliatum
E 45°07′22′′N 86°01′41′′E 340 Tamarix ramosissima#, Reaumuria songarica, Nitraria tangutorum, and Haloxylon ammodendron
F 44°09′48′′N 88°42′32′′E 610 Tamarix ramosissima#, Anabasis brevifolia, Reaumuria songarica, Haloxylon ammodendron, Suaeda microphylla, and Kalidium foliatum
G 44°45′42′′N 89°13′05′′E 540 Nitraria tangutorum, Anabasis brevifolia, Ephedra major, Reaumuria songarica, Calligonum mongolicum, and Haloxylon ammodendron#
H 44°51′08′′N 90°01′06′′E 650 Haloxylon ammodendron# and Halostachys caspica
I 44°23′45′′N 90°38′47′′ 830 Anabasis brevifolia, Reaumuria songarica, Haloxylon ammodendron#, and Kalidium foliatum
J 44°04′28′′N 90°26′52′′E 920 Nitraria tangutorum# and Ceratoides latens
K 44°12′01′′N 90°08′37′′E 760 Haloxylon persicum#, Atraphaxis bracteata, Anabasis brevifolia, Calligonum mongolicum, Artemisia ordosica, Haloxylon ammodendron, and Ceratoides latens
L 45°17′14′′N 90°09′54′′E 1200 Anabasis brevifolia, Reaumuria songarica, and Haloxylon ammodendron#
M 46°55′54′′N 88°54′11′′E 830 Anabasis brevifolia and Haloxylon ammodendron#
N 46°43′28′′N 87°43′32′′E 570 Salsola laricifolia, Tamarix ramosissima, Halimodendron halodendron, Reaumuria songarica, Haloxylon ammodendron#, and Ceratoides latens
O 45°58′52′′N 85°50′28′′E 280 Tamarix ramosissima#, Anabasis brevifolia, Reaumuria songarica, and Haloxylon ammodendron
P 46°00′43′′N 86°24′44′′E 320 Tamarix ramosissima, Nitraria roborowskii, Nitraria sibirica, Haloxylon ammodendron#, and Kalidium foliatum
Q 41°49′04′′N 97°02′10′′E 1740 Nitraria tangutorum, Reaumuria songarica, Haloxylon ammodendron#, and Halostachys caspica
R 42°12′21′′N 101°05′60′′E 920 Tamarix ramosissima#
S 41°52′03′′N 100°32′52′′E 970 Nitraria tangutorum, Tamarix ramosissima#, and Lycium ruthenicum
T 41°48′56′′N 100°28′05′′E 980 Nitraria tangutorum, Tamarix ramosissima#, Reaumuria songarica, and Calligonum mongolicum
U 41°41′49′′N 103°07′57′′E 1010 Reaumuria songarica#
V 41°17′58′′N 104°08′37′′E 800 Nitraria tangutorum, Tamarix ramosissima#, Haloxylon ammodendron, and Kalidium foliatum
W 40°43′59′′N 104°30′36′′E 1320 Nitraria tangutorum# and Reaumuria songarica
X 40°51′29′′N 106°44′31′′E 1040 Haloxylon ammodendron#
Y 40°33′55′′N 106°22′33′′E 1040 Nitraria tangutorum, Tamarix ramosissima, and Haloxylon ammodendron#
Z 40°34′24′′N 106°22′00′′E 1050 Nitraria tangutorum, Sarcozygium xanthoxylum#, and Ammopiptanthus mongolicus
A1 40°45′41′′N 105°22′37′′E 1180 Nitraria tangutorum, Potaninia mongolica, Reaumuria songarica, and Kalidium foliatum#
B1 40°39′50′′N 107°33′49′′E 1040 Artemisia ordosica and Salix cheilophila#
C1 40°25′48′′N 108°39′24′′E 1120 Artemisia ordosica and Salix cheilophila#
D1 40°21′48′′N 109°25′23′′E 1080 Hedysarum scoparium#, Caragana sinica, and Artemisia ordosica
E1 40°22′20′′N 109°26′35′′E 1070 Caragana sinica, Artemisia ordosica, and Salix cheilophila#
F1 40°12′20′′N 110°50′23′′E 1040 Caragana sinica, Artemisia ordosica, and Salix cheilophila#
Plot ID Latitude Longitude Elevation
(m)
Dominant species
G1 39°21′48′′N 111°06′56′′E 890 Caragana sinica# and Artemisia ordosica
H1 39°42′59′′N 105°54′31′′E 1170 Caragana sinica# and Artemisia ordosica
I1 39°41′21′′N 110°08′16′′E 1490 Caragana sinica, Hippophae rhamnoides#, and Kalidium foliatum
J1 39°46′17′′N 109°22′26′′E 1370 Caragana sinica, Artemisia ordosica, and Salix cheilophila#
K1 39°50′28′′N 108°37′35′′E 1370 Atraphaxis bracteata, Hedysarum scoparium#, Caragana sinica, and Artemisia ordosica
L1 40°07′37′′N 107°36′50′′E 1200 Caragana sinica# and Ceratoides latens
M1 40°15′23′′N 107°04′14′′E 1140 Nitraria tangutorum, Sarcozygium xanthoxylum, Caragana sinica#, Ammopiptanthus mongolicus, Artemisia ordosica, Tetraena mongolica, Reaumuria songarica, Sabina vulgaris, and Reaumuria songarica
N1 39°52′26′′N 106°52′57′′E 1230 Sarcozygium xanthoxylum, Ammopiptanthus mongolicus, Artemisia ordosica, Tetraena mongolica, Potaninia mongolica, and Sabina vulgaris#
O1 38°58′56′′N 107°19′33′′E 1180 Nitraria tangutorum, Reaumuria songarica, Ammopiptanthus mongolicus#, Kalidium foliatum, Reaumuria songarica, and Kochia prostrata
P1 38°42′47′′N 106°53′08′′E 1240 Artemisia ordosica#
Q1 37°43′37′′N 107°29′50′′E 1330 Caragana sinica#
R1 37°49′04′′N 108°00′03′′E 1360 Hedysarum scoparium, Caragana sinica, Artemisia ordosica, Salix cheilophila#, and Amorpha fruticosa
S1 37°51′12′′N 108°22′25′′E 1310 Caragana sinica, Artemisia ordosica, and Salix cheilophila#
T1 38°28′02′′N 108°46′14′′E 1360 Caragana sinica# and Artemisia ordosica
U1 38°58′13′′N 109°19′11′′E 1310 Sabina vulgaris#, Caragana sinica, Artemisia ordosica, and Salix cheilophila
V1 39°16′32′′N 108°57′02′′E 1310 Hedysarum scoparium, Caragana sinica, Artemisia ordosica, Hippophae rhamnoides, and Salix cheilophila#
W1 39°01′04′′N 108°01′33′′E 1370 Artemisia ordosica#
X1 39°27′27′′N 106°38′37′′E 1230 Nitraria tangutorum, Sarcozygium xanthoxylum, Caragana sinica#, Potaninia mongolica, Reaumuria songarica, Ammopiptanthus mongolicus, Tetraena mongolica, and Ceratoides latens
Y1 39°06′27′′N 105°42′06′′E 1660 Hedysarum scoparium#, Calligonum mongolicum, and Artemisia ordosica
Z1 37°58′35′′N 105°20′22′′E 1330 Nitraria tangutorum# and Reaumuria songarica
A2 37°26′19′′N 104°22′04′′E 1640 Nitraria tangutorum, Reaumuria songarica#, and Salsola passerina
B2 37°34′29′′N 103°42′45′′E 1750 Nitraria tangutorum#, Caragana sinica, and Artemisia ordosica
C2 37°43′47′′N 103°08′52′′E 1660 Hedysarum scoparium# and Artemisia ordosica
D2 38°18′43′′N 103°15′36′′E 1470 Nitraria tangutorum# and Reaumuria songarica
E2 38°16′43′′N 103°55′36′′E 1400 Nitraria tangutorum#
F2 38°18′06′′N 104°28′40′′E 1360 Nitraria tangutorum# and Kalidium foliatum
G2 38°43′12′′N 105°18′17′′E 1280 Hedysarum scoparium# and Artemisia ordosica
H2 39°33′03′′N 105°35′52′′E 1050 Nitraria tangutorum#, Ammopiptanthus mongolicus, Calligonum mongolicum, and Artemisia ordosica
I2 39°41′07′′N 105°04′52′′E 1320 Nitraria tangutorum, Reaumuria songarica, Kalidium foliatum, Salsola laricifolia#, and Salsola passerina
J2 40°12′54′′N 104°10′50′′E 1440 Nitraria tangutorum# and Reaumuria songarica
K2 39°44′01′′N 103°15′37′′E 1280 Nitraria tangutorum and Artemisia ordosica#
L2 39°24′56′′N 102°28′47′′E 1340 Nitraria tangutorum, Sarcozygium xanthoxylum#, and Artemisia ordosica
M2 39°11′39′′N 101°30′39′′E 1420 Nitraria tangutorum, Reaumuria songarica, Kalidium foliatum#, and Salsola passerina
N2 39°35′19′′N 100°47′49′′E 1510 Nitraria tangutorum, Reaumuria songarica, Kalidium foliatum#, and Salsola passerina
Plot ID Latitude Longitude Elevation
(m)
Dominant species
O2 40°08′19′′N 100°06′41′′E 1240 Nitraria tangutorum#, Reaumuria songarica, and Calligonum mongolicum
P2 39°51'54''N 98°38'58''E 1400 Nitraria tangutorum, Reaumuria songarica#, and Calligonum mongolicum
Q2 40°43′05′′N 96°40′42′′E 1510 Reaumuria songarica#
R2 42°08′43′′N 95°52′39′′E 1820 Reaumuria songarica and Haloxylon ammodendron#
S2 43°7′13′′N 95°18′16′′E 1130 Ephedra major#
T2 44°12′53′′N 87°51′39′′E 490 Sarcozygium xanthoxylum, Tamarix ramosissima#, Reaumuria songarica, and Kalidium foliatum
U2 44°20′42′′N 88°08′06′′E 480 Tamarix ramosissima#, Anabasis brevifolia, Reaumuria songarica, and Haloxylon ammodendron
V2 44°43′60′′N 88°27′00′′E 4665 Nitraria roborowskii, Tamarix ramosissima#, Reaumuria songarica, Kalidium foliatum, Halimodendron halodendron, and Nitraria sibirica
W2 44°23′52′′N 87°55′34′′E 451 Haloxylon persicum, Tamarix ramosissima, and Haloxylon ammodendron#
X2 44°22′45′′N 87°56′38′′E 470 Tamarix ramosissima#, Reaumuria songarica, and Haloxylon ammodendron
Y2 44°24′56′′N 87°54′58′′E 454 Haloxylon persicum#, Reaumuria songarica, and Haloxylon ammodendron
Z2 44°22′22′′N 87°56′15′′E 460 Haloxylon persicum and Haloxylon ammodendron#

Note: #, constructive species in each sampling plot. The plot ID numbers are the same in Table S2.

We collected three soil samples (0-20 cm) from each sampling plot and mixed them to represent the soil condition in each sampling plot. Plant litter and gravels were removed from the soil surface during sampling. The soil samples were transported to the laboratory for further analysis.

2.3 Classification of soil salinization

Soil salinization degrees were classified as non-salinized soil, slightly salinized soil, moderately salinized soil, and severely salinized soil, following the American Soil Salinity Classification System (McGeorge, 1954; Liang et al., 2022). Soil salinization types were divided into sulfate saline soil, chloride-sulfate saline soil, sulfate-chloride saline soil, and chloride saline soil (Wei et al., 2016). Table 1 presents a detailed classification of soil salinization.
Table 1 Classification of soil salinization
Classification system Soil type Criteria
Classification system based on American Soil Salinity Classification System# Non-salinized soil TS≤5 mg/kg
Slightly salinized soil 5 mg/kg<TS≤10 mg/kg
Moderately salinized soil 10 mg/kg<TS≤15 mg/kg
Severely salinized soil 15 mg/kg<TS≤20 mg/kg
Classification system based on anion of salt types## Sulfate saline soil Cl-/SO42-≤0.2
Chloride-sulfate saline soil 0.2<Cl-/SO42-≤1.0
Sulfate-chloride saline 1.0<Cl-/SO42-≤4.0
Chloride saline soil Cl-/SO42->4.0

Note: TS, soil total salt. #, the classification was referenced from McGeorge (1954) and Liang et al. (2022); ##, the classification was referenced from Wei et al. (2016).

2.4 Quantification of the shrub community structure

The canopy of shrub species was calculated using the following formula: canopy=(a+b)/2, where a and b are the lengths of the long and short axes of the crown (cm), respectively. The aboveground biomass (g C/(m2•a)) of the shrub species was calculated using the empirical equations of Yang et al. (2017).
The Simpson diversity, Margalf abundance, Shannon-Wiener diversity, and Pielou evenness indices were used to characterize biodiversity in this study. The importance value (IV) was used to measure the relative importance of each shrub species in the quadrat. The calculation formulas are as follows:
$D=1-\sum\limits_{i=1}^{S}{P_{i}^{2}},$
$Ma=\frac{S-1}{\ln N},$
$H\prime =-\sum\limits_{i=1}^{S}{{{P}_{i}}\ln {{P}_{i}}},$
$J=(-\sum\limits_{i=1}^{S}{{{P}_{i}}\ln {{P}_{i}})/\ln S},$
$IV=(\text{RD}+\text{RF}+\text{RA})/3,$
where D is the Simpson diversity index; Ma is the Margalf abundance index; H' is the Shannon-Wiener diversity index; J is the Pielou evenness index; S is the number of species in the quadrat; Pi is the proportion of shrub species i to the total number of plants in the quadrat (Pi=Ni/N, where Ni is the total number of species i in the quadrat, and N is the total number of plants in the quadrat); and RD, RF, and RA are the relative density, relative frequency, and relative abundance of each species in the quadrat, respectively.

2.5 Laboratry analysis and environmental data sources

The soil samples were filtered through a 2-mm sieve in the laboratory after air-drying. The water-soluble ions in the soil, including Na+, K+, Ca2+, Mg2+, Cl-, SO42-, HCO3-, and CO32-, were determined by referring to the Soil and Agricultural Chemistry Analysis (Bao, 2000). The soil pH was measured using a desktop portable conductivity meter with soil:water ratio of 1:5 (DDSJ-308A, Shanghai Wanning Precision Scientific Instrument Co., Ltd., Shanghai, China). The sum of the eight water-soluble ions (Na+, K+, Ca2+, Mg2+, Cl-, SO42-, HCO3-, and CO32-) represented soil total salt (TS), and the sum of the soil base cations (Na+, K+, Ca2+, and Mg2+) represented the exchangeable base cation (EBC). Raster data, including mean annual precipitation (MAP; 1990-2021), mean annual evapotranspiration (MAE; 1990-2021), and elevation data with a spatial resolution of 1 km, were obtained from the WorldClim2 (https://worldclim.org/) (Fick and Hijmans, 2017). The classification of soil types was obtained from a 1:400,000 soil map of China (Zhou, 2002).

2.6 Statistical analysis

TWINSPAN analysis was used to classify the halophyte communities in the sampling plots (Oksanen and Hill, 2023). The maximum partition level during the classification process was set to four, and the maximum number of categories for each partition was set to two (Liu et al., 2021b). Detrended correspondence analysis (DCA) showed that the length of the first axis was larger than 4.0. Therefore, canonical correspondence analysis (CCA) was used to explore the relationship between the species IV matrix and soil salinization variables along the environmental gradient. CCA was performed using the vegan package in R v.4.3.2 (Dixon, 2003). All data analyses were performed using R v.4.3.2 (R Core Team, 2023).

3 Results

3.1 Spatial pattern of soil salinization

Figure 2 shows that the area proportions of soil salinization degrees were 3.2%, 69.8%, 15.9%, and 11.1% for non-salinized soil, slightly salinized soil, moderately salinized soil, and severely salinized soil, respectively. Specifically, the northern regions of the study area were dominated by light soil salinization, whereas the western regions were characterized by moderate and severe soil salinization. The soil salinization type gradually changed from chloride saline soil to sulfate saline soil from northwest to southeast of the study area, and the area proportions of chloride saline soil, chloride-sulfate saline soil, sulfate-chloride saline soil, and sulfate saline soil were 6.3%, 14.3%, 9.5%, and 69.8%, respectively. Both soil salinization degree (P=0.030) and type (P=0.005) were significantly influenced by the longitudinal environment. Similarly, the regional MAP and elevation increased with increasing longitude.
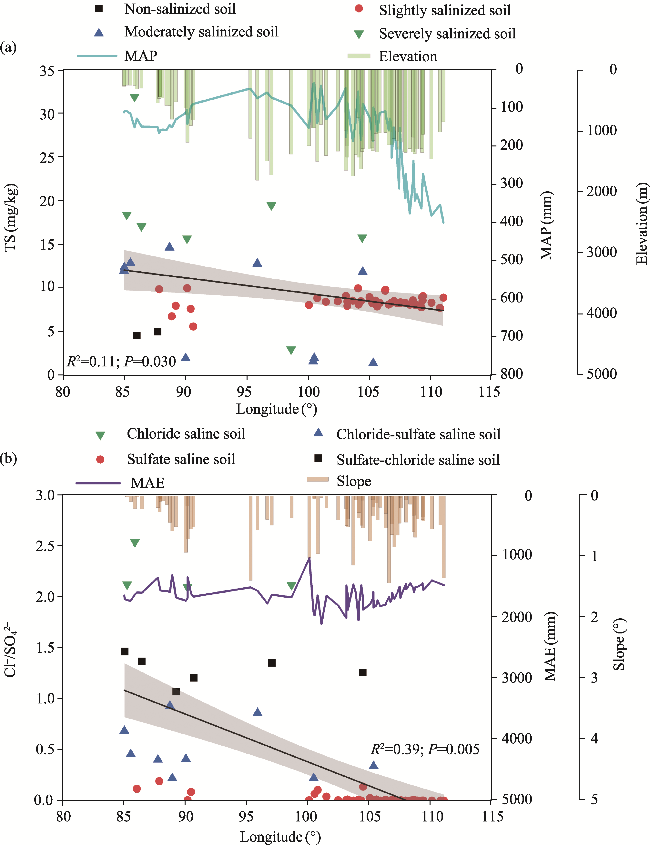
Fig. 2 Variations of soil salinization degree, MAP, and elevation (a) and soil salinization type, mean annual evapotranspiration (MAE), and slope (b) along the longitudinal gradient. Note that soil salinization degree and type are expressed as soil total salt (TS) and Cl-/SO42-, respectively. Black solid line indicates significant relationship between soil salinization and longitude (P<0.050). Shaded area represents 95% confidence interval. R2 and P values represent the linear relationship between soil salinization and longitude.

3.2 Environmental factors affecting soil salinization

Soil salinization is regulated by multiple environmental factors at a regional scale (Fig. 3). Specifically, the degree of soil salinization increased with decreasing elevation, slope, and MAP (P<0.050), but increased with increasing MAE (P<0.050). Soil salinization type changed from sulfate saline soil to chloride saline soil with decreasing elevation (P<0.050); however, the influences of slope, MAP, and MAE were not significant (P>0.050).
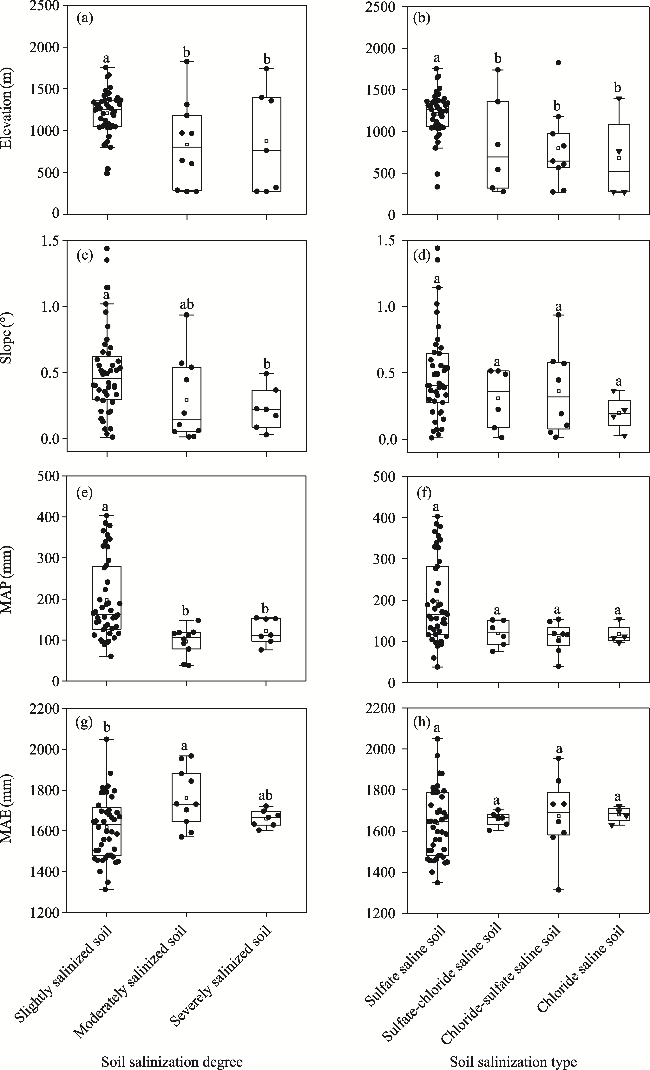
Fig. 3 Effects of topographical (a, b, c, and d) and climatic (e, f, g, and h) factors on soil salinization degree and type. Different lowercase letters indicate significant differences at the P<0.050 level. Since there were few sampling plots with non-salinized soil (n=2, where n is the total number of sampling plots), they were not plotted in this figure. Black dots indicate the data points of elevation, slope, MAP, and MAE. Box boundaries indicate the 25th and 75th percentiles, and whiskers below and above the box indicate the 10th and 90th percentiles, respectively. The black horizontal line within each box indicates the median of data points.

3.3 Effects of soil salinization on shrub community structure

TWINSPAN analysis classified all shrub plant communities into eight associations varying with longitude; that is, association I (Haloxylon ammodendron+Haloxylon persicum+Ceratoides latens) gradually transitioned to association VIII (Tetraena mongolica+Suaeda microphylla) with increasing longitude (Figs. 4 and S1; Table S2). Therefore, following the longitudinal gradient, shrub community structure and biodiversity were analyzed. However, with increasing longitude and/or soil salinization degree at the regional scale, the parameters (e.g., shrub density and Simpson diversity index) of shrub community structure showed no clear trends (P>0.050), but the aboveground biomass increased (P<0.050; Fig. S2).
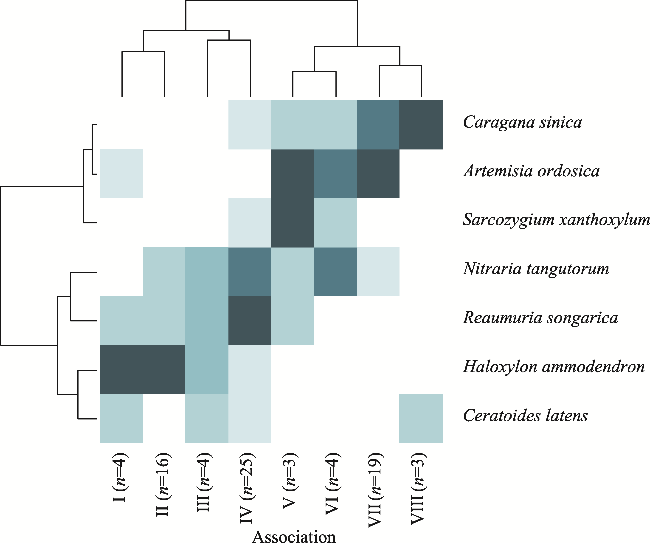
Fig. 4 TWINSPAN tree classification of the 78 sampling plots. The heat map shows data on the abundance of the dominant species in the corresponding quadrats below the cluster tree. The clustering results of the quadrats (four-layer classification) are at the top of the figure, and the clustering results of shrub species are on the left of the figure. n is the total number of sampling plots. The dominant species and sampling plots in each association are shown in Table S2.
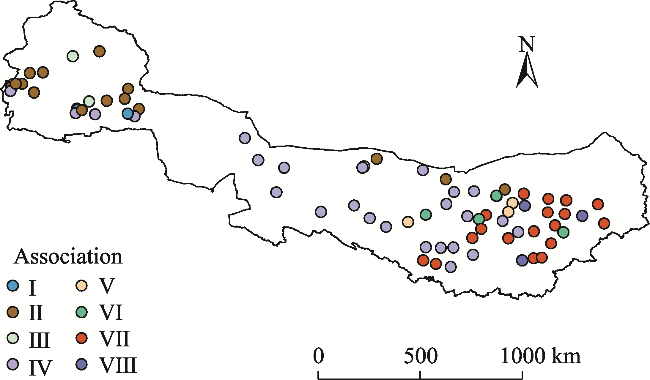
Fig. S1 Geographical distribution of shrub associations along the longitudinal gradient in Northwest China
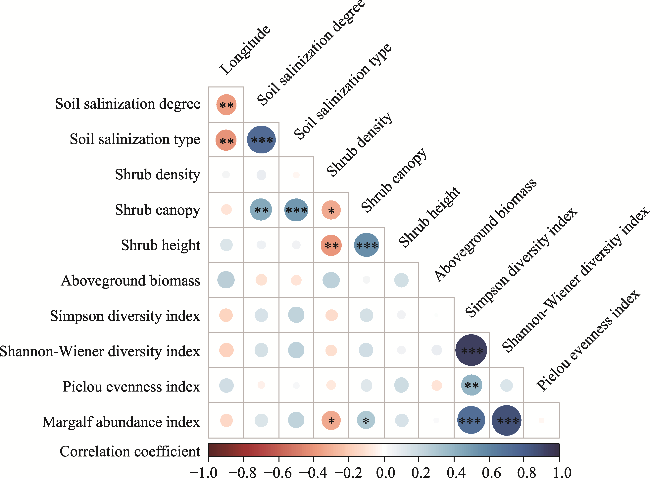
Fig. S2 Pearson's correlations among longitude, soil salinization, and parameters of shrub community structure. The size of the colored circle indicates the degree of correlation. *, P<0.050 level; **, P<0.010 level; ***, P<0.001 level.
Table S2 Dominant species and sampling plots in each association
Association Cluster name Sampling plots
I Haloxylon ammodendron+Haloxylon persicum+Ceratoides latens K, W2, Y2, and Z2
II Haloxylon ammodendron+Anabasis brevifolia+Tamarix ramosissima A, C, D, E, G, H, I, L, M, O, P, R, U2, V, X, and X2
III Nitraria tangutorum+Reaumuria songarica+ Tamarix ramosissima N, S, V2, and Y
IV Reaumuria songarica+Nitraria tangutorum+Salsola passerina A1, A2, B, D2, E2, F, F2, I2, J, J2, M2, N2, O1, O2, P2, Q, Q2, R2, S2, T, T2, U, W, X1, and Z1
V Reaumuria songarica+Nitraria tangutorum+Kalidium foliatum L2, M1, and N1
VI Calligonum mongolicum+Reaumuria songarica+Halostachys caspica H2, K2, U1, and Z
VII Reaumuria songarica+Tetraena mongolica+
Salix cheilophila
B1, B2, C1, C2, D1, E1, F1, G1, G2, H1, J1, K1, P1, R1, S1, T1, V1, W1, and Y1
VIII Tetraena mongolica+Suaeda microphylla I1, L1, and Q1
At the association level, shrub density initially increased, then decreased, and peaked in association IV (Reaumuria songarica+Nitraria tangutorum+Salsola passerina) (Fig. 5a). In contrast, shrub height initially decreased and then increased, and the minimum value was obtained in association IV (Fig. 5b). Aboveground biomass peaked in association VIII (Fig. 5c), but shrub canopy showed no significant trend along the longitude (Fig. 5d). Similarly, the Simpson diversity, Shannon-Wiener diversity, and Pielou evenness indices all showed decreasing trends from association I to association VIII at the association scale, but the Margalf abundance index showed no clear trend along the longitude (Fig. 6).
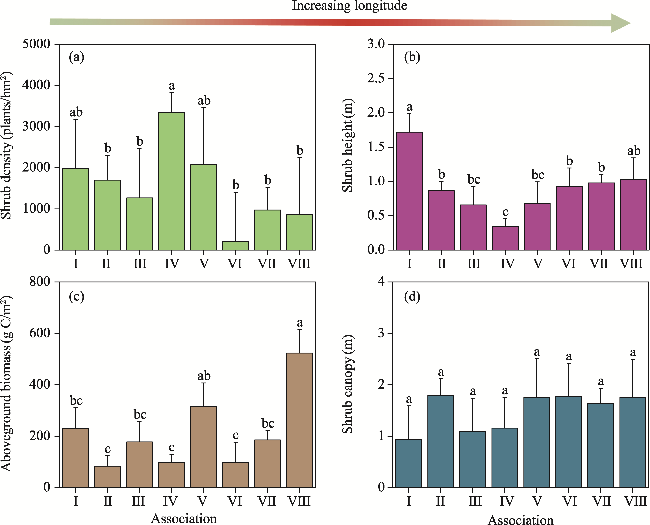
Fig. 5 Comparison of shrub density (a), shrub height (b), aboveground biomass (c), and shrub canopy (d) among the eight shrub associations. Different lowercase letters indicate significant differences among different associations at the P<0.050 level. Bars mean standard errors.
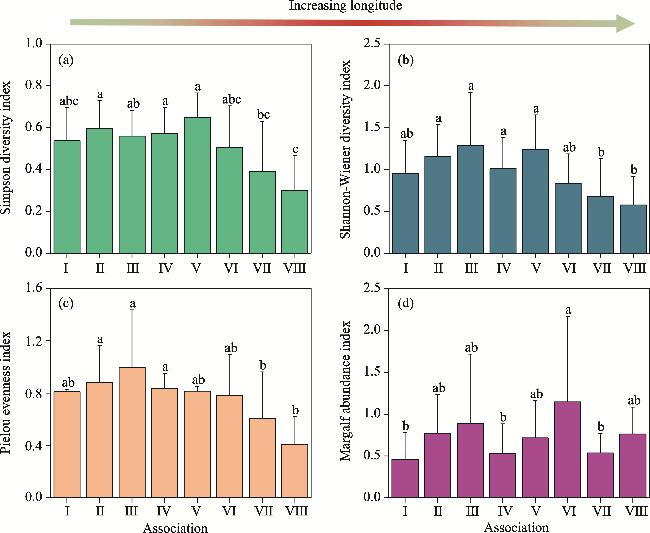
Fig. 6 Comparison of the Simpson diversity (a), Shannon-Wiener diversity (b), Pielou evenness (c), and Margalf abundance (d) indices among the eight shrub associations. Different lowercase letters indicate significant differences among different associations at the P<0.050 level. Bars mean standard errors.
When the cumulative contribution of the top three axes in CCA reaches 40.00%, the ranking effect is considered acceptable. In this study, the cumulative contribution of the first two axes reached 41.29%, indicating that CCA results were reliable (Fig. 7a). CCA results showed that soil salinization significantly affected the distribution of halophytic shrub associations (Fig. 7a). Associations I, II (Haloxylon ammodendron+Anabasis brevifolia+Tamarix ramosissima), and III (Nitraria tangutorum+Reaumuria songarica+Tamarix ramosissima) were generally adapted to the positive side of the first axis of CCA (CCA1), with high soil salinization and MAE, but low MAP and elevation. Association IV was located near the zero of CCA1, corresponding to a certain tolerance of both soil salinization and alkalization. Associations V (Reaumuria songarica+Nitraria tangutorum+Kalidium foliatum), VI (Calligonum mongolicum+Reaumuria songarica+Halostachys caspica), VII (Reaumuria songarica+Tetraena mongolica+Salix cheilophila), and VIII corresponded to the negative side of CCA1, exhibiting saline-alkali soil, and high MAP and elevation. The ranking of environmental factors showed that all these factors other than pH significantly affected the shrub community composition (P<0.050; Fig. 7b). Their R2 values were in descending order of longitude > MAP > elevation > SO42- > MAE > K+ > Mg2+ > Ca2+ > Cl- > Na+ > EBC > HCO3- > slope > TS > pH.
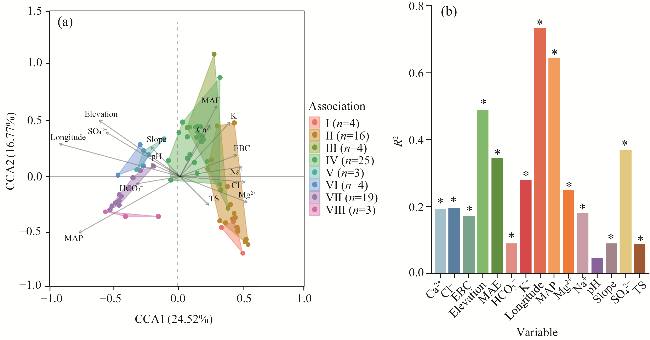
Fig. 7 Canonical correlation analysis (CCA) of the eight shrub associations (a) and their affecting variables of soil salinization, climate, and topography (b). In the left panel, different colors and areas correspond to the distribution ranges of shrub associations. CCA1 and CCA2 are the first and second axes of CCA, respectively. EBC, exchangeable base cation.

4 Discussion

4.1 Spatial pattern of soil salinization and its influencing factors

Soil salinization at the regional scale is affected by numerous factors and exhibits strong nonlinear characteristics (Tian et al., 2019). Despite this complexity, common patterns emerge globally during salinization, including shallow groundwater levels and high solute content in the affected areas (Masoud et al., 2018; Corwin, 2021; Pauloo et al., 2021). Findings about salinization at different spatial scales can vary because of the spatial variability inherent in soil salinization (Liu et al., 2018). We observed a clear longitudinal gradient in soil salinization across Northwest China in this study (Fig. 2). This gradient is shaped by a combination of climatic conditions (Tomaz et al., 2020), groundwater dynamics (Mora et al., 2017), topographical variations (Moeslund et al., 2011), vegetation coverage (Sidike et al., 2014), and human activities (Seydehmet et al., 2018), all of which corroborate our findings (Fig. 2).
In general, surface and underground runoff caused by regional geographical characteristics (e.g., inland river basins and coastal lowlands) and the upward migration of salt with capillary water during soil water evaporation caused by local geographical elements (e.g., depressions), are the main causes of soil salinization (Lu et al., 2023; Zhao et al., 2023). Soil salinization exhibits obvious geochemical divergence in different regions because of different salt solubilities; such as from the piedmont and alluvial plains to the coastal plain, the soil salinization type changes from bicarbonate and sulfate saline soil to chloride saline soil (Yang et al., 2010; Zhu and He, 2019). These results are confirmed in the present study (Fig. 3). Therefore, elevation is important for determining the degree and type of soil salinization at a regional scale (Yan et al., 2014; Zhou and Zhao, 2015; Ding et al., 2016). As shown in Figure 3, slope, MAP, and MAE also played important roles in explaining the degree of soil salinization. This study further confirmed previous findings that both topographical and climatic variables may cause soil salinization (Cao et al., 2006; Zhu et al., 2018; Liu et al., 2022). However, our results showed that soil salinization type was not affected by slope, MAP, or MAE at the regional scale. This is because salt precipitation is a process in which salts converge with surface and subsurface runoff in the lowlands. In contrast, slope and climate are not the main factors influencing this process in terms of scale and dimensions, respectively. Our results provide a reference for evaluating the spatial pattern of soil salinization in arid areas.

4.2 Effects of soil salinization, climate, and topography on shrub community structure

Halophytes grow and reproduce in salinized soil and have developed unique saline-alkali tolerance strategies, manifesting in functional dimensions, such as morphology, physiology, and biochemistry (Xue et al., 2021). Therefore, halophytes adjust along the salinity gradient, reallocate resources, and adapt to environmental pressures at both the individual and community levels (Chen et al., 2022b; Zhao et al., 2022a; Wang et al., 2023). For example, with increasing salinization, plants show obvious trends in chenopodization, carnification, densification, and hidden regionality (Xu and Liu, 2004), which is consistent with the results of our study (Figs. 5 and 6). However, our study indicated that salinized soil complicated shrub community structure (Figs. 5 and 6), which might be because the shrub plants are mainly halophytes, and salinized soil is more suitable for their survival. Our results also showed that soil salinization caused the replacement of dominant species at the association scale, which might be attributed to the differences in saline-alkali tolerance ranges among halophytes (Fig. 7a). Overall, the saline-alkali tolerance of Chenopodiaceae was higher than that of Tamaricaceae, whereas the salt tolerances of Leguminosae, Compositae, and Polygonaceae were relatively weak (Table S1; Fig. 7a). This may be because Chenopodiaceae plants are generally euthanized and can accumulate and tolerate Na+ and Cl- in succulent tissues (Zhao et al., 2005; Lv et al., 2012). Our results suggested that the geochemical differentiation of salt transport is important for determining the turnover of halophytes (Fig. 7a). There were salinization and alkalization patterns of the soil in arid areas, and chloride saline soil containing Na+, Cl-, K+, Ca2+, and Mg2+ was more suitable for the survival of Chenopodiaceae and Tamaricaceae plants with stronger salt tolerance. In contrast, sulfate and bicarbonates generally accumulated in the salt-alkali soil but were less salinized, which was more suitable for the survival of Compositae, Leguminosae, and Gramineae plants with lower salt tolerance (Table S1; Fig. 7a).
At the regional scale, environmental factors, such as elevation, precipitation, and evaporation, are important in determining soil salinization and shaping plant distribution (Cao et al., 2006; Zhu et al., 2018; Liu et al., 2022), which is consistent with our results (Fig. 7b). However, considering the heterogeneity of the environment and the scale of the study, the results may differ significantly (Gui et al., 2010; Yao et al., 2018; Bao et al., 2019). Generally, the environmental factors affecting the distribution of plants are climate and terrain (e.g., elevation), at a broader scale, and slope, aspect, and soil factors, at a micro-scale (Van Couwenberghe et al., 2010; Duan et al., 2017). However, considering soil salinization can significantly reduce the zonality of plants, the extent of the influence of soil salinization compared with those of other environmental factors remains controversial (Gui et al., 2010; Yao et al., 2018; Bao et al., 2019). This study showed that environmental factors, such as MAP, elevation, and MAE, had a greater impact on the distribution of halophytes than soil salinization (Fig. 7b). Our results provide a reference for understanding the distribution pattern of halophytes and its environmental drivers.

5 Conclusions

We analyzed the spatial pattern and geographical distribution of soil salinization and its primary drivers in the main desert types in Northwest China. We also assessed the impacts of climate, topography, and soil salinization on shrub community structure through sampling surveys across desert ecosystems in this study. We found that the soil in China's drylands is predominantly slightly salinized, with sulfate saline soil being the most common type. Elevation, slope, MAP, and MAE were key factors in the geochemical differentiation of soil salinization. Soil salinization may lead to species turnover among the dominant halophytes and complicate the community structure of these plants. Notably, with increasing soil salinization, the Chenopodiaceae family gradually became more dominant. In comparison, MAP, elevation, and MAE significantly influenced halophyte species composition. Our findings elucidated the spatial pattern of soil salinization in the drylands of Northwest China and its effects on the community structure of halophyte species. These results underscore the unique adaptability of halophytes to soil salinization in drylands.

Conflict of interest

LI Yan is an Associate Editor of Journal of Arid Land and was not involved in the editorial review or the decision to publish this article. All authors declare that there are no competing interests.

Acknowledgements

This work was financially supported by the National Natural Sciences Foundation of China (42330503, 42171068), the Third Xinjiang Scientific Expedition Program (2022xjkk0901), and the Tianshan Talent Training Program (2023TSYCLJ0048).

Author contributions

Conceptualization: ZHENG Xinjun, LI Yan, TANG Lisong; Methodology: ZHENG Xinjun, DU Lan, TIAN Shengchuan; Investigation: ZHENG Xinjun, DU Lan, TIAN Shengchuan; Formal analysis: ZHAO Nan, ZHANG Bin, MU Xiaohan; Writing - original draft preparation: DU Lan; Writing - review and editing: ZHENG Xinjun, LI Yan; Funding acquisition: LI Yan, TANG Lisong, ZHENG Xinjun. All authors approved the manuscript.
[1]
Adhikari S, Adhikari A, Weaver D K, et al. 2019. Impacts of agricultural management systems on biodiversity and ecosystem services in highly simplified dryland landscapes. Sustainability, 11(11): 3223, doi: 10.3390/su11113223.

[2]
Akhtar M, Zhao Y, Gao G, et al. 2022. Assessment of spatiotemporal variations of ecosystem service values and hotspots in a dryland: A case-study in Pakistan. Land Degradation and Development, 33(9): 1383-1397.

[3]
Bao S D. 2000. Soil Agrochemical Analysis (3rd ed.). Beijing: China Agriculture Press, 25-114. (in Chinese)

[4]
Bao X T, Ding L B, Yao S C, et al. 2019. Quantitative classification and ordination of grassland communities on the Lhasa River Basin. Acta Ecologica Sinica, 39(3): 779-786. (in Chinese)

[5]
Cao C Y, Jiang D M, Zhu L H, et al. 2006. Degradation and diversity changes of meadow grassland in Keerqin Sandy Land. Acta Prataculturae Sinica, 15(3): 18-26. (in Chinese)

[6]
Chen B M, Jing X, Liu S S, et al. 2022a. Intermediate human activities maximize dryland ecosystem services in the long-term land-use change: Evidence from the Sangong River watershed, Northwest China. Journal of Environmental Management, 319: 115708, doi: 10.1016/j.jenvman.2022.115708.

[7]
Chen X, Luo M, Tan J, et al. 2022b. Salt-tolerant plant moderates the effect of salinity on soil organic carbon mineralization in a subtropical tidal wetland. Science of the Total Environment, 837: 155855, doi: 10.1016/j.scitotenv.2022.155855.

[8]
Corwin D L. 2021. Climate change impacts on soil salinity in agricultural areas. European Journal of Soil Science, 72(2): 842-862.

[9]
Deinlein U, Stephan A B, Horie T, et al. 2014. Plant salt-tolerance mechanisms. Trends in Plant Science, 19(6): 371-379.

[10]
Ding J L, Chen W Q, Chen Y. 2016. Soil salinization disaster warning in arid zones: A case study in the Ugan-Kuqa oasis. Journal of Desert Research, 36(4): 1079-1086. (in Chinese)

[11]
Dixon P. 2003. VEGAN, a package of R functions for community ecology. Journal of Vegetation Science, 14(6): 927-930.

[12]
Duan H L, Zhao A, Yao Z. 2017. Overview of ordination methods application in relationship between plant community and environment. Journal of Tropical and Subtropical Botany, 25(2): 202-208. (in Chinese)

[13]
Fick S E, Hijmans R J. 2017. WorldClim 2: new 1-km spatial resolution climate surfaces for global land areas. International Journal of Climatology, 37(12): 4302-4315.

[14]
Glenn E P, Brown J J, Blumwald E. 1999. Salt tolerance and crop potential of halophytes. Critical Reviews in Plant Sciences, 18(2): 227-255.

[15]
Gui D W, Lei J Q, Zeng F J, et al. 2010. Effect of ecological factors on plant communities of the Cele River Basin on the north slope of the middle Kunlun Mountains. Acta Prataculturae Sinica, 19(3): 38-46. (in Chinese)

[16]
Hassani A, Azapagic A, Shokri N. 2021. Global predictions of primary soil salinization under changing climate in the 21st century. Nature Communications, 12(1): 6663, doi: 10.1038/s41467-021-26907-3.

[17]
Jolly I D, McEwan K L, Holland K L. 2008. A review of groundwater-surface water interactions in arid/semi-arid wetlands and the consequences of salinity for wetland ecology. Ecohydrology, 1(1): 43-58.

[18]
Kuang W H, Liu J Y, Tian H Q, et al. 2022. Cropland redistribution to marginal lands undermines environmental sustainability. National Science Review, 9(1): nwab091, doi: 10.1093/nsr/nwab091.

[19]
Lan T. 2023. Geochemical evaluation and cause analysis of soil salinization in the west of Jilin Province. PhD Dissertation. Changchun: Jilin University. (in Chinese)

[20]
Li C J, Fu B J, Wang S, et al. 2021. Drivers and impacts of changes in China's drylands. Nature Reviews Earth and Environment, 2(12): 858-873.

[21]
Li R R. 2016. Spatial pattern of soil salinization in the lower reaches of the plain reservoirs in arid area: A case study of the Liuchengzi reservoir. MSc Thesis. Urumqi: Xinjiang University. (in Chinese)

[22]
Liang M, Mi X J, Li C H, et al. 2022. Salinity characteristics and halophytic vegetation diversity of uncultivated saline-alkali soil in Junggar Basin, Xinjiang. Arid Land Geography, 45(1): 185-196. (in Chinese)

[23]
Liang W J, Ma X L, Wan P, et al. 2018. Plant salt-tolerance mechanism: A review. Biochemical and Biophysical Research Communications, 495(1): 286-291.

[24]
Liu H L, Chu G X, Zhao F M, et al. 2010. Study on the variation and trend analysis of soil secondary salinization of cotton field under long-term drip irrigation condition in northern Xinjiang. Soil and Fertilizer Sciences in China, (4): 12-17. (in Chinese)

[25]
Liu J, Su Y G, Li Y, et al. 2021a. Shrub colonization regulates δ13C enrichment between soil and vegetation in deserts by affecting edaphic variables. Catena, 203: 105365, doi: 10.1016/j.catena.2021.105365.

[26]
Liu J L, Liu L, Ma X Y, et al. 2018. Spatial variability of soil salt in different soil layers at different scales. Journal of Basic Science and Engineering, 26(2): 305-312. (in Chinese)

[27]
Liu X H, Zhang Q Q, Xu H L, et al. 2021b. Spatial distribution and species diversity of saline-alkali plant communities in northern Xinjiang. Acta Ecologica Sinica, 41(4): 1501-1513. (in Chinese)

[28]
Liu Y F, Cui Z, Huang Z, et al. 2022. Shrub encroachment in alpine meadows increases the potential risk of surface soil salinization by redistributing soil water. Catena, 219: 106593, doi: 10.1016/j.catena.2022.106593.

[29]
Lu B J, Tian S C, Zuo Z, et al. 2023. Review and prospect on sustainable utilization of salinized land. Journal of Ningxia University (Natural Science Edition), 44(1): 79-88. (in Chinese)

[30]
Lv S L, Jiang P, Chen X Y, et al. 2012. Multiple compartmentalization of sodium conferred salt tolerance in Salicornia europaea. Plant Physiology and Biochemistry, 51: 47-52.

[31]
Ma M J, Zhou X H, Ma Z, et al. 2012. Composition of the soil seed bank and vegetation changes after wetland drying and soil salinization on the Tibetan Plateau. Ecological Engineering, 44: 18-24.

[32]
Masoud A A, El-Horiny M M, Atwia M G, et al. 2018. Assessment of groundwater and soil quality degradation using multivariate and geostatistical analyses, Dakhla Oasis, Egypt. Journal of African Earth Sciences, 142: 64-81.

[33]
McGeorge W T. 1954. Diagnosis and improvement of saline and alkaline soils. Soil Science Society of America Journal, 18(3): 348-348.

[34]
Moeslund J E, Arge L, Bøcher P K, et al. 2011. Geographically comprehensive assessment of salt-meadow vegetation-elevation relations using LiDAR. Wetlands, 31(3): 471-482.

[35]
Mora J L, Herrero J, Weindorf D C. 2017. Multivariate analysis of soil salination-desalination in a semi-arid irrigated district of Spain. Geoderma, 291: 1-10.

[36]
Oksanen J, Hill M O. 2023. Jarioksa/twinspan: Two-Way Indicator Species Analysis. R package version 0.9-3. [2023-12-02]. https://rdrr.io/github/jarioksa/twinspan/.

[37]
Pauloo R A, Fogg G E, Guo Z, et al. 2021. Anthropogenic basin closure and groundwater salinization (ABCSAL). Journal of Hydrology, 593: 125787, doi: 10.1016/j.jhydrol.2020.125787.

[38]
Pessarakli M. 1991. Formation of saline and sodic soils and their reclamation. Journal of Environmental Science and Health. Part A: Environmental Science and Engineering and Toxicology, 26(7): 1303-1320.

[39]
Prăvălie R, Patriche C, Borrelli P, et al. 2021. Arable lands under the pressure of multiple land degradation processes. A global perspective. Environmental Research, 194: 110697, doi: 10.1016/j.envres.2020.110697.

[40]
R Core Team. 2023. R: A Language and Environment for Statistical Computing. R Foundation for Statistical Computing, Vienna, Austria. [2023-12-02]. https://www.R-project.org/.

[41]
Schild J E M, Vermaat J E, de Groot R S, et al. 2018. A global meta-analysis on the monetary valuation of dryland ecosystem services: The role of socio-economic, environmental and methodological indicators. Ecosystem Services, 32: 78-89.

[42]
Schulz J J, Cayuela L, Echeverria C, et al. 2010. Monitoring land cover change of the dryland forest landscape of Central Chile (1975-2008). Applied Geography, 30(3): 436-447.

[43]
Seydehmet J, Lv G H, Nurmemet I, et al. 2018. Model prediction of secondary soil salinization in the Keriya Oasis, Northwest China. Sustainability, 10(3): 656, doi: 10.3390/su10030656.

[44]
Shi J P, Song G, 2016. Soil type database of China: A nationwide soil dataset based on the second national soil survey. Science Data Bank, 1(2): 86101, doi: 10.11922/csdata.170.2015.0033.

[45]
Sidike A, Zhao S, Wen Y. 2014. Estimating soil salinity in Pingluo County of China using QuickBird data and soil reflectance spectra. International Journal of Applied Earth Observation and Geoinformation, 26: 156-175.

[46]
Singh A. 2021. Soil salinization management for sustainable development: A review. Journal of Environmental Management, 277: 111383, doi: 10.1016/j.jenvman.2020.111383.

[47]
Tian A H, Fu C B, Su X Y, et al. 2019. Classifying and predicting salinization level in arid area soil using a combination of Chua's circuit and fractional order Sprott chaotic system. Sensors, 19(20): 4517, doi: 10.3390/s19204517.

[48]
Tomaz A, Palma P, Fialho S, et al. 2020. Risk assessment of irrigation-related soil salinization and sodification in Mediterranean areas. Water, 12(12): 3569, doi: 10.3390/w12123569.

[49]
Van Couwenberghe R, Collet C, Lacombe E, et al. 2010. Gap partitioning among temperate tree species across a regional soil gradient in windstorm-disturbed forests. Forest Ecology and Management, 260(1): 146-154.

[50]
Wang X S, He J, Ma P, et al. 2023. Responses of the vegetation community structure and carbon storage of temperate meadow steppe to salinization in Huihe Reserve. Acta Agrestia Sinica, 31(4): 1154-1162. (in Chinese)

[51]
Wang Y G, Deng C Y, Liu Y, et al. 2018. Identifying change in spatial accumulation of soil salinity in an inland river watershed, China. Science of the Total Environment, 621: 177-185.

[52]
Wei Y, Ding J L, Wang F, et al. 2016. Analysis of the spatial variational characteristics of saline-alkaline soil types in non-agriculture land in Manas River Basin, Xinjiang, China. Acta Ecologica Sinica, 36(23): 7655-7666. (in Chinese)

[53]
Xiao D N, Li X Y, Song D M, et al. 2007. Temporal and spatial dynamical simulation of groundwater characteristics in Minqin Oasis. Science in China Series D: Earth Sciences, 50(2): 261-273.

[54]
Xu H G, Liu S R. 2004. Effects of soil salinization on halophytic vegetation. Inner Mongolia Prataculture, 16(2): 1-2. (in Chinese)

[55]
Xue Q Q, Zhao L L, Wang Y X, et al. 2021. Research progress on salt tolerance of halophytes. Chinese Wild Plant Resources, 40(5): 60-65. (in Chinese)

[56]
Yan A, Jiang P G, Sheng J D, et al. 2014. Spatial variability of surface soil salinity in Manas River Basin. Acta Pedologica Sinica, 51(2): 410-414. (in Chinese)

[57]
Yang H M, Xu H L, Fan Z L, et al. 2010. Spatial variability and pattern of surface soil salinity in the lower reaches of the Tarim River. Journal of Desert Research, 30(3): 564-570. (in Chinese)

[58]
Yang H T, Wang Z R, Tan H J, et al. 2017. Allometric models for estimating shrub biomass in desert grassland in northern China. Arid Land Research and Management, 31(3): 283-300.

[59]
Yang J S. 2008. Development and prospect of the research on salt-affected soils in China. Acta Pedologica Sinica, 45(5): 837-845. (in Chinese)

[60]
Yao S C, Wang J S, Ding L B, et al. 2018. Quantitative classification and ordination of grassland communities in Lhasa River Valley. Acta Ecologica Sinica, 38(13): 4779-4788. (in Chinese)

[61]
Zhang Z Y, Li X Y, Liu L J, et al. 2020. Influence of mulched drip irrigation on landscape scale evapotranspiration from farmland in an arid area. Agricultural Water Management, 230: 105953, doi: 10.1016/j.agwat.2019.105953.

[62]
Zhao K F, Fan H, Song J, et al. 2005. Two Na+ and Cl- hyperaccumulators of the Chenopodiaceae. Journal of Integrative Plant Biology, 47(3): 311-318.

[63]
Zhao Y T, Wang G D, Zhao M L, et al. 2022a. Direct and indirect effects of soil salinization on soil seed banks in salinizing wetlands in the Songnen Plain, China. Science of the Total Environment, 819: 152035, doi: 10.1016/j.scitotenv.2021.152035.

[64]
Zhao Y T, Wang G D, Zhao M L, et al. 2022b. How soil salinization and alkalinization drive vegetation change in salt-affected inland wetlands. Plant and Soil, 480(1-2): 571-581.

[65]
Zhao Z Z, Chen J S, Peng E R, et al. 2023. Research progress on soil salinization and management. China Rural Water and Hydropower, (6): 202-208. (in Chinese)

[66]
Zheng Q, Wang H J, Li W T, et al. 2016. Factors influencing soil salinization in Manasi River Basin, China. Journal of Agricultural Resources and Environment, 33(3): 214-220. (in Chinese)

[67]
Zhou H Z. 2002. Sharing of soil information data distributed inquiry data base of 1:4M soil information of China. Acta Pedologica Sinica, 39(4): 483-489. (in Chinese)

[68]
Zhou Z M, Zhao S H. 2015. Influencing factors on surface soil salt accumulation in the semi-arid North China Plain. Arid Land Geography, 38(5): 976-984. (in Chinese)

[69]
Zhu H, He Y. 2019. Soil Geography (3rd ed.). Beijing: Higher Education Press, 56-58. (in Chinese)

[70]
Zhu H Q, Li Y H, Li F D. 2018. Characteristics of soil moisture, salinity and nutrients in different plant communities of Ebinur Lake wetland during the past decade. Acta Botanica Boreali-Occidentalia Sinica, 38(3): 535-543. (in Chinese)

文章导航

/