
Glacier area change and its impact on runoff in the Manas River Basin, Northwest China from 2000 to 2020
Received date: 2024-02-28
Revised date: 2024-06-07
Accepted date: 2024-06-11
Online published: 2025-08-14
WANG Tongxia , CHEN Fulong , LONG Aihua , ZHANG Zhengyong , HE Chaofei , LYU Tingbo , LIU Bo , HUANG Yanhao . [J]. Journal of Arid Land, 2024 , 16(7) : 877 -894 . DOI: 10.1007/s40333-024-0080-5
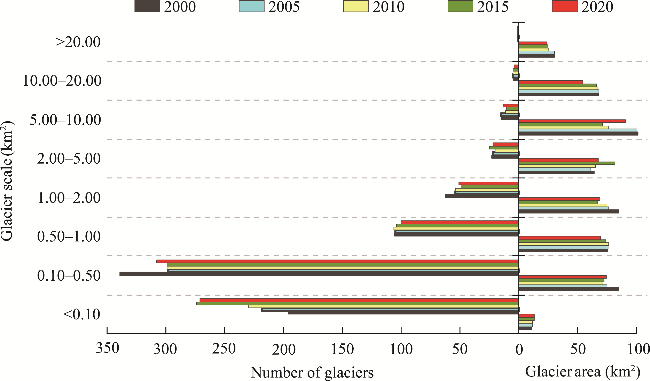
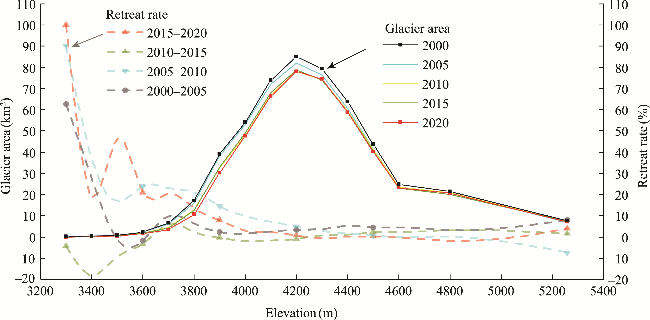
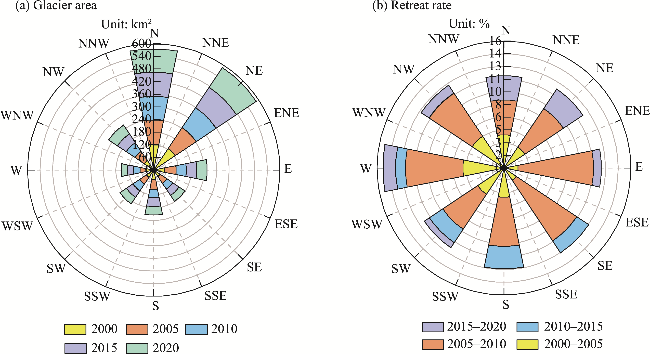
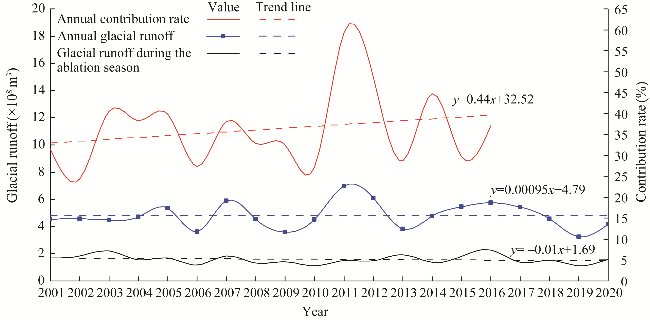
Understanding the distribution and dynamics of glaciers is of great significance to the management and allocation of regional water resources and socio-economic development in arid regions of Northwest China. In this study, based on 36 Landsat images, we extracted the glacier boundaries in the Manas River Basin, Northwest China from 2000 to 2020 using eCognition combined with band operation, GIS (geographic information system) spatial overlay techniques, and manual visual interpretation. We further analyzed the distribution and variation characteristics of glacier area, and simulated glacial runoff using a distributed degree-day model to explore the regulation of runoff recharge. The results showed that glacier area in the Manas River Basin as a whole showed a downward trend over the past 21 a, with a decrease of 10.86% and an average change rate of -0.54%/a. With the increase in glacier scale, the number of smaller glaciers decreased exponentially, and the number and area of larger glaciers were relatively stable. Glacier area showed a normal distribution trend of increasing first and then decreasing with elevation. About 97.92% of glaciers were distributed at 3700-4800 m, and 48.11% of glaciers were observed on the northern and northeastern slopes. The retreat rate of glaciers was the fastest (68.82%) at elevations below 3800 m. There was a clear rise in elevation at the end of glaciers. Glaciers at different slope directions showed a rapid melting trend from the western slope to the southern slope then to the northern slope. Glacial runoff in the basin showed a fluctuating upward trend in the past 21 a, with an increase rate of 0.03×10⁸ m3/a. The average annual glacial runoff was 4.80×10⁸ m3, of which 33.31% was distributed in the ablation season (June-September). The average annual contribution rate of glacial meltwater to river runoff was 35.40%, and glacial runoff accounted for 45.37% of the total runoff during the ablation season. In addition, precipitation and glacial runoff had complementary regulation patterns for river runoff. The findings can provide a scientific basis for water resource management in the Manas River Basin and other similar arid inland river basins.
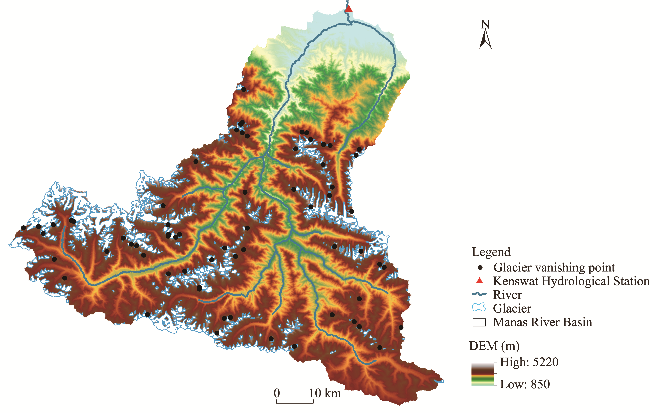
Fig. 1 Overview of the Manas River Basin based on the digital elevation model (DEM) and spatial distribution of glaciers based on the Second Chinese Glacier Inventory and glacier vanishing points determined in this study. The Second Chinese Glacier Inventory data were from the National Cryosphere Desert Data Center (http://www.ncdc.ac.cn/). |
Table 1 Detailed description of data used in the study |
| Data type | Time span | Row/ Column | Spatial resolution | Data source | |
|---|---|---|---|---|---|
| Landsat image data | Landsat 8 OLI | 2013-2020 | 144/030 | 15/30 m | http://www.gscloud.cn/ |
| Landsat 4-5 TM | 2006-2011 | 144/030 | 30 m | ||
| Landsat 7 ETM_SLC_off | 2003-2012 | 144/030 | 15/30 m | ||
| Landsat 7 ETM_SLC_on | 2000-2002 | 144/030 | 15/30 m | ||
| ASTER GDEM | - | 144/030 | 30 m | http://www.gscloud.cn/ | |
| Elevation change dataset | 2000-2020 | - | 100 m | https://doi.org/10.6096/13 | |
| ERA5-Land | 2000-2020 | - | 1 km | https://cds.climate.copernicus.eu/ | |
| Second Chinese Glacier Inventory | 2006-2011 | - | - | http://www.ncdc.ac.cn/ | |
| Observed data from the Kenswat Hydrological Station | 2000-2014 | - | - | - | |
Note: OLI, Operational Land Imager; TM, Thematic Mapper; ETM, Enhanced Thematic Imager; SLC, Scan Lines Corrector; ASTER GDEM, Advanced Spaceborne Thermal Emission and Reflection Radiometer Global Digital Elevation Model; ERA5-Land, European Center for Medium-Range Weather Forecast (ECMWF) Land Surface Reanalysis version 5. "-" means no data. |
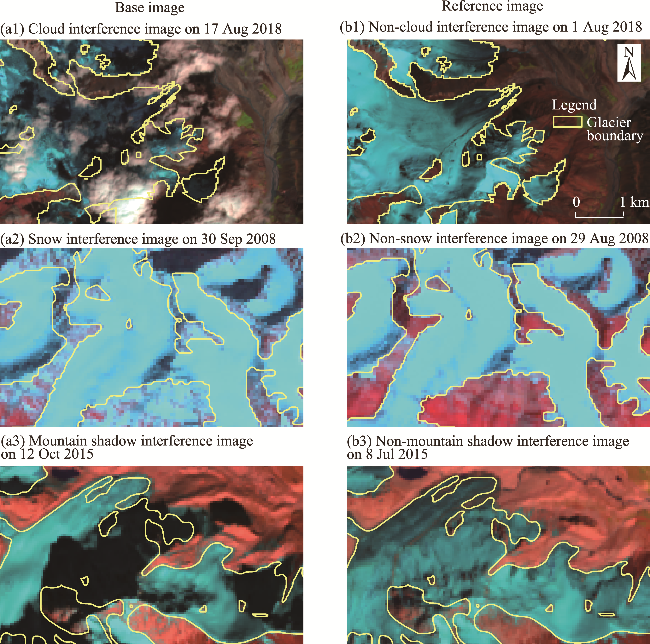
Fig. 2 Extraction of glacier boundaries based on base images with the least cloud cover, temporary snowfall, and mountain shadow interference (a1-a3) and reference images from adjacent years that can compensate for interference from clouds, temporary snowfall, and mountain shadows in the base images (b1-b3) |
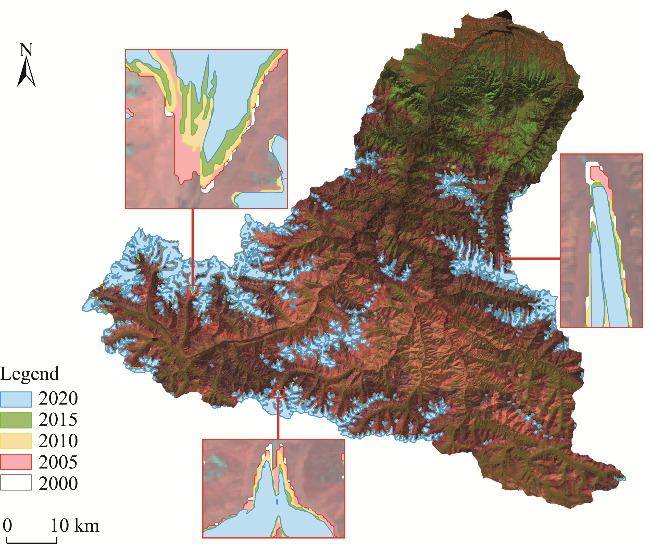
Fig. 3 Spatial distribution of the extracted glaciers in the Manas River Basin and localized comparison of glacier boundaries during 2000-2020 |
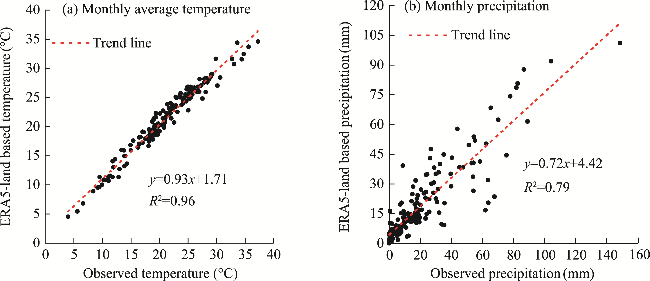
Fig. 4 Accuracy assessment of monthly average temperature (a) and monthly precipitation (b) data from EAR5-land during June-September compared with the station observations |
Table 2 Distribution and variation of glaciers in the Manas River Basin from 2000 to 2020 |
| Year | Glacier area (km2) | Glacier coverage rate (%) | Rate of change in glacier area (%) | Change in glacier volume (×10−3 km3) | Glacier number | Rate of change in glacier number (%) |
|---|---|---|---|---|---|---|
| 2000 | 520.12 | 10.14 | - | - | 747 | - |
| 2005 | 504.59 | 9.83 | -2.99 | -3.42 | 726 | -2.81 |
| 2010 | 472.79 | 9.21 | -6.30 | -12.08 | 727 | 0.14 |
| 2015 | 472.16 | 9.20 | -0.13 | -0.32 | 767 | 5.50 |
| 2020 | 463.61 | 9.03 | -1.81 | -5.22 | 770 | 0.39 |
Note: "-" means no data. |
Fig. 5 Distribution and variation characteristics of glaciers at different scales in the Manas River Basin from 2000 to 2020 |
Fig. 6 Variation characteristics of glacier area with elevation in the Manas River Basin from 2000 to 2020 |
Fig. 7 Variation characteristics of glacier area (a) and retreat rate (b) according to slope directions in the Manas River Basin from 2000 to 2020. N, north; NNE, north-northeast; NE, northeast; ENE, east-northeast; E, east; ESE, east-southeast; SE, southeast; SSE, south-southeast; S, south; SSW, south-southwest; SW, southwest; WSW, west-southwest; W, west; WNW, west-northwest; NW, northwest; NNW, north-northwest. |
Fig. 8 Temporal variations of glacial runoff and its contribution rates to river runoff in the Manas River Basin from 2000 to 2020. Due to limitations in the observed river runoff data, annual contribution rate data were only available up to 2016. |
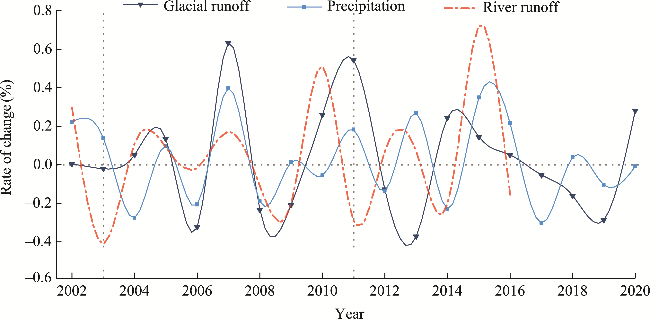
Fig. 9 Relationship between rates of change in glacial runoff, precipitation, and observed river runoff in the Manas River Basin from 2000 to 2020 |
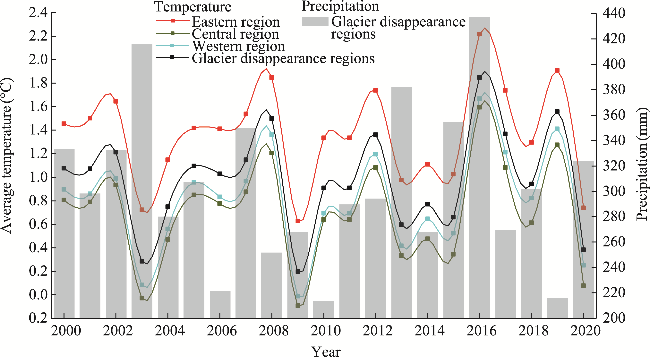
Fig. 10 Temporal variations of summer average temperature and summer precipitation in the glacier disappearance regions of the Manas River Basin from 2000 to 2020. Eastern region, central region, and western region were three subdivisions of glacier disappearance regions. |
| [1] |
|
| [2] |
|
| [3] |
|
| [4] |
|
| [5] |
|
| [6] |
|
| [7] |
|
| [8] |
|
| [9] |
|
| [10] |
|
| [11] |
|
| [12] |
|
| [13] |
|
| [14] |
|
| [15] |
|
| [16] |
|
| [17] |
|
| [18] |
|
| [19] |
|
| [20] |
|
| [21] |
|
| [22] |
|
| [23] |
|
| [24] |
|
| [25] |
|
| [26] |
|
| [27] |
|
| [28] |
|
| [29] |
|
| [30] |
|
| [31] |
|
| [32] |
|
| [33] |
|
| [34] |
|
| [35] |
|
| [36] |
|
| [37] |
|
| [38] |
|
| [39] |
|
| [40] |
|
| [41] |
|
| [42] |
|
| [43] |
|
| [44] |
|
| [45] |
|
| [46] |
|
| [47] |
|
| [48] |
|
| [49] |
|
| [50] |
|
| [51] |
|
| [52] |
|
| [53] |
|
| [54] |
|
| [55] |
|
/
| 〈 |
|
〉 |