
Degradation of alpine meadows exacerbated plant community succession and soil nutrient loss on the Qinghai-Xizang Plateau, China
Received date: 2024-07-09
Revised date: 2024-12-23
Accepted date: 2025-01-20
Online published: 2025-08-13
LI Shuangxiong , CHAI Jiali , YAO Tuo , LI Changning , LEI Yang . [J]. Journal of Arid Land, 2025 , 17(3) : 368 -380 . DOI: 10.1007/s40333-025-0008-8
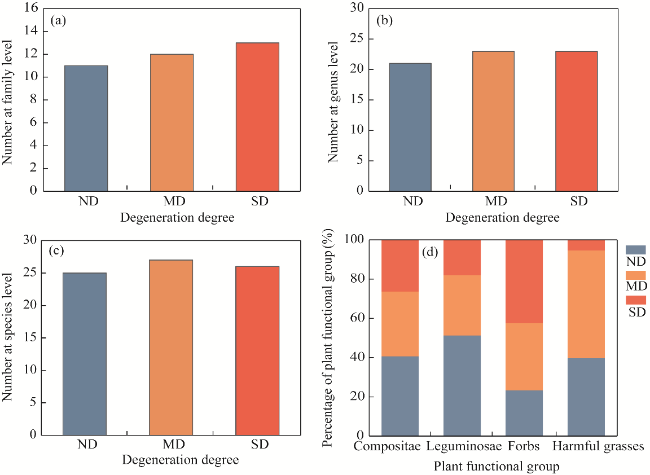
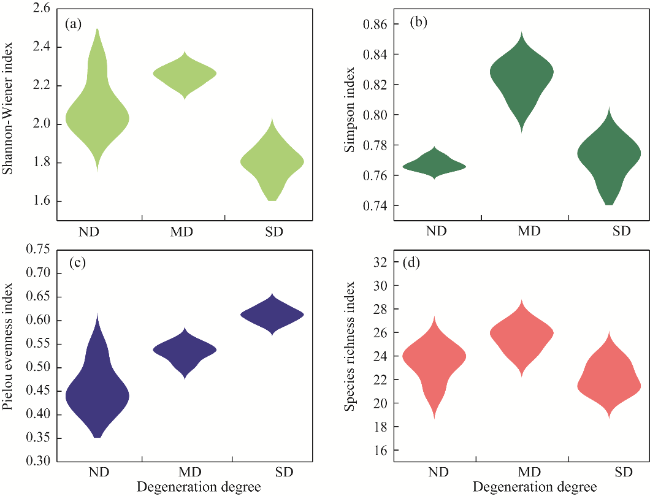
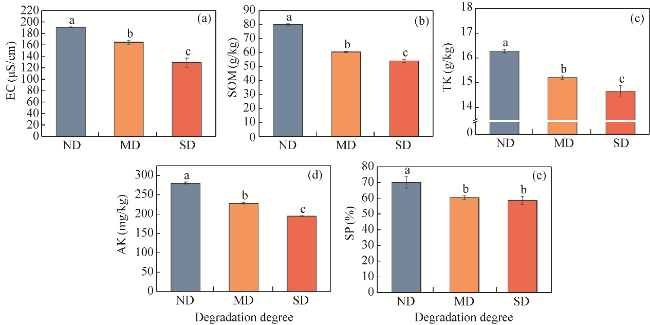
In recent decades, global climate change and overgrazing have led to severe degradation of alpine meadows. Understanding the changes in soil characteristics and vegetation communities in alpine meadows with different degrees of degradation is helpful to reveal the mechanism of degradation process and take the remediation measures effectively. This study analyzed the changes in vegetation types and soil characteristics and their interrelationships under three degradation degrees, i.e., non-degradation (ND), moderate degradation (MD), and severe degradation (SD) in the alpine meadows of northeastern Qinghai-Xizang Plateau, China through the long-term observation. Results showed that the aggressive degradation changed the plant species, with the vegetation altering from leguminous and gramineous to forbs and harmful grasses. The Pielou evenness and Simpson index increased by 24.58% and 7.01%, respectively, the Shannon-Wiener index decreased by 17.52%, and the species richness index remained constant. Soil conductivity, soil organic matter, total potassium, available potassium, and porosity declined. However, the number of vegetation species increased in MD. Compared with ND, the plant diversity in MD enhanced by 8.33%, 8.69%, and 7.41% at family, genus, and species levels, respectively. In conclusion, changes in soil properties due to degradation can significantly influence the condition of above-ground vegetation. Plant diversity increases, which improves the structure of belowground network. These findings may contribute to designing better protection measures of alpine meadows against global climate change and overgrazing.
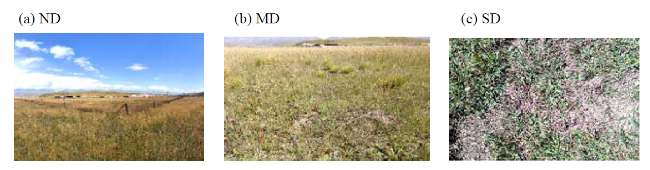
Fig. 1 Overview map of non-degraded (ND; a), moderately degraded (MD; b), and severely degraded (SD; c) alpine meadows in the Haibei Scientific Station, Qinghai Province, China |
Table 1 Methods for measurement of soil physical-chemical characteristics |
| Index | Abbreviation | Measurement method | Reference |
|---|---|---|---|
| Soil total potassium | TK | Flame photometry | Bao, 2000 |
| Soil available potassium | AK | Ammonium acetate leaching-flame photometry | |
| Electrical conductivity | EC | Conductivity meter method | |
| Soil porosity | SP | Ring knife method | |
| Soil organic matter | SOM | Potassium dichromate external heating method |
Table 2 Species and their important values (IV) of different degraded alpine meadows |
| No. | Species | Family | Life type | IV (%) | ||
|---|---|---|---|---|---|---|
| ND | MD | SD | ||||
| S1 | Elymus nutans Griseb. | Gramineae | P | 40.05±2.4362a | 33.61±2.0526b | 25.15±1.0638c |
| S2 | Medicago archiducis-nicolai Sirj. | Leguminosae | P | 13.95±1.8952a | 8.16±0.3524b | 4.99±0.6614c |
| S3 | Potentilla anserina Linn. | Rosaceae | P | 7.54±0.5236c | 11.36±1.9931b | 28.55±3.5268a |
| S4 | Potentilla saundersiana Royle | Rosaceae | P | 5.85±0.7455a | 4.68±0.3869b | 0.65±0.0142c |
| S5 | Lancea tibetica Hook. f. et Thoms. | Scrophulariaceae | P | 5.46±0.4538b | 15.67±1.2514a | 5.51±0.6891b |
| S6 | Oxytropis ochrocephala Bunge | Leguminosae | P | 4.71±0.3869a | 1.75±0.1417b | 0.72±0.0302c |
| S7 | Saussurea nigrescens Maxim. | Compositae | P | 3.16±0.4258a | 1.07±0.1314b | 0.22±0.0624c |
| S8 | Gentiana straminea Maxim. | Gentianaceae | P | 2.65±0.4736a | 0.62±0.0695b | - |
| S9 | Koeleria litvinowii Dom. | Gramineae | P | 2.07±0.3847a | 0.98±0.0524b | 0.49±0.0625c |
| S10 | Astragalus peterea Tsai et YV | Leguminosae | P | 1.93±0.1652a | 1.32±0.0589b | 0.22±0.0056c |
| S11 | Aster farreri W. W. Sm. et J.F. Jeffr. | Compositae | P | 1.85±0.0769b | 5.37±0.1564a | - |
| S12 | Angelica nitida Wolff | Umbelliferae | P | 1.58±0.1449 | - | - |
| S13 | Gentiana macrophylla Pall. | Gentianaceae | P | 1.17±0.1864 | - | - |
| S14 | Oxytropis kansuensis Bunge | Leguminosae | P | 1.11±0.0558a | 0.40±0.0146b | - |
| S15 | Thalictrum rutifolium Hook. f. et Thoms. | Ranunculaceae | P | 1.02±0.0498 | - | - |
| S16 | Allium cyaneum Regel | Liliaceae | P | 0.92±0.0089a | 0.65±0.0042b | - |
| S17 | Thalictrum alpinum Linn. | Ranunculaceae | P | 0.91±0.0735 | - | - |
| S18 | Gentianella azurea (Bunge) Holub | Gentianaceae | A | 0.71±0.1248b | - | 2.17±0.4561a |
| S19 | Artemisia moorcroftiana Wall. ex DC. | Compositae | P | 0.64±0.0864 | - | - |
| S20 | Ranunculus tanguticus (Maxim.) Ovcz. | Ranunculaceae | P | 0.57±0.0548a | 0.37±0.0423b | 0.08±0.0081c |
| S21 | Euphrasia regelii Wettst. | Scrophulariaceae | A | 0.56±0.0039b | - | 0.66±0.0041a |
| S22 | Microula sikkimensis (Clarke) Hemsl. | Boraginaceae | P | 0.52±0.0713b | 1.59±0.1347a | - |
| S23 | Festuca sinensis Keng | Gramineae | P | 0.44±0.0059 | - | - |
| S24 | Anemone rivularis Buch.-Ham. | Ranunculaceae | P | 0.37±0.0024 | - | - |
| S25 | Tibetia himalaica (Baker) Tsui | Leguminosae | P | 0.26±0.0089c | 1.20±0.1489b | 1.49±0.1312a |
| S26 | Saussurea pulchra Lipsch. | Compositae | P | - | 2.50±0.3337b | 5.57±0.7855a |
| S27 | Anaphalis lactea Maxim. | Compositae | P | - | 2.20±0.0568 | - |
| S28 | Erigeron acer Linn. | Compositae | P | - | 1.86±0.1004 | - |
| S29 | Ajania tenuifolia (Jacq.) Tzvel. | Compositae | P | - | 1.24±0.6389b | 6.13±0.9184a |
| S30 | Morina chinensis (Bat.) Diels | Dipsacaceae | P | - | 0.77±0.1832b | 1.31±0.3537a |
| S31 | Ligularia sagitta (Maxim.) Mattf. | Compositae | P | - | 0.69±0.0518b | 4.21±0.4113a |
| S32 | Gentianopsis paludosa (Hook.f.) Ma | Gentianaceae | A | - | 0.49±0.3737 | - |
| S33 | Aconitum gymnandrum Maxim. | Ranunculaceae | A | - | 0.49±0.0045a | 0.05±0.0001b |
| S34 | Delphinium caeruleum Jacq. ex Camb. | Ranunculaceae | P | - | 0.44±0.0121 | - |
| S35 | Astragalus polycladus Bur. et Franch. | Leguminosae | P | - | 0.29±0.0526a | 0.33±0.0051a |
| S36 | Viola bulbosa Maxim. | Violaceae | P | - | 0.23±0.0109b | 0.89±0.0417a |
| S37 | Stachys sieboldin Miq. | Labiatae | P | - | - | 3.30±0.2568 |
| S38 | Polygonum sibiricum Laxm. | Polygonaceae | A | - | - | 2.59±0.1471 |
| S39 | Taraxacum mongolicum Hand.-Mazz. | Compositae | P | - | - | 2.39±0.6627 |
| S40 | Stipa penicillate Hand.-Mazz. | Gramineae | P | - | - | 1.17±0.0504 |
| S41 | Festuca rubra Linn. | Gramineae | P | - | - | 0.73±0.0068 |
| S42 | Cerastium pusillum Seringe | Caryophyllaceae | P | - | - | 0.43±0.0037 |
Note: ND, non-degraded; MD, moderately degraded; SD, severely degraded. S1-S42 indicate plant species. ''-'' indicates no value; P, perennial; A, annual; IV, importance value. Different lowercase letters within the same plant species indicate significant differences among different degraded alpine meadows at P<0.050 level. |
Fig. 2 Changes in vegetation characteristics of ND, MD, and SD alpine meadows. (a), number at family level; (b), number at genus level; (c), number at species level; (d), percentage of plant functional group. |
Fig. 3 Plant diversity indices of ND, MD, and SD alpine meadows. (a), Shannon-Wiener index; (b), Simpson index; (c), Pielou evenness index; (d), species richness index. In Figure 3, width indicates the density of data, and length indicates the range of variability. |
Fig. 4 Soil characteristics of ND, MD, and SD alpine meadows. (a), EC (electrical conductivity); (b), SOM (soil organic matter); (c), TK (total potassium); (d), AK (available potassium); (e), SP (soil porosity). Different lowercase letters indicate significant differences among different degraded alpine meadows at P<0.050 level. The abbreviations are the same in the following figures. |
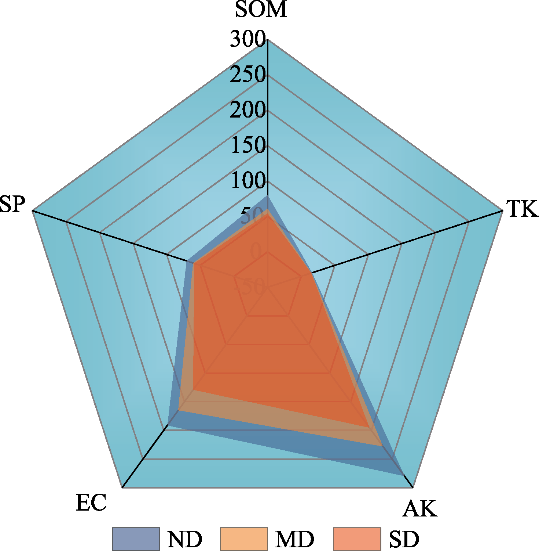
Fig. 5 Comparison of soil nutrient status in ND, MD, and SD alpine meadows. The values represent the relative distribution of the data in each dimension, and the overall approximation to a positive polygon represents a more balanced distribution of the soil nutrient status. |
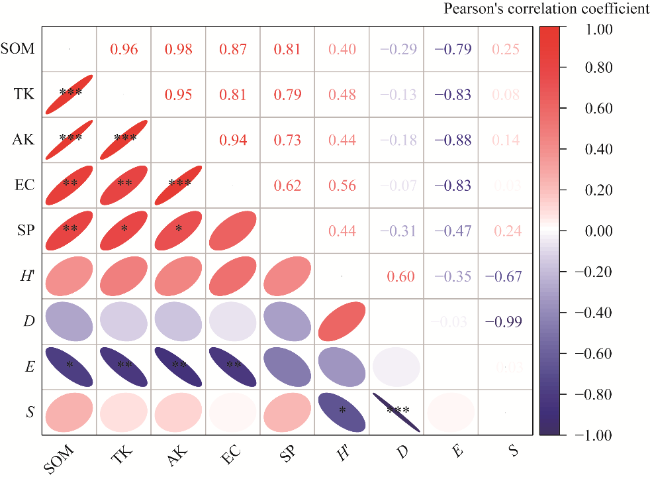
Fig. 6 Pearson's correlation coefficient between species diversity index and soil physical-chemical properties. H', Shannon-Wiener index; D, Simpson index; E, Pielou evenness index; S, species richness index. *, P<0.050 level; **, P<0.010 level; ***, P<0.001 level. |
| [1] |
|
| [2] |
|
| [3] |
|
| [4] |
|
| [5] |
|
| [6] |
|
| [7] |
|
| [8] |
|
| [9] |
|
| [10] |
|
| [11] |
|
| [12] |
|
| [13] |
|
| [14] |
|
| [15] |
|
| [16] |
|
| [17] |
|
| [18] |
|
| [19] |
|
| [20] |
|
| [21] |
|
| [22] |
|
| [23] |
|
| [24] |
|
| [25] |
|
| [26] |
|
| [27] |
|
| [28] |
|
| [29] |
|
| [30] |
|
| [31] |
|
| [32] |
|
| [33] |
|
| [34] |
|
| [35] |
|
| [36] |
|
| [37] |
|
| [38] |
|
| [39] |
|
| [40] |
|
| [41] |
|
| [42] |
|
| [43] |
|
| [44] |
|
| [45] |
|
| [46] |
|
| [47] |
|
| [48] |
|
| [49] |
|
| [50] |
|
| [51] |
|
| [52] |
|
| [53] |
|
| [54] |
|
| [55] |
|
| [56] |
|
| [57] |
|
| [58] |
|
| [59] |
|
| [60] |
|
| [61] |
|
/
| 〈 |
|
〉 |