
Spatio-temporal evolution analysis of landscape pattern and habitat quality in the Qinghai Province section of the Yellow River Basin from 2000 to 2022 based on InVEST model
Received date: 2024-05-11
Revised date: 2024-08-27
Accepted date: 2024-08-30
Online published: 2025-08-13
ZHENG Guoqiang , Li Cunxiu , LI Runjie , LUO Jing , FAN Chunxia , ZHU Hailing . [J]. Journal of Arid Land, 2024 , 16(9) : 1183 -1196 . DOI: 10.1007/s40333-024-0107-y
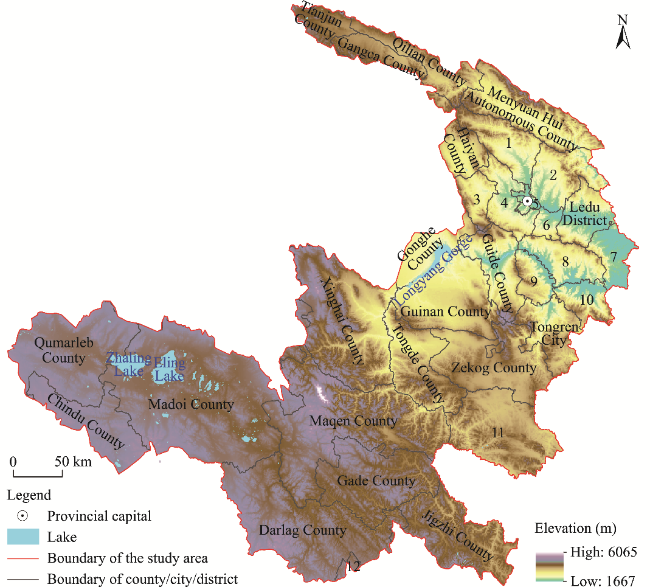
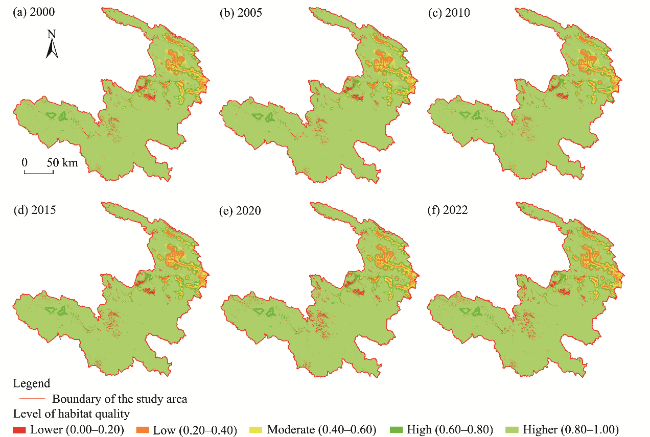
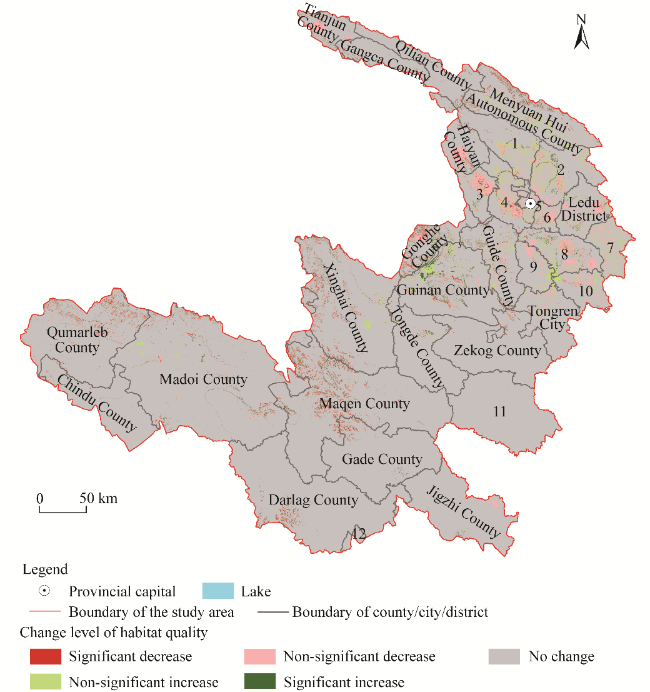
Habitat quality is an important indicator for evaluating the quality of ecosystem. The Qinghai Province section of the Yellow River Basin plays an important role in the ecological protection of the upper reaches of the Yellow River Basin. To comprehensively analysis the alterations of habitat quality in the Qinghai Province section of the Yellow River Basin, this study utilized the Integrated Valuation of Ecosystem Services and Tradeoffs (InVEST) model to calculate the habitat quality index and analyze the spatio-temporal variation characteristics of habitat quality in the study area from 2000 to 2022, and calculated seven landscape pattern indices (number of patches, patch density, largest patch index (LPI), landscape shape index (LSI), contagion index (CONTAG), Shannon diversity index, and Shannon evenness index) to research the variation of landscape pattern in the study area. The results showed that the number of patches, patch density, LPI, LSI, Shannon diversity index, and Shannon evenness index increased from 2000 to 2022, while the CONTAG decreased, indicating that the landscape pattern in the Qinghai Province section of the Yellow River Basin changed in the direction of distribution fragmentation, shape complexity, and heterogeneity. The average value of the habitat quality index in the Qinghai Province section of the Yellow River Basin from 2000 to 2022 was 0.90. Based on the value of habitat quality index, we divided the level of habitat quality into five categories: lower (0.00-0.20), low (0.20-0.40), moderate (0.40-0.60), high (0.60-0.80), and higher (0.80-1.00). Most areas were at the higher habitat quality level. The lower habitat quality patches were mainly distributed in Longyang Gorge and Yellow River-Huangshui River Valley. From 2000 to 2022, the habitat quality in most areas was stable; the increase areas were mainly distributed in Guinan County, while the decrease areas were mainly distributed in Xining City, Maqen County, Xinghai County, Qumarleb County, and Darlag County. To show the extent of habitat quality variation, we calculated Sen index. The results showed that the higher habitat quality area had a decrease trending, while other categories had an increasing tendency, and the decreasing was faster than increasing. The research results provide scientific guidance for promoting ecological protection and high-quality development in the Qinghai Province section of the Yellow River Basin.
Fig. 1 Location of the Qinghai Province section of the Yellow River Basin, China. 1, Datong Hui and Tu Autonomous County; 2, Huzhu Tu Autonomous County; 3, Huangyuan County; 4, Huangzhong County; 5, Xining City; 6, Pingan District; 7, Minhe Hui and Tu Autonomous County; 8, Hualong Hui Autonomous County; 9, Jainca County; 10, Xunhua Salar Autonomous County; 11, Henan Mongolian Autonomous County; 12, Baima County. |
Table 1 Threat factors of habitat quality selected by this study |
Table 2 Habitat suitability and sensitivity to threat factors for different land use types |
| Land use type | Habitat suitability | Habitat sensitivity | ||
|---|---|---|---|---|
| Cultivated land | Construction land | Unused land | ||
| Cultivated land | 0.40 | 0.00 | 0.40 | 0.40 |
| Forest | 1.00 | 0.70 | 0.80 | 0.50 |
| Grassland | 1.00 | 0.70 | 0.75 | 0.60 |
| Water body | 0.80 | 0.65 | 0.70 | 0.30 |
| Glacier | 1.00 | 0.00 | 0.80 | 0.30 |
| Unused land | 0.00 | 0.00 | 0.00 | 0.00 |
| Construction land | 0.10 | 0.00 | 0.00 | 0.00 |
| Wetland | 1.00 | 0.70 | 0.90 | 0.40 |
Table 3 Change in landscape pattern index in the Qinghai Province section in the Yellow River Basin from 2000 to 2022 |
| Year | Number of patches | Patch density (patches/hm2) | LPI (%) | LSI | CONTAG | Shannon diversity index | Shannon evenness index |
|---|---|---|---|---|---|---|---|
| 2000 | 47,016 | 0.3111 | 87.73 | 81.5409 | 80.7507 | 0.5137 | 0.2470 |
| 2005 | 46,040 | 0.3046 | 88.05 | 78.9123 | 81.1027 | 0.5068 | 0.2437 |
| 2010 | 47,825 | 0.3164 | 87.77 | 80.4385 | 80.5832 | 0.5214 | 0.2507 |
| 2015 | 45,658 | 0.3021 | 87.95 | 79.1291 | 80.9037 | 0.5130 | 0.2467 |
| 2020 | 46,268 | 0.3061 | 87.65 | 82.6330 | 80.3702 | 0.5248 | 0.2524 |
| 2022 | 47,518 | 0.3144 | 88.01 | 82.5149 | 80.4614 | 0.5210 | 0.2505 |
Note: LPI, largest patch index; LSI, landscape shape index; CONTAG, contagion index. |
Table 4 Area of different levels of habitat quality in the Qinghai Province section of the Yellow River Basin from 2000 to 2022 |
| Year | Lower habitat quality | Low habitat quality | Moderate habitat quality | High habitat quality | Higher habitat quality | |||||
|---|---|---|---|---|---|---|---|---|---|---|
| Area (km2) | Percentage (%) | Area (km2) | Percentage (%) | Area (km2) | Percentage (%) | Area (km2) | Percentage (%) | Area (km2) | Percentage (%) | |
| 2000 | 3608 | 2.38 | 5094 | 3.36 | 5412 | 3.56 | 6351 | 4.18 | 131,362 | 86.52 |
| 2005 | 3426 | 2.23 | 4956 | 3.23 | 5372 | 3.50 | 6541 | 4.26 | 133,272 | 86.78 |
| 2010 | 3213 | 2.11 | 5115 | 3.36 | 5046 | 3.32 | 6318 | 4.15 | 132,385 | 87.05 |
| 2015 | 3867 | 2.52 | 5095 | 3.32 | 4987 | 3.25 | 6704 | 4.37 | 132,914 | 86.55 |
| 2020 | 4738 | 3.12 | 5103 | 3.36 | 4899 | 3.23 | 7001 | 4.61 | 130,085 | 85.68 |
| 2022 | 4572 | 3.02 | 5351 | 3.54 | 5019 | 3.32 | 7271 | 4.81 | 128,930 | 85.30 |
Fig. 2 Spatial distribution of habitat quality in the Qinghai Province section of the Yellow River Basin in 2000 (a), 2005 (b), 2010 (c), 2015 (d), 2020 (e), and 2022 (f) |
Table 5 Change of area of different levels of habitat quality in the Qinghai Province section of the Yellow River Basin from 2000 to 2022 |
| Period | Percentage of area change (%) | ||||
|---|---|---|---|---|---|
| Lower habitat quality | Low habitat quality | Moderate habitat quality | High habitat quality | Higher habitat quality | |
| 2000-2005 | -0.15 | -0.13 | -0.06 | 0.08 | 0.26 |
| 2005-2010 | -0.12 | 0.13 | -0.18 | -0.11 | 0.27 |
| 2010-2015 | 0.41 | -0.04 | -0.07 | 0.22 | -0.50 |
| 2015-2020 | 0.60 | 0.04 | -0.02 | 0.24 | -0.87 |
| 2020-2022 | -0.10 | 0.18 | 0.09 | 0.20 | -0.38 |
| Sen index | 0.082 | 0.053 | 0.046 | 0.059 | -0.242 |
Note: Positive value means increase in area and negative value means decrease in area. |
Fig. 3 Spatial distribution of habitat quality transition process in the Qinghai Province section of the Yellow River Basin from 2000 to 2022. 1, Datong Hui and Tu Autonomous County; 2, Huzhu Tu Autonomous County; 3, Huangyuan County; 4, Huangzhong County; 5, Xining City; 6, Pingan District; 7, Minhe Hui and Tu Autonomous County; 8, Hualong Hui Autonomous County; 9, Jainca County; 10, Xunhua Salar Autonomous County; 11, Henan Mongolian Autonomous County; 12, Baima County. |
| [1] |
|
| [2] |
|
| [3] |
|
| [4] |
|
| [5] |
|
| [6] |
|
| [7] |
|
| [8] |
|
| [9] |
|
| [10] |
|
| [11] |
|
| [12] |
|
| [13] |
|
| [14] |
|
| [15] |
|
| [16] |
|
| [17] |
|
| [18] |
|
| [19] |
|
| [20] |
|
| [21] |
|
| [22] |
|
| [23] |
|
| [24] |
|
| [25] |
|
| [26] |
|
| [27] |
|
| [28] |
|
| [29] |
|
| [30] |
|
| [31] |
|
| [32] |
|
| [33] |
|
| [34] |
|
| [35] |
|
| [36] |
|
| [37] |
|
| [38] |
|
| [39] |
|
| [40] |
|
| [41] |
|
| [42] |
|
| [43] |
|
| [44] |
|
| [45] |
|
| [46] |
|
| [47] |
|
| [48] |
|
| [49] |
|
| [50] |
|
| [51] |
|
| [52] |
|
| [53] |
|
| [54] |
|
| [55] |
|
| [56] |
|
| [57] |
|
| [58] |
|
| [59] |
|
| [60] |
|
| [61] |
|
| [62] |
|
| [63] |
|
| [64] |
|
| [65] |
|
| [66] |
|
| [67] |
|
| [68] |
|
/
| 〈 |
|
〉 |