• GUO Bing 1 ,
  • XU Mei 1 ,
  • ZHANG Rui , 2, * ,
  • LUO Wei 3
展开

收稿日期: 2024-04-14

  修回日期: 2024-08-11

  录用日期: 2024-08-22

  网络出版日期: 2025-08-13

A new monitoring index for ecological vulnerability and its application in the Yellow River Basin, China from 2000 to 2022

  • GUO Bing 1 ,
  • XU Mei 1 ,
  • ZHANG Rui , 2, * ,
  • LUO Wei 3
Expand
  • 1School of Civil Engineering and Geomatics, Shandong University of Technology, Zibo 255000, China
  • 2Key Laboratory of Remote Sensing of Gansu Province, Heihe Remote Sensing Experimental Research Station, Northwest Institute of Eco-Environment and Resources, Chinese Academy of Sciences, Lanzhou 730000, China
  • 3North China Institute of Aerospace Engineering, Langfang 065000, China
*ZHANG Rui ()

Received date: 2024-04-14

  Revised date: 2024-08-11

  Accepted date: 2024-08-22

  Online published: 2025-08-13

本文引用格式

GUO Bing , XU Mei , ZHANG Rui , LUO Wei . [J]. Journal of Arid Land, 2024 , 16(9) : 1163 -1182 . DOI: 10.1007/s40333-024-0106-z

Abstract

The ecological environment of the Yellow River Basin has become more fragile under the combined action of natural and manmade activities. However, the change mechanisms of ecological vulnerability in different sub-regions and periods vary, and the reasons for this variability are yet to be explained. Thus, in this study, we proposed a new remote sensing ecological vulnerability index by considering moisture, heat, greenness, dryness, land degradation, and social economy indicators and then analyzed and disclosed the spatial and temporal change patterns of ecological vulnerability of the Yellow River Basin, China from 2000 to 2022 and its driving mechanisms. The results showed that the newly proposed remote sensing ecological vulnerability index had a high accuracy, at 86.36%, which indicated a higher applicability in the Yellow River Basin. From 2000 to 2022, the average remote sensing ecological vulnerability index of the Yellow River Basin was 1.03, denoting moderate vulnerability level. The intensive vulnerability area was the most widely distributed, which was mostly located in the northern part of Shaanxi Province and the eastern part of Shanxi Province. From 2000 to 2022, the ecological vulnerability in the Yellow showed an overall stable trend, while that of the central and eastern regions showed an obvious trend of improvement. The gravity center of ecological vulnerability migrated southwest, indicating that the aggravation of ecological vulnerability in the southwestern regions was more severe than in the northeastern regions of the basin. The dominant single factor of changes in ecological vulnerability shifted from normalized difference vegetation index (NDVI) to temperature from 2000 to 2022, and the interaction factors shifted from temperature∩NDVI to temperature∩precipitation, which indicated that the global climate change exerted a more significant impact on regional ecosystems. The above results could provide decision support for the ecological protection and restoration of the Yellow River Basin.

1 Introduction

Ecological environmental vulnerability is one of the key hot spots in the field of terrestrial ecology and is closely related to the development of regional sustainability (You et al., 2023). At present, mankind faces numerous environmental problems, such as global warming, ozone layer destruction, acid rain, insufficient freshwater resources, destruction of biodiversity, loss of water and soil, a sharp decline in forest resources, pollution of marine, and an increase in the production of hazardous waste (Wen et al., 2023a; Yuan et al., 2024). With the acceleration of urban modernization, humans are unconscionably destroying the environment, constantly plundering natural resources and blindly pursuing their own interests (Hu et al., 2023). The quality of ecological environment determines the survival and development of mankind (Cai et al., 2023). Therefore, evaluating ecological environmental vulnerability is crucial.
At present, commonly used ecological vulnerability assessment methods mainly comprise single-factor index method and comprehensive index method (Xiao et al., 2023). The single-factor index method is applied to evaluate vulnerability by extracting the key factor of regional ecological vulnerability, and it is widely applied in research on detection and monitoring of drought, flood, and debris flows (Tanago et al., 2016; Wang et al., 2023b). The comprehensive index method has been widely applied in quality evaluation of ecological environment and ecosystem health (Du et al., 2023). Existing comprehensive index models on ecological vulnerability research field primarily include pressure-state-response (PSR) model, exposure-sensitivity-adaptation (VSD) model, sensitivity-elasticity-pressure (SEP) model, sensitivity-resilience-pressure (SRP) model, depth to water, recharge, aquifer media, soil media, topography, impact of the vadose zone, and conductivity (DRASTIC) model, system dynamics (SD) model, driving force-pressure-state-impact-response (DPSIR) model, and driving force-pressure-state-security-response (DPSWR) model (Yu et al., 2022a; He et al., 2023; Yu et al., 2023). Zhao et al. (2003) constructed an index system focusing on climate, land, biology, and environmental factors to study the ecological vulnerability zoning of soil and water loss in Shanxi Province, China. Ren et al. (2018) constructed an evaluation system consisting of 18 indicators across 8 factors: population and social pressure, intensity of anthropogenic disturbances, land use pattern, ecological environment quality, terrain, climate, level of economic and social development, and ecological construction capacity to assess the ecological vulnerability in rapidly urbanizing areas. Sun and Xiu (2011) used pressure-sensitivity-elasticity (PSE) model by constructing an index system around the ecological sensitivity index, ecological elasticity index, and ecological pressure index to evaluate the ecological vulnerability of mining cities.
Index weight assignment directly affects the results of ecological vulnerability; therefore, it is particularly important to select appropriate weight assignment method (Lu et al., 2023). Liu and Liu (2009) used the analytic hierarchy process to determine the ecological vulnerability of Yulin City, Shaanxi Province, China. Zhao et al. (2024), based on the SRP model, used the entropy weight method to determine the weight of each indicator, constructing an ecological vulnerability assessment index system for urban agglomerations. Kang (2023) constructed a nature-humanity-response ecological vulnerability evaluation model and then utilized the entropy weight method to evaluate and compare the degree of ecological vulnerability in different zones of Zunhua City, Guizhou Province, China. Zhang (2018) applied the entropy method to assign weights to indicators in assessing the ecological vulnerability of 45 cities in western China.
The Yellow River Basin, an important area for ecological function in China, greatly contributes to promoting the coordinated development of the eastern, central, and western regions of the country and national ecological security (Yang et al., 2023; Zhang et al., 2023a; Zhang et al., 2023b). With the proposal of the national major strategy of ecological protection and high-quality development in the Yellow River Basin, the change in eco-environmental vulnerability has attracted increasing attention (Bai et al., 2023; Wang et al., 2023a). However, during the past few decades, the ecosystem process has undergone evident changes (Huang et al., 2023; Wang et al., 2024a). The change patterns and dominant driving factors in different periods are not yet clear. The normalized different vegetation index (NDVI) has been widely used in studies measuring ecological vulnerability, which can be explained by the fact that with measures such as afforestation and reforestation, the vegetation quantity increases, leading to significant fluctuations in the impact on ecological vulnerability. By 2022, vegetation quantity tended toward saturation, and with global warming, temperature has become the most significant influencing factor. With global warming, the increase in water vapor in the air gradually transforms into precipitation, replacing NDVI and temperature as the dominant interacting factor.
In order to reveal the change patterns of the eco-environmental quality and determine the dominant factors in the Yellow River Basin from 2000 to 2022, we proposed a new remote sensing ecological vulnerability index that considers the interference of human activities. Then, this index was applied to investigate the spatial and temporal changes of ecological vulnerability of the Yellow River Basin from 2000 to 2022 and then determine the dominant factors in different periods. The aims of the study are to propose a new remote sensing ecological vulnerability index that considers both natural factors and artificial factors, and to reveal and determine the dominant factors of eco-environmental quality in different sub-regions of the Yellow River Basin and different periods from 2000 to 2022.

2 Study area and data collection

2.1 Study area

The Yellow River Basin (32°10′-41°50′N, 95°53′-119°05′E; Fig. 1) covers an area greater than 7.5×10⁵ km2 (Lin et al., 2023). The basin is composed of four geomorphic units: the Inner Mongolia Plateau, the Loess Plateau, the Qinghai-Xizang Plateau, and the Huanghuai Plain. The terrain decreases from the west to the east, showing three major ladders, with a relief of more than 4000 m (He et al., 2023a). The climate is characterized by large temperature differences, unevenly distributed precipitation, large interannual precipitation changes, low air humidity, and significant evaporation. Vegetation is mostly distributed in the middle and lower reaches of the basin and the main vegetation types comprise forest, grassland, and farmland.
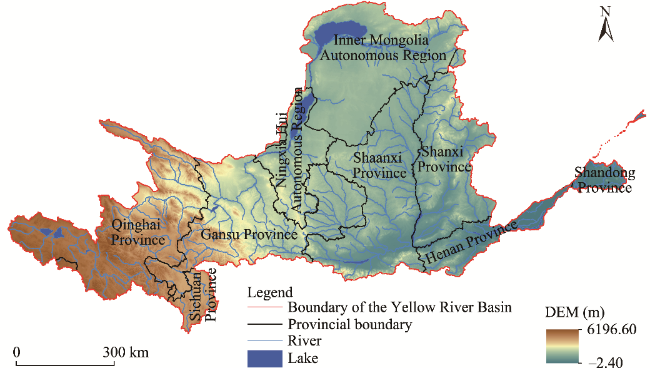
Fig. 1 Location and elevation of the Yellow River Basin, China. DEM, digital elevation model.

2.2 Data sources and preprocessing

The data used in the present study were obtained from the National Aeronautics and Space Administration (NASA) of the United States (https://www.nasa.gov/). The data sources were Moderate Resolution Imaging Spectroradiometer (MODIS) product datasets (MOD09A1, MOD11A2, MOD13Q1, MOD15A2H, MOD17A3, and MCD43A3) from June to October of 2000-2022. The above datasets were preprocessed using MODIS Reprojection Tool (MRT), including stitching, projection (Social Impact Network (SIN) projection to Krasovsky- 1940-Albers), and resampling (all the above MODIS products were resampled into grids with the spatial resolution of 1000 m utilizing the bilinear interpolation method).
Nighttime light data from 2000 to 2022, corrected using Defense Meteorological Satellite Program/Operational Linescan System (DMSP/OLI) and National Polar-orbiting Operational Environmental Satellite System Preparatory Project/Visible Infrared Imaging Radiometer Suite (NPP/VIIRS) sensors, were obtained from Harvard Dataverse (Wei et al., 2023; Xu et al., 2023). As mentioned, the lighting data were obtained from Harvard Dataverse (https://dataverse.harvard.edu/dataset.xhtml?persistentId=doi:10.7910/DVN/GIYGJU), whereby the data from the two nighttime light sensors, NPP and DMSP, were fitted. The data of each period represent the average value for that year.
In the following study, nine driving factors were selected, namely elevation, slope, soil type (black soil, loess soil, red soil, sandy soil, and clay soil), temperature, precipitation, vegetation coverage, land use type, gross domestic product (GDP) density, and population density (Table 1). These driving factors were then divided into natural environmental factors and socio-economic factors. The selection of these factors involves a comprehensive consideration of natural and economic factors; first, they can cover the impact of the Yellow River Basin's ecological fragility to the greatest degree possible, and second, they are not only more conventional but also easier to obtain.
Table 1 Data sources of this study
Data type Period Data source Resolution (m)
MODIS product data 2000-2022 National Aeronautics and Space Administration (NASA, https://ladsweb.modaps.eosdis.nasa.gov) 500
DEM 2000-2022 General Bathymetric Chart of the Oceans (GEBCO, https://www.gebco.net/data_and_products/gridded_bathymetry
_data)
500
Soil type 2000-2022 Environmental and Scientific Data Center of the Chinese Academy of Sciences (https://www.resdc.cn) 500
Temperature 2000-2022 China Meteorological Data Service Center
(https://data.cma.cn)
250
Precipitation 2000-2022 China Meteorological Data Service Center
(https://data.cma.cn)
250
Vegetation coverage 2000-2022 NASA (https://ladsweb.modaps.eosdis.nasa.gov/) 250
Land use type 2000-2022 NASA (https://ladsweb.modaps.eosdis.nasa.gov/) 250
GDP density 2000-2022 Figshare (https://doi.org/10.6084/m9.figshare.17004523.v1) 500
Population density 2000-2022 Oak Ridge National Laboratory (ORNL) archive (https://landsc
an.ornl.gov)
500
Nighttime light data 2000-2022 Harvard Dataverse (https://dataverse.harvard.edu/dataset.xhtml
?persistentId=doi:10.7910/DVN/GIYGJU)
500

Note: MODIS, Moderate Resolution Imaging Spectroradiometer; DEM, digital elevation model; GDP, gross domestic product.

Natural environmental factors: digital elevation model (DEM) data with a spatial resolution of 500 m were obtained from General Bathymetric Chart of the Oceans (GEBCO). Slope was calculated in ArcGIS v.10.7 software (Esri, Redlands, California, USA) using DEM data. The soil type data were retrieved from Environmental and Scientific Data Center of the Chinese Academy of Sciences (https://www.resdc.cn). The temperature and precipitation data were downloaded from China Meteorological Data Service Center (https://data.cma.cn). Utilizing Kriging interpolation method and national meteorological station data, the grids of temperature and precipitation were obtained using ArcGIS v.10.7. The land use type and vegetation coverage data were obtained from MOD13Q1 and MCD12Q1 product data from NASA.
Socio-economic factors: GDP density data were derived from Figshare (https://doi.org/10.6084/m9.figshare.17004523.v1), which were calculated using the nighttime light data. Population density data were downloaded from Oak Ridge National Laboratory (ORNL) archive (https://landscan.ornl.gov).

3 Method

The MODIS remote sensing images from 2000 to 2022 were used as data sources. Supported by remote sensing and geographic information system (GIS) technologies, indicators representing the ecological vulnerability of the study area were extracted, a novel ecological vulnerability remote sensing index was proposed, and its threshold was defined to classify vulnerability levels. Based on this, we conducted dynamic monitoring on ecological environmental vulnerability evolution in the study area. Finally, geographic detectors were further used to explore the driving factors influencing the evolution of ecological environmental vulnerability in the study area. The flowchart of this study is shown in Figure 2.
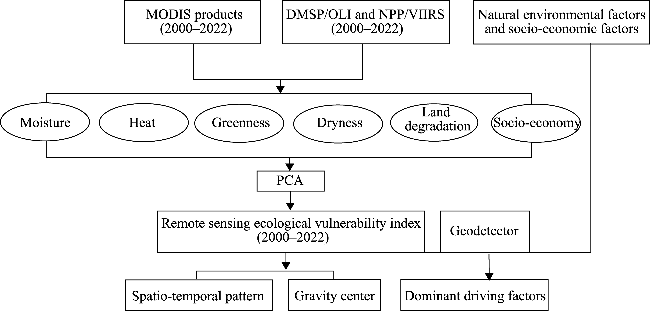
Fig. 2 Flowchart of this study. MODIS, Moderate Resolution Imaging Spectroradiometer; DMSP/OLI, Defense Meteorological Satellite Program/Operational Linescan System; NPP/VIIRS, National Polar-orbiting Operational Environmental Satellite System Preparatory Project/Visible Infrared Imaging Radiometer Suite; PCA, principal component analysis.

3.1 Principal component analysis (PCA)

PCA was used to transform the original multiple indicators into a few or several comprehensive indicators. The comprehensive indicators could be regarded as a linear combination of the initial indicators; therefore, these comprehensive indicators had no relationship with each other and could reflect the main information of the initial indicators (Ankush et al., 2023; Krzyśko et al., 2024).

3.2 Gravity center

The gravity center refers to the action point of the resultant force generated by the gravity of each part of an object. The gravity center could indicate the change deviation of ecological fragility. The transfer trajectory of gravity center could reflect the uneven variation in ecological vulnerability. The equations used in the present study are as follows (Wang et al., 2023b):
x ¯ = i = 1 n Z i x j i = 1 n Z i ,
y ¯ = i = 1 n Z i y j i = 1 n Z i ,
where Zi is the attribute value of ecological vulnerability in the ith year; xj and yj are the latitude and longitude coordinates of the jth point, respectively; and
x ¯
and
y ¯
are the latitude and longitude coordinates of the gravity center of ecological vulnerability after the calculation of the n points, respectively.
The gravity center migration distance and direction could be utilized to describe the degree of distribution imbalance (Xia et al., 2023). The equations of direction and distance are as follows:
θ = arctan y t + m y t x t + m x t t + m ,
d m = x t + m x t 2 + y t + m y t 2 ,
where θ is the gravity center deviation direction (°); dm is the gravity center deviation distance (m); yt+m and yt are the latitude coordinates in time t+m and time t, respectively; and xt+m and xt are the longitude coordinates in time t+m and time t, respectively.

3.3 Geodetector

In the following study, the mechanism driving ecological vulnerability changes was analyzed using geodetector. Based on geospatial differentiation concept, researchers used geodetector to detect the spatial distribution consistency of dependent variables and independent variables (Shan and Wang, 2023). In this study, the dependent variable Y represents the ecological vulnerability value for each grid, and the independent variable X represents the value of nine indicators such as DEM, slope, temperature, etc. The formulas used are as follows:
q = 1 h = 1 L N h σ h 2 N σ 2 = 1 W SS T SS ,
W SS = h = 1 L N h σ h 2 ,
T ss = N σ 2 ,
where q is the explanatory power of a factor, which is typically applied to measure the factor's contribution to the target variable; h is the layer or partition of the dependent variable Y and the independent variable X; Nh is the number of units in the layer h; N is the number of units;
σ h 2
is the variance of the Y value in the layer h; σ2 is the variance in the Y value; Wss is the total variance within each layer; and Tss is the total variance of the entire area. For q∈[0,1], the greater the q value, the stronger the explanatory power of X to Y and vice versa.

3.4 Calculation of vulnerability index

3.4.1 Moisture index

Water resources play an important role in surface ecosystem, with them greatly affecting energy balance and material exchange. In this study, the surface water content index (SWCI) was used as a humidity index (Zhang and Qi, 2023). The SWCI can better reflect the humidity status of surface vegetation and soil and is closely related to ecosystem conditions. The formula is as follows:
SWCI = B 6 B 7 B 6 + B 7 ,
where B6 and B7 are the 6th and 7th bands of MOD09A1, respectively.

3.4.2 Heat index

In this study, land surface temperature (LST) was selected as a heat index. The LST significantly affects vegetation growth and spatial distribution. It is a key factor affecting vegetation growth and an important indicator of ecosystem energy exchange (Zuo et al., 2023). In addition, it can also indicate the level of drought risk. The formula is as follows:
LST = 0.02 × T 273.15 ,
where LST is the land surface temperature (°C); and T is the value of the land surface absolute temperature (K).

3.4.3 Greenness index

Vegetation plays a dominant role in the ecosystem and can affect the ecosystem's structure and ensure the stability of the regional ecosystem. In this study, the NDVI, leaf area index (LAI), and net primary productivity (NPP) were selected to construct the greenness index, which better reflects the vegetation conditions. The NPP of terrestrial ecosystems is the material basis for human survival and development. It reflects the growth status and production capacity of plant communities under natural conditions. It is an important ecological indicator for estimating the Earth's support capacity and evaluating the sustainable development of terrestrial ecosystems (Wang et al., 2010). The formula is as follows:
GI = NDVI+LAI+NPP 3 ,
where GI is the greenness index.

3.4.4 Dryness index

In this study, the normalized different barren index (NDBI) and bare soil index (BSI) were selected to construct the normalized dryness soil index (NDSI) (Zuo et al., 2022). The formulas are as follows:
NDBI = B 1 B 4 B 1 + B 4 ,
BSI = ( B 6 + B 1 ) ( B 2 + B 3 ) ( B 6 + B 1 ) + ( B 2 + B 3 ) ,
NDSI = NDBI + BSI 2 ,
where B1, B2, B3, and B4 are the 1st, 2nd, 3rd, and 4th bands of MOD09A1, respectively.

3.4.5 Land degradation index

Land degradation, such as soil erosion, land desertification, and salinization, is widely distributed, which aggravates regional ecological vulnerability. In order to reflect the impacts of land degradation on ecosystems, we selected the surface albedo (Albedo), salinity index (SI), and topsoil grain size index (TGSI) to construct the land degradation index. The formulas are as follows:
Albedo=0.001 × M ,
SI = B 1 × B 3 ,
TGSI = B 1 B 3 B 1 + B 3 + B 4 ,
LDI = Albedo+SI+TGSI 3 ,
where M is the original value of surface albedo that derived from MCD43A3 product data.

3.4.6 Socio-economic index

Nighttime light data were found to have significant relationships with population distribution and GDP, which could better reflect the intensity of human activities. In this study, the fitted nighttime light data (DMSP/OLI and NPP/VIIRS) were selected as socio-economic indicator.
SEI = N L D N w ,
where SEI is the interference index of socio-economic; NLDN is the total lighting value for each district or county; and w is the number of districts or counties.

3.5 Construction of remote sensing ecological vulnerability index

Based on the above six indicators of humidity, heat, greenness, dryness, land degradation, and social economy, we applied PCA method to obtain the final remote sensing ecological vulnerability index for each year from 2000 to 2022. The PCA method can be used to not only reflect the specific ecological vulnerability index of each year but also better reflect the dynamic changes in the impact of different driving factors on ecological vulnerability.
RSEVI = α 1 × P 1 + α 2 × P 2 +...+ α x × P x ,
where RSEVI is the remote sensing ecological vulnerability index; ax is the contribution rate of the xth principal component; and Px is the xth principal component.

4 Results

4.1 Verification of the accuracy of remote sensing ecological vulnerability index

In order to verify the accuracy of remote sensing ecological vulnerability index obtained via inversion, we selected 276 sample points using uniform point distribution method in 2022 (Table 2). We divided the ecological vulnerability into five levels based on the natural break method of ArcGIS v.10.7 to more intuitively reveal the spatial and temporal distribution characteristics of different levels of ecological vulnerability (Hou et al., 2020). Remote sensing ecological vulnerability index <0.80 indicated slight vulnerability, 0.80-0.95 indicated mild vulnerability, 0.95-1.10 indicated moderate vulnerability, 1.10-1.25 indicated intensive vulnerability, and >1.25 indicated severe vulnerability. The error matrix was constructed and calculated using the sample points provided by Google Earth (https://www.google.cn/intl/zh-en/earth/) and the evaluation results. The overall accuracy of remote sensing ecological vulnerability index was 86.36%. The accuracy of moderate vulnerability was the highest, with an accuracy rate of 91.53% being recorded, followed by intensive vulnerability and slight vulnerability, with accuracy rate of 90.48% and 90.38%, respectively, while the accuracy rate of mild vulnerability was the worst, at 84.78%. In general, the remote sensing ecological vulnerability index has high applicability.
Table 2 Error matrix of remote sensing ecological vulnerability index in the Yellow River Basin in 2022
Vulnerability level Number of samples
Slight Mild Moderate Intensive Severe Sum
Slight vulnerability 47 2 0 0 0 49
Mild vulnerability 3 39 2 1 0 45
Moderate vulnerability 2 4 54 3 2 65
Intensive vulnerability 0 1 3 57 5 66
Severe vulnerability 0 0 0 2 49 51
Sum 52 46 59 63 56 276

4.2 Spatial distribution of average remote sensing ecological vulnerability index

Based on the series MODIS products and other datasets during 2000-2022, we calculated the remote sensing ecological vulnerability index for each year, and then utilized the raster calculator of ArcGIS v.10.7 to obtain the average remote sensing ecological vulnerability index for the Yellow River Basin (Fig. 2).
From 2000 to 2022, the average remote sensing ecological vulnerability index of the Yellow River Basin was 1.03, representing moderate vulnerability level. The spatial distribution patterns of ecological vulnerability at different levels differed greatly (Fig. 3). The area of slight vulnerability covered roughly 9.72×10⁴ km2, accounting for 12.40% of the total area. This particular area was mostly located in the eastern part of Qinghai Province, the northern part of Sichuan Province, and the northwestern area of Henan Province, spanning the east-west direction. The mild vulnerability area was mostly located in the western part of Shandong Province and the central and eastern parts of Qinghai Province, with an area of roughly 1.65×10⁵ km2, accounting for 20.98% of the total area. The moderate vulnerability covered an area of 1.66×10⁵ km2, accounting for 21.18% of the total area, and was mainly distributed in the southern part of Gansu Province and the central part of Shaanxi Province. The intensive vulnerability area was the largest (1.99×10⁴ km2), accounting for 25.39% of the total area and being mainly distributed in the northern part of Shaanxi Province and the eastern part of Shanxi Province. The severe vulnerability covered an area of 1.57×10⁴ km2, accounting for 20.05% of the total area, mainly located in the northern Shaanxi Province and the central Inner Mongolia Autonomous Region.
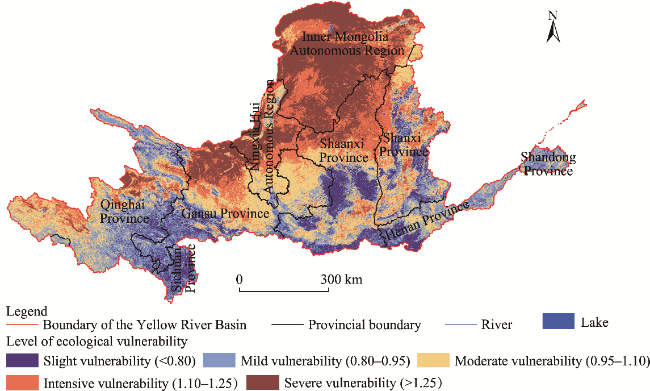
Fig. 3 Spatial distribution of average remote sensing ecological vulnerability index in the Yellow River Basin from 2000 to 2022

4.3 Change rate of ecological vulnerability

In this study, we used ArcGIS v.10.7 to determine the change rate of ecological vulnerability from 2000 to 2022, which could better display the change pattern and law of ecological vulnerability. The natural discontinuity method can reasonably divide the ecological vulnerability index into different intervals. In this study, the difference between the discontinuous values of different year intervals was not large, the error was less than 0.02, which was within a reasonable controllable range. The change rate of ecological vulnerability (CR) was divided into five levels: CR< -0.20 as severe improvement, -0.20<CR< -0.05 as moderate improvement, -0.05<CR<0.05 as stable, 0.05<CR<0.20 as moderate intensification, and CR>0.20 as severe intensification (Fig. 4).
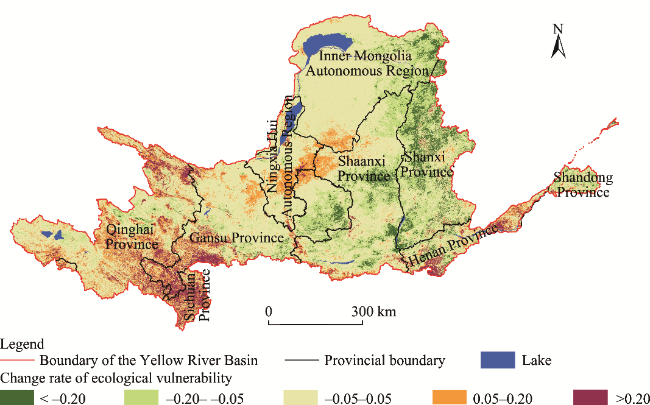
Fig. 4 Change rate of ecological vulnerability in the Yellow River Basin from 2000 to 2022
From 2000 to 2022, the stable area constituted the largest area, accounting for 58.43% of the entire study area, and was mainly distributed in the central and southern parts of Gansu Province, the southern part of Inner Mongolia Autonomous Region, and the northern and southern parts of Shaanxi Province. Severe intensification areas were mainly distributed in the southeastern part of Qinghai Province and the northern of Sichuan Province, primarily due to their geographic location and unique climate types, which leaded to frequent natural disasters such as droughts, wind and sand, landslides, and debris flows, significantly impacting the ecological environment. Moderate intensification areas were mainly found in the western part of Qinghai Province, the central of Ningxia Hui Autonomous Region, and the western part of Shaanxi Province, including western of Tongren City and northwestern of Guyuan City. Moderate improvement areas were primarily in the northern part of Shaanxi Province and the western part of Shanxi Province, such as eastern of Yan'an City, Weinan City, eastern of Yulin City, and Linfen City. Severe improvement areas were concentrated in the eastern part of Lishi City and the western part of Yuncheng City in Shanxi Province. In summary, the overall ecological vulnerability showed a stable trend over the past 23 a, and the vulnerability of the central and eastern regions showed an obvious improvement trend.

4.4 Migration trajectory of the gravity center of ecological vulnerability

The gravity center migration trajectory of ecological vulnerability can better reflect the spatial imbalance of ecological vulnerability in the study area. Using ArcGIS v.10.7, we calculated and analyzed the gravity center of ecological vulnerability at a 5-a scale (2000-2004, 2005-2009, 2010-2014, 2015-2019, and 2020-2022), and the trajectory change of the gravity center was analyzed.
The center of gravity of ecological vulnerability was very concentrated, with it being mainly distributed in Huanxian County, Henan Province, which is located in the central of the basin (Fig. 5). The change degree of the gravity centers in the northeastern and southwestern orientations was much greater than that in the other directions. Compared with that of 2000-2004, the average gravity center of 2005-2009 moved northwestward, indicating that the intensification degree in the northwest parts was greater than that of the southeast parts. The average gravity center of 2010-2014 moved southwest compared with that of 2005-2009, indicating that the intensification degree in the southwest parts was greater than that of the northeastern parts. Moreover, the average gravity center of 2015-2019 continued to move southwest, whereas that of 2020-2022 moved northeast. In summary, the gravity center of ecological vulnerability showed a trend of moving southwestward from 2000 to 2022, indicating that the intensification degree of ecological vulnerability in the southwest regions was greater than that of the northeast regions.
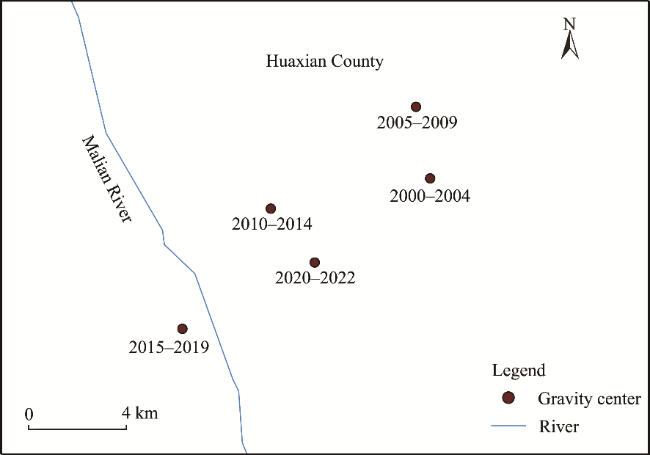
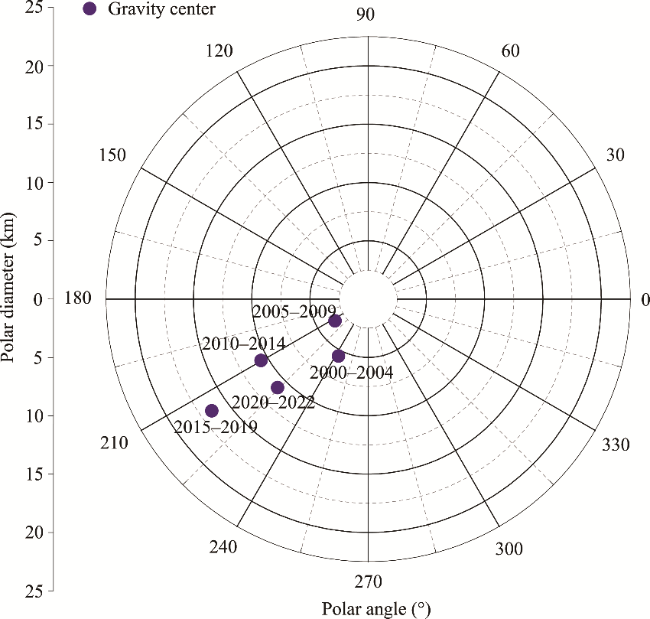
Fig. 5 Migration trajectory of the gravity center of ecological vulnerability in the Yellow River Basin from 2000 to 2022
To explore the spatial distribution imbalance of ecological vulnerability and the migration trajectory of its gravity center, this study utilized the mean center tool in ArcGIS v.10.7 to calculate the gravity centers of ecological vulnerability of the Yellow River Basin in the periods of 2000-2004, 2005-2009, 2010-2014, 2015-2019, and 2000-2022. The gravity centers of ecological vulnerability from 2000 to 2022 were mostly located in the third quadrant (Fig. 6). From 2000 to 2004, the gravity center of ecological vulnerability was in the southwestern direction of 62°27′26′′N, and the migration distance was 5.50 km. The migration distance of the gravity center from 2005 to 2009 was the shortest, with 3.39 km in the northwestern direction of 33°15′03′′N. From 2010 to 2014, the gravity center of ecological vulnerability migrated 10.59 km in the southwestern direction of 29°47′15′′N. The migration distance from 2015 to 2019 was the longest, with 16.49 km in the southwestern direction of 25°29′59′′N, whereas that moved 10.85 km in the northeastern direction of 45°42′04′′N from 2020 to 2022.
Fig. 6 Gravity center distribution of ecological vulnerability in the Yellow River Basin from 2000 to 2022

4.5 Dominant factors of ecological vulnerability

Due to the large terrain fluctuation in the Yellow River Basin, there were also great differences in climate, land use type, and vegetation coverage. According to the above geographical spatial differentiation patterns, this study divided the Yellow River Basin into three sub-regions (Fig. 7): Region I (plateau semi-arid area), Region II (mid-temperate arid area), and Region III (warm temperate semi-humid area) (Zhang et al., 2021). Using geodetector, the dominant single factors and interaction factors in the different sub-regions in 2000, 2010, and 2022 were determined using q-value (Table 3).
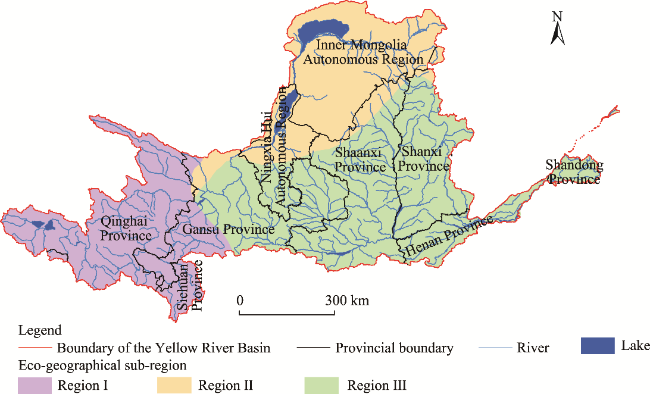
Fig. 7 Eco-geographical division of the Yellow River Basin
Table 3 q-value of dominant single factor and interaction factors of ecological vulnerability in different regions of the Yellow River Basin in 2000, 2010, and 2022
Year Area Single factor q-value Interaction factors q-value
2000 Yellow River Basin NDVI 0.784 Temperature∩NDVI 0.884
Region Ⅰ NDVI 0.707 Temperature∩NDVI 0.856
Region Ⅱ Temperature 0.561 Temperature∩NDVI 0.711
Region Ⅲ NDVI 0.754 Temperature∩NDVI 0.856
2010 Yellow River Basin NDVI 0.688 Temperature∩NDVI 0.817
Region Ⅰ NDVI 0.614 Temperature∩NDVI 0.714
Region Ⅱ NDVI 0.588 Temperature∩NDVI 0.617
Region Ⅲ NDVI 0.658 Temperature∩NDVI 0.762
2022 Yellow River Basin Temperature 0.677 Temperature∩precipitation 0.749
Region Ⅰ Temperature 0.609 Temperature∩NDVI 0.568
Region Ⅱ Temperature 0.602 Temperature∩precipitation 0.613
Region Ⅲ Temperature 0.597 Temperature∩precipitation 0.650
The dominant single factor of ecological vulnerability in the Yellow River Basin in 2000 was NDVI (q=0.784), and the dominant interaction factors were temperature∩NDVI (q=0.884) (Fig. 8). This study revealed that in 2000, the dominant single factor varied across different regions, but the dominant interaction factors were consistently temperature∩NDVI, with high q-values for all three sub-regions and the whole basin. In 2010, the dominant single factor across different regions was NDVI, and the dominant interaction factors were temperature∩NDVI. In 2022, the dominant single factor across different regions was temperature, the dominant interaction factors were temperature∩precipitation except Region Ⅰ.
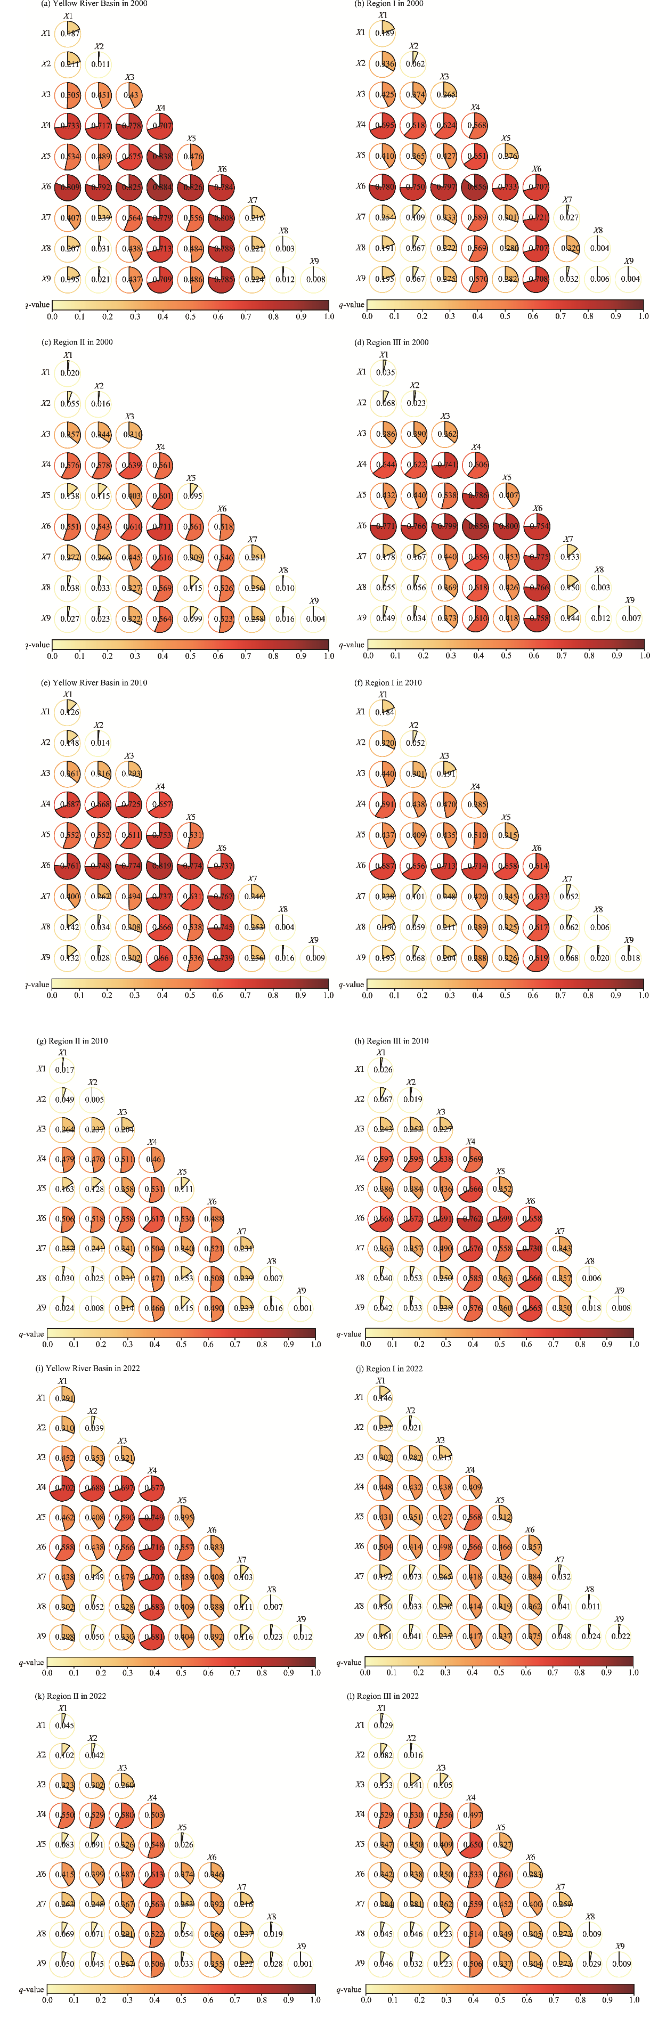
Fig. 8 q-values of dominant interaction factors in different regions of the Yellow River Basin in 2000 (a, b, c, and d), 2010 (e, f, g, and h), and 2022 (i, j, k, and l). X1, DEM; X2, slope; X3, soil type; X4, temperature; X5, precipitation; X6, normalized difference vegetation index (NDVI); X7, land use type; X8, gross domestic product (GDP) density; X9, population density.

5 Discussion

5.1 Advantages of remote sensing ecological vulnerability index

At present, scholars primarily use MODIS data to invert ecological remote sensing index based on multiple indicators to reflect the comprehensive condition of regional ecological environment. However, the impacts of human activities on ecological environment are often ignored (Duo et al., 2023). In this study, the socio-economic indicator indicated by nighttime light data was introduced to reflect the interference from human activities. The previous studies have utilized NDVI or fraction vegetation coverage (FVC) to reflect the vegetation condition of ecological environment (Yu et al., 2022b). Although NDVI or FVC was the most effective parameter for characterizing vegetation changes and could better reflect changes in vegetation greenness, it could not indicate the core canopy structure of vegetation growth season status (Wang et al., 2024b). Vegetation NPP could reflect the regional vegetation production capacity in the natural environment. In this study, NDVI, LAI, and NPP were introduced to the proposed greenness index to comprehensively reflect vegetation ecosystem condition (Cheng et al., 2022). Moreover, under the combined actions of global change and urbanization, land degradation has become an increasingly serious ecological problem, which should not be ignored in the evaluation of ecological vulnerability (Li et al., 2022). In addition, the soil erosion was still a serious ecological and environmental problem, which greatly affected the health of regional ecosystems (Zhao, 2023). Therefore, the Albedo, TGSI, and SI were introduced to indicate the condition of salinization, desertification, and soil erosion. The evaluated accuracy in this paper was higher than that of most previous studies in arid and semi-arid areas, which just considered the vegetation, land surface temperature, soil moisture, and surface albedo (Li et al., 2022; Yu et al., 2022). In addition to the traditional remote sensing evaluation index system, this study introduced the regional typical land degradation monitoring indicators (soil erosion, desertification, and soil salinization) to enhance the evaluation accuracy.

5.2 Spatial distribution of ecological vulnerability

The spatial distribution of different levels of ecological vulnerability differed greatly. The slight and mild vulnerability areas were predominantly located in the middle and eastern parts of Qinghai Province, the northern part of Sichuan Province, the middle of Shaanxi Province, and the northwestern part of Henan Province (Niu et al., 2024). The primary explanation for this finding is that the western part of the vulnerable area is located in the plateau, with this area being characterized by a high altitude, low temperature, less precipitation, and being rarely disturbed by human activities (Niu et al., 2022). During the past decades, more ecological protection measures, namely ecological protection zone, returning farmland to forests and grasslands, return grazing land to grassland have been implemented to improve the ecological conditions in the upper reaches of the Yellow River Basin. Moreover, with the climate becoming warmer and more humid, regional vegetation ecosystem had been rapidly restored (Sun and Wang, 2022). In terms of the eastern part of the basin, the level of precipitation is sufficient, which is conducive to vegetation growth (Guo et al., 2024).
The moderate vulnerability areas were mainly concentrated in the southern part of Gansu Province and the northern part of Shaanxi Province, which was consistent with findings of Wang et al. (2023b) that the junction zone of Gansu Province and Shaanxi Province were covered by mild and moderate vulnerability. In these regions, the precipitation and temperature vary greatly with seasons, with significant evaporation and frequent floods and droughts (Yang et al., 2024). With the rapid expansion of urbanization, regional vegetation ecosystem has been greatly destroyed, which intensified the ecological vulnerability of these regions (Wen et al., 2023a).
The severe vulnerability areas were mostly concentrated in the northern part of Ningxia Hui Autonomous Region, the northern part of Gansu Province, and the southern part of Inner Mongolia Autonomous Region, which is similar with the discoveries from Zhang et al. (2022) that the intensive and severe vulnerability areas were mainly distributed in the junction zone of Ningxia Hui Autonomous Region-Gansu Province-Inner Mongolia Autonomous Region. In these regions, the hydrothermal conditions are poor, which is not conducive to vegetation growth (Wang et al., 2024c). Before 2000, under the stress of drought and unreasonable human development, namely overgrazing and disorderly development of mineral resources, the grassland and forests were greatly destroyed. Due to lack of precipitation, it is difficult to restore vegetation ecosystems (Wang et al., 2023b). In addition, the Loess Plateau is located in these regions, where the intensive and severe soil erosion are widely distributed (Niu et al., 2022). In the northeastern part of the basin, the precipitation was scarcity, the dryness is relatively high, and the vegetation is sparse, which leads to severe desertification in these regions combined with the unreasonable human activities, such as overgrazing (Wang et al., 2024c). It finally exacerbated the fragility of the ecological environment (Wen et al., 2023b).

5.3 Dominant factors of ecological vulnerability

From 2000 to 2022, natural environmental factors were the key driving factors of changes in ecological vulnerability. The dominant single factor in 2000 and 2010 was NDVI, while that of 2022 was temperature. The primary explanation for this finding is that vegetation greatly contributed to regulating ecosystem functions, including the hydrothermal cycle and exchange (Kong et al., 2024). Vegetation has the functions of windbreak, sand fixation, water conservation, and soil stabilization, which could mitigate the land degradation process, such as soil erosion and desertification (Sun and Wang, 2022). In 2022, temperature became the dominant factor of ecological environment vulnerability, due to the gradual increase in average temperature with global warming. The increasing temperature would lead to the instability of water supply, increasing evaporation in the basin, frequent droughts in the upper reaches, a decline in water level in the lower reaches, significant sediment deposition, and an irreversible impact on the environment (Bai et al., 2023). In addition, in alpine regions, the rising temperature is conductive to the photosynthesis of vegetation, which would promote the restoration of vegetation ecosystems (Kong et al., 2024).
The dominant interaction factors in 2000 and 2010 were temperature∩NDVI and the dominant interaction factors in 2022 were temperature∩precipitation. The influence of temperature on the ecological environment ran through the whole process. The main difference was that the influence of precipitation on ecology gradually increased under the influence of global warming. Due to the increase in evaporation, the water level of the basin decreased, and drought and shortage of vegetation and crops were significant. An increase in precipitation would lessen the basin's vulnerability (Wu et al., 2022). Under the combined actions of temperature, precipitation became the driving interaction factor with the greatest explanatory power. The hydrothermal resources were the core factor that affected the processes of regional ecosystems in the semi-arid and arid areas, while in the humid eastern parts of the basin, the water resources also played an important role in the regional economic development, such as agriculture and industry (Bai et al., 2023).
From 2000 to 2022, the single factor explanatory power of population density remained relatively stable, while its interaction with other driving factors exhibited nonlinear enhancement. This nonlinear enhancement may be attributed to the complex geographical and socio-economic characteristics of the Yellow River Basin (Wang et al., 2023b). As population density increases, the complexity of resource demands, environmental pressures, and socio-economic activities also grows, potentially leading to nonlinear effects (Niu et al., 2022; Wu et al., 2022). For instance, high population density may cause interactions with factors such as land use changes, pollution emissions, and water resource utilization to become more pronounced, resulting in these interactions becoming nonlinear rather than linear (Sun and Wang, 2022). This nonlinear enhancement reflected the increased complexity and significance of interactions among driving factors in areas with higher population density. The rapid increase in population would have a double-edged sword effect on the protection of regional ecological environment. On one hand, the disorderly mining, overgrazing, steep slope cultivation, and rapid urbanization process would greatly destroy the regional ecosystem, resulting in serious soil erosion, vegetation damage, water pollution, and desertification (Duo et al., 2023). On the other hand, with the rapid development of economy, more environmental policies and measures have been implemented, such as afforestation, returning farmland to forests and grasslands, which have greatly promoted the restoration of regional ecosystems (Bai et al., 2023; Kong et al., 2024).

6 Conclusions

By fully considering the characteristics of natural conditions and human activities in the Yellow River Basin, we selected six indicators, namely moisture, heat, greenness, dryness, land degradation, and social economy to propose a new remote sensing ecological vulnerability index that can be used to explore the spatial-temporal evolution of ecological vulnerability and its driving mechanisms. The newly proposed remote sensing ecological vulnerability index demonstrated high applicability in the study area, with an overall accuracy rate of 86.36%. From 2000 to 2022, the average remote sensing ecological vulnerability index was 1.03, belonging to moderate vulnerability level. The intensive vulnerability accounted for the largest area proportion (25.39%). The overall ecological vulnerability of the Yellow River Basin from 2000 to 2022 showed a stable trend, and the vulnerability of the central and eastern parts of the basin showed an obvious improvement trend. The gravity center of ecological vulnerability shifted toward the southwestern direction, indicating that the intensified degree and rate of ecological vulnerability in the southwestern part of the Yellow River Basin was greater than that in the northeastern part. From 2000 to 2022, the dominant single factor shifted from NDVI to temperature and the dominant interaction factors shifted from temperature∩NDVI to temperature∩precipitation. During the past 23 a, the Yellow River Basin overall belonged to the moderate vulnerability level, which also showed an improvement trend under the combined actions and climate change and artificial factors. However, in this study, we did not determine the optimal driving factors. In further research, a weight allocation method that integrates both objective and subjective factors should be used to determine precise evaluation metrics, thereby improving the accuracy of assessment. Additionally, the selection and inversion of driving factors should be refined, choosing factors suitable for the study area and reducing the focus on irrelevant factors with low weight.

Conflict of interest

The authors declare that they have no known competing financial interests or personal relationships that could have appeared to influence the work reported in this paper.

Acknowledgements

The present research was funded by the National Natural Science Foundation of China (42471329, 42101306, 42301102), the Natural Science Foundation of Shandong Province (ZR2021MD047), the Scientific Innovation Project for Young Scientists in Shandong Provincial Universities (2022KJ224), and the Gansu Youth Science and Technology Fund Program (24JRRA100).

Author contributions

Conceptualization: GUO Bing, XU Mei, ZHANG Rui; Methodology: GUO Bing, XU Mei, LUO Wei; Formal analysis: XU Mei, ZHANG Rui; Writing - original draft preparation: GUO Bing, XU Mei, ZHANG Rui; Writing - review and editing: GUO Bing, XU Mei, ZHANG Rui; Funding acquisition: GUO Bing, XU Mei; Resources: XU Mei, ZHANG Rui; Supervision: GUO Bing. All authors approved the manuscript.
[1]
Ankush R, Saurabh K G, Suraj K S, et al. 2023. Predicting future land use utilizing economic and land surface parameters with ANN and Markov chain models. Earth, 4(3): 728-751.

[2]
Bai X, Zhang Z W, Li Z, et al. 2023. Spatial heterogeneity and formation mechanism of eco-environmental quality in the Yellow River Basin. Sustainability, 15(14): 10878, doi: 10.3390/su151410878.

[3]
Cai Z C, Zhang Z, Zhao F, et al. 2023. Assessment of eco-environmental quality changes and spatial heterogeneity in the Yellow River Delta based on the remote sensing ecological index and geo-detector model. Ecological Informatics, 77: 102203, doi: 10.1016/j.ecoinf.2023.102203.

[4]
Cheng Y, Zhang L J, Zhang Z Q, et al. 2022. Spatiotemporal variation and influence factors of vegetation cover in the Yellow River Basin (1982-2021) based on GIMMS NDVI and MOD13A1. Water, 14(20): 3274-3274.

[5]
Du W P, Hao Z X, Bai M X, et al. 2023. Spatiotemporal variation in the Meteorological drought comprehensive index in the Beijing-Tianjin-Hebei Region during 1961-2023. Water, 15(24): 4230, doi: 10.3390/w15244230.

[6]
Duo L H, Wang J Q, Zhang F Q, et al. 2023. Assessing the spatiotemporal evolution and drivers of ecological environment quality using an enhanced remote sensing ecological index in Lanzhou City, China. Remote Sensing, 15(19): 4704, doi: 10.3390/rs15194704.

[7]
Guo Y, Zhang L F, He Y, et al. 2024. LSTM time series NDVI prediction method incorporating climate elements: A case study of Yellow River Basin, China. Journal of Hydrology, 629: 130518, doi: 10.1016/j.jhydrol.2023.130518.

[8]
He B S, Han F, Han J L, et al. 2023a. The ecological evolution analysis of heritage sites based on the remote sensing ecological index—A case study of Kalajun-Kuerdening World Natural Heritage Site. Remote Sensing, 15(5): 1179-1179.

[9]
He X R, Cai C Y, Tang J X, et al. 2023b. Analysis of coupling coordination and obstacle factors between tourism development and ecosystem services value: A case study of the Yellow River Basin, China. Ecological Indicators, 157: 111234, doi: 10.1016/j.ecolind.2023.111234.

[10]
Hou K, Tao W D, Wang L M, et al. 2020. Study on hierarchical transformation mechanisms of regional ecological vulnerability and its applicability. Ecological Indicators, 114: 106343, doi: 10.1016/j.ecolind.2020.106343.

[11]
Hu W, Liu J S. 2023. The coupling and coordination of urban modernization and low-carbon development. Sustainability, 15(19): 14335, doi: 10.3390/su151914335.

[12]
Huang J, Zhong P S, Zhang J Z, et al. 2023. Spatial-temporal differentiation and driving factors of ecological resilience in the Yellow River Basin, China. Ecological Indicators, 154: 110763, doi: 10.1016/j.ecolind.2023.110763.

[13]
Kang N. 2023. Ecological vulnerability assessment based on 'nature-humanity-response' model. Environment and Development, 35(1): 52-57. (in Chinese)

[14]
Kong X L, Han M, Li Y L, et al. 2024. Spatial differentiation and formation mechanism of ecological sensitivity in large river basins: A case study of the Yellow River Basin, China. Ecological Indicators, 158: 111571, doi: 10.1016/j.ecolind.2024.111571.

[15]
Krzyśko M, Nijkamp P, Ratajczak W, et al. 2024. Spatio-temporal principal component analysis. Spatial Economic Analysis, 19(1): 8-29.

[16]
Li H C, Guan Q Y, Sun Y F, et al. 2022. Spatiotemporal analysis of the quantitative attribution of soil water erosion in the upper reaches of the Yellow River Basin based on the RUSLE-TLSD model. Catena, 212: 106081, doi: 10.1016/j.catena.2022.106081.

[17]
Lin Z Q, Liu Y Y, Wen Z M, et al. 2023. Spatial-temporal variation characteristics and driving factors of net primary production in the Yellow River Basin over multiple time scales. Remote Sensing, 15(22): 5273, doi: 10.3390/rs15225273.

[18]
Liu X Q, Liu Y S. 2009. Research on the sustainable development of vulnerable ecological region based on AHP—A case study of Yulin City. Journal of Arid Land Resources and Environment, 23(5): 19-23. (in Chinese)

[19]
Lu Q G, Zhang Y D, Song B C, et al. 2023. The responses of ecological indicators to compound extreme climate indices in southwestern China. Ecological Indicators, 157: 11253, doi: 10.1016/j.ecolind.2023.111253.

[20]
Niu W T, Shi J Y, Xu Z Z, et al. 2022. Evaluating the sustainable land use in ecologically fragile regions: A case study of the Yellow River Basin in China. International Journal of Environmental Research and Public Health, 19(6): 3222, doi: 10.3390/ijerph19063222.

[21]
Niu H P, Xiu Z Y, Xiao D Y. 2024. Impact of land-use change on ecological vulnerability in the Yellow River Basin based on a complex network model. Ecological Indicators, 166: 112212, doi: 10.1016/j.ecolind.2024.112212.

[22]
Ren H Y, Zhou X, Zhang D, et al. 2018. Changes of ecological risk in Karst mountain city during rapid urbanization—A case study in Huaxi District, Guiyang. Journal of Guizhou Normal University (Natural Sciences), 36(5): 16-23. (in Chinese)

[23]
Shan Y, Wang N L. 2023. Spatiotemporal evolution and the influencing factors of China's high-tech industry GDP using a geographical detector. Sustainability, 15(24): 16678, doi: 10.3390/su152416678.

[24]
Shi X X, Li J, Liu J F, et al. 2008. Eco-environment vulnerability evaluation based on successive projection pursuit model: a case study of Selangor, Malaysia. Journal of Natural Disasters, 17(6): 129-133.

[25]
Sun P J, Xiu C L. 2011. Study on the vulnerability of economic development in mining cities based on the PSE Model. Geographical Research, 30(2): 301-310. (in Chinese)

[26]
Sun Y F, Wang N L. 2022. Sustainable urban development of the π-shaped curve area in the Yellow River Basin under ecological constraints: A study based on the improved ecological footprint model. Journal of Cleaner Production, 337: 130452, doi: 10.1016/j.jclepro.2022.130452.

[27]
Tanago I G, Urquijo J, Blauhut V, et al. 2016. Learning from experience: a systematic review of assessments of vulnerability to drought. Natural Hazards, 80(2): 951-973.

[28]
Wang K L, Zhou J, Tan M L, et al. 2024a. Impacts of vegetation restoration on soil erosion in the Yellow River Basin, China. Catena, 234: 107547, doi: 10.1016/j.catena.2023.107547.

[29]
Wang Q X, Zhang P Y, Chang Y H, et al. 2024b. Landscape pattern evolution and ecological risk assessment of the Yellow River Basin based on optimal scale. Ecological Indicators, 158: 111381, doi: 10.1016/j.ecolind.2023.111381.

[30]
Wang X L, Zhang S R, Zhao X, et al. 2023a. Exploring the relationship between the eco-environmental quality and urbanization by utilizing sentinel and Landsat data: A case study of the Yellow River Basin. Remote Sensing, 15(3): 743, doi: 10.3390/rs15030743.

[31]
Wang X R, Duan L R, Zhang T J, et al. 2023b. Ecological vulnerability of China's Yellow River Basin: evaluation and socioeconomic driving factors. Environmental Science and Pollution Research, 30(54): 115915-115928.

[32]
Wang Y, Xia W T, Liang T G, et al. 2010. Spatial and temporal dynamic changes of net primary product based on MODIS vegetation index in Gannan grassland. Acta Prataculturae Sinica, 19(1): 201-210. (in Chinese)

[33]
Wang Z Y, Xiong H X, Zhang F W, et al. 2024c. Sustainable development assessment of ecological vulnerability in arid areas under the influence of multiple indicators. Journal of Cleaner Production, 436: 140629, doi: 10.1016/j.jclepro.2024.140629.

[34]
Wei S F, Dong Y, Qiu Y X, et al. 2023. Temporal and spatial analysis of vegetation cover change in the Yellow River Delta based on Landsat and MODIS time series data. Environmental Monitoring and Assessment, 195(9): 1057, doi: 10.1007/s10661-023-11652-5.

[35]
Wen B Q, Huang C L, Zhou C, et al. 2023a. Spatiotemporal dynamics and driving factors of soil erosion in the Beiluo River Basin, Loess Plateau, China. Ecological Indicators, 155: 110976, doi: 10.1016/j.ecolind.2023.110976.

[36]
Wen G C, Wu B J, Wang L, et al. 2023b. Analysis of eco-environmental geological problems and their driving forces in the Henan section of the Yellow River Basin, China. Sustainability, 15(8): 6818, doi: 10.3390/su15086818.

[37]
Wu H, Fang S M, Zhang C, et al. 2022. Exploring the impact of urban form on urban land use efficiency under low-carbon emission constraints: A case study in China's Yellow River Basin. Journal of Environmental Management, 311: 114866, doi: 10.1016/j.jenvman.2022.114866.

[38]
Xia T T, Wang Y, Zhang S. 2023. Spatio-temporal coupling analysis of differences in regional grain-economy-population and water resources. Atmosphere, 14(3): 431, doi: 10.3390/atmos14030431.

[39]
Xiao H, Shao H Y, Long J M, et al. 2023. Spatial-temporal pattern evolution and geological influence factors analysis of ecological vulnerability in western Sichuan mountain region. Ecological Indicators, 155: 110980, doi: 10.1016/j.ecolind.2023.110980.

[40]
Xu Y Z, Hao S, Cui Y H, et al. 2023. Analysis of the spatiotemporal expansion and pattern evolution of urban areas in Anhui Province, China, based on nighttime light data. Ecological Indicators, 157: 11283, doi: 10.1016/j.ecolind.2023.111283.

[41]
Yang X L, Feng Z W, Chen Y Y. 2023. Evaluation and obstacle analysis of high-quality development in Yellow River Basin and Yangtze River Economic Belt, China. Humanities and Social Sciences Communications, 10(1): 757, doi: 10.1057/s41599-023-02278-6.

[42]
Yang Y H, Qin T L, Yan D H, et al. 2024. Analysis of the evolution of ecosystem service value and its driving factors in the Yellow River Source Area, China. Ecological Indicators, 158: 111344, doi: 10.1016/j.ecolind.2023.111344.

[43]
You G X, Chen T Y, Shen P X, et al. 2023. Designing an ecological network in Yichang central city in China based on habitat quality assessment. Sustainability, 15(10): 8313, doi: 10.3390/su15107835.

[44]
Yu S, Yang L L, Song Z J, et al. 2023. Measurement of land ecological security in the middle and lower reaches of the Yangtze River Base on the PSR Model. Sustainability, 15(19): 14098, doi: 10.3390/su151914098.

[45]
Yu T T, Leng H, Yuan Q, et al. 2022a. Vulnerability evaluation of villages based on social-ecological indicators and strategies for improvement: Case study of villages in the Northeast China Plain. Journal of Urban Planning and Development, 148(1): 04021059, doi: 10.1061/(asce)up.1943-5444.0000770.

[46]
Yu Z, Chen X Z, Zhou G Y, et al. 2022b. Natural forest growth and human induced ecosystem disturbance influence water yield in forests. Communications Earth Environment, 3(1): 148, doi: 10.1038/s43247-022-00483-w.

[47]
Yuan D H, Du M R, Yan C L, et al. 2024. Coupling coordination degree analysis and spatiotemporal heterogeneity between water ecosystem service value and water system in Yellow River Basin cities. Ecological Informatics, 79: 102440, doi: 10.1016/j.ecoinf.2023.102440.

[48]
Zhang Q, Wang G, Yuan R Y, et al. 2022. Dynamic responses of ecological vulnerability to land cover shifts over the Yellow River Basin, China. Ecological Indicators, 144: 109554, doi: 10.1016/j.ecolind.2022.109554.

[49]
Zhang J, Liu Y, Liu C, et al. 2023a. Study on the spatial and temporal evolution of high-quality development in nine provinces of the Yellow River Basin. Sustainability, 15(8): 6975, doi: 10.3390/su15086975.

[50]
Zhang M N, Qi S Z. 2023. The spatio-temporal evolution and driving factors of high-quality development in the Yellow River Basin during the period of 2010-2022. Sustainability, 15(18): 13512, doi: 10.3390/su151813512.

[51]
Zhang Y L, Wang Y L, Fu B J, et al. 2023b. Identification of critical ecological areas using the ecosystem multifunctionality-stability-integrity framework: A case study in the Yellow River Basin, China. Journal of Environmental Management, 348: 119296, doi: 10.1016/j.jenvman.2023.119296.

[52]
Zhang Y M. 2018. The evaluation of ecological vulnerability in western China: An exploratory analysis based on 45 cities in western China. Journal of Statistics and Information, 33(8): 74-84. (in Chinese)

[53]
Zhang Z W, Chang T Y, Qiao X N, et al. 2021. Eco-economic coordination analysis of the Yellow River Basin in China: Insights from major function-oriented zoning. Sustainability, 13(5): 2715, doi: 10.3390/su13052715.

[54]
Zhao Y X. 2003. Research of regionalism by ecological fragility based on condition of soil erosion in Shanxi Province. Journal of Soil and Water Conservation, 17(4): 71-74. (in Chinese)

[55]
Zhao Z Z, Ma Q, Wang Y, et al. 2024. Analysis and prediction of ecological vulnerability of the central plains urban agglomeration based on the SRP Model. Environmental Science, doi: 10.13227/j.hjkx.202403011.

[56]
Zuo L, Sun L G, Lu J J, et al. 2022. MODIS-based comprehensive assessment and spatial-temporal change monitoring of ecological quality in Beijing-Tianjin-Hebei region. Remote Sensing for Natural Resources, 34(2): 203-214. (in Chinese)

文章导航

/