
Influence of vapor pressure deficit on vegetation growth in China
Received date: 2023-12-27
Revised date: 2024-04-25
Accepted date: 2024-04-29
Online published: 2025-08-13
LI Chuanhua , ZHANG Liang , WANG Hongjie , PENG Lixiao , YIN Peng , MIAO Peidong . [J]. Journal of Arid Land, 2024 , 16(6) : 779 -797 . DOI: 10.1007/s40333-024-0077-0
Vapor pressure deficit (VPD) plays a crucial role in determining plant physiological functions and exerts a substantial influence on vegetation, second only to carbon dioxide (CO2). As a robust indicator of atmospheric water demand, VPD has implications for global water resources, and its significance extends to the structure and functioning of ecosystems. However, the influence of VPD on vegetation growth under climate change remains unclear in China. This study employed empirical equations to estimate the VPD in China from 2000 to 2020 based on meteorological reanalysis data of the Climatic Research Unit (CRU) Time-Series version 4.06 (TS4.06) and European Centre for Medium-Range Weather Forecasts (ECMWF) Reanalysis 5 (ERA-5). Vegetation growth status was characterized using three vegetation indices, namely gross primary productivity (GPP), leaf area index (LAI), and near-infrared reflectance of vegetation (NIRv). The spatiotemporal dynamics of VPD and vegetation indices were analyzed using the Theil-Sen median trend analysis and Mann-Kendall test. Furthermore, the influence of VPD on vegetation growth and its relative contribution were assessed using a multiple linear regression model. The results indicated an overall negative correlation between VPD and vegetation indices. Three VPD intervals for the correlations between VPD and vegetation indices were identified: a significant positive correlation at VPD below 4.820 hPa, a significant negative correlation at VPD within 4.820-9.000 hPa, and a notable weakening of negative correlation at VPD above 9.000 hPa. VPD exhibited a pronounced negative impact on vegetation growth, surpassing those of temperature, precipitation, and solar radiation in absolute magnitude. CO2 contributed most positively to vegetation growth, with VPD offsetting approximately 30.00% of the positive effect of CO2. As the rise of VPD decelerated, its relative contribution to vegetation growth diminished. Additionally, the intensification of spatial variations in temperature and precipitation accentuated the spatial heterogeneity in the impact of VPD on vegetation growth in China. This research provides a theoretical foundation for addressing climate change in China, especially regarding the challenges posed by increasing VPD.
Key words: vapor pressure deficit (VPD); near-infrared reflectance of vegetation (NIRv); leaf area index (LAI); gross primary productivity (GPP); Climatic Research Unit (CRU) Time-Series version 4.06 (TS4.06); European Centre for Medium-Range Weather Forecasts (ECMWF) Reanalysis 5 (ERA-5); climate change
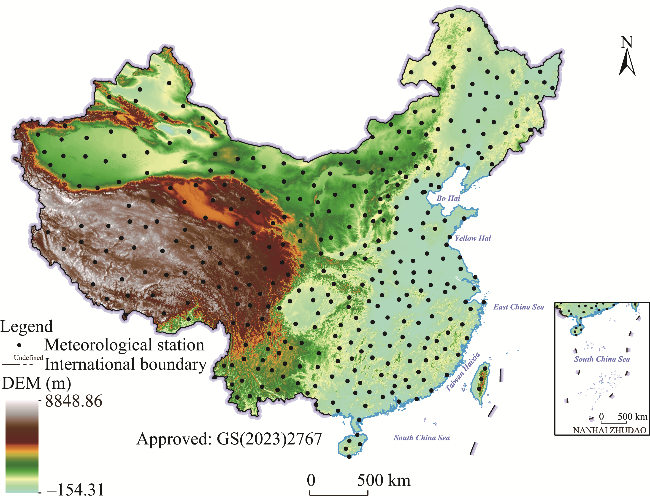
Fig. 1 Overview of China based on the digital elevation model (DEM) and the spatial distribution of meteorological stations. DEM data were obtained from the Geospatial Data Cloud (http://www.gscloud.cn) with a spatial resolution of 90 m. Note that this map is based on the standard map (GS(2023)2767) of the Map Service System (http://bzdt.ch.mnr.gov.cn/) marked by the Ministry of Natural Resources of the People's Republic of China, and the base map has not been modified. |
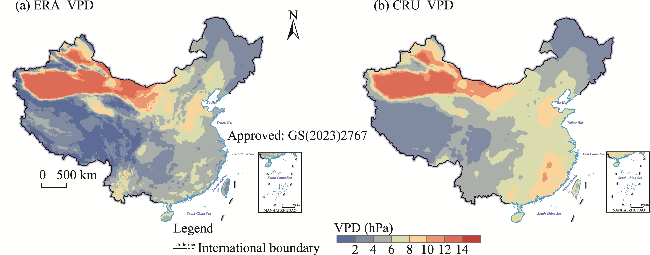
Fig. 2 Spatial distribution of ERA_VPD (a) and CRU_VPD (b) in China in 2020. VPD, vapor pressure deficit; ERA_VPD, vapor pressure deficit estimated from the European Centre for Medium-Range Weather Forecasts (ECMWF) Reanalysis 5 (ERA-5); CRU_VPD, vapor pressure deficit estimated from the Climatic Research Unit (CRU) Time-Series version 4.06 (CRU TS4.06). Note that the figures are based on the standard map (GS(2023)2767) of the Map Service System (http://bzdt.ch.mnr.gov.cn/) marked by the Ministry of Natural Resources of the People's Republic of China, and the base map has not been modified. |
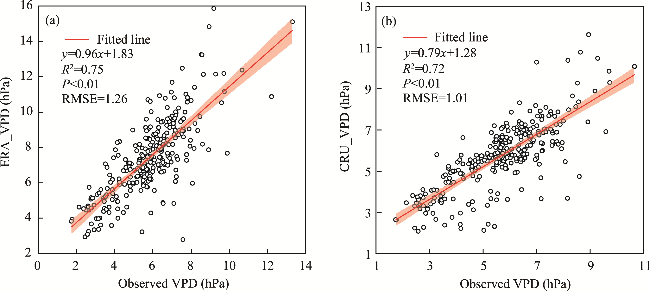
Fig. 3 Accuracy validation of ERA_VPD (a) and CRU_VPD (b) using the meteorological station observational data. RMSE, root mean square error. Shaded areas indicate a 95% confidence interval. |
Table 1 Categories of the Mann-Kendall test trend |
| α | Z | Change trend |
|---|---|---|
| α>0 | |Z|≥2.56 | Highly significant increasing |
| α>0 | 1.96≤|Z|<2.56 | Significant increasing |
| α=0 | |Z|<1.96 | Not significant change |
| α<0 | 1.96≤|Z|<2.56 | Significant decreasing |
| α<0 | |Z|≥2.56 | Highly significant decreasing |
Note: α is estimated magnitude of the trend slope in the time series of the data; Z is the standardized test statistic. |
Fig. 4 Trends in annual average VPD (a), annual average temperature (b), and annual precipitation (c) in China during 2000-2020. Shaded areas indicate a 95% confidence interval. |
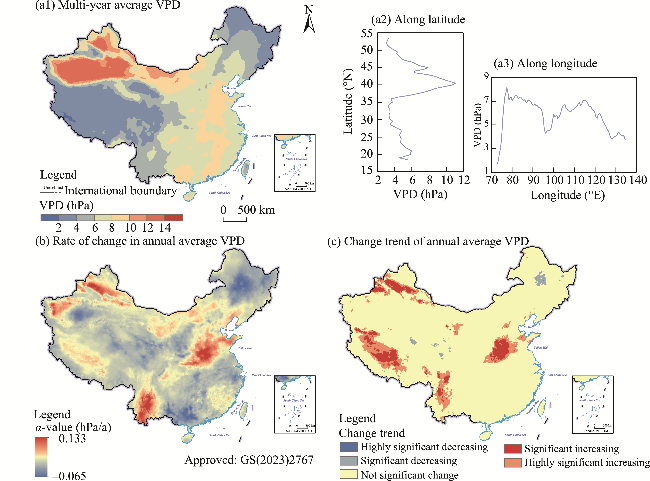
Fig. 5 Spatial variations of multi-year average VPD (a), rate of change (indicated by α-value) in annual average VPD (b), and change trend of annual average VPD (c) in China during 2000-2020. Figure 5a2 and a3 show variations in the mean values of multi-year average VPD along latitude and longitude. Note that the figures are based on the standard map (GS(2023)2767) of the Map Service System (http://bzdt.ch.mnr.gov.cn/) marked by the Ministry of Natural Resources of the People's Republic of China, and the base map has not been modified. |
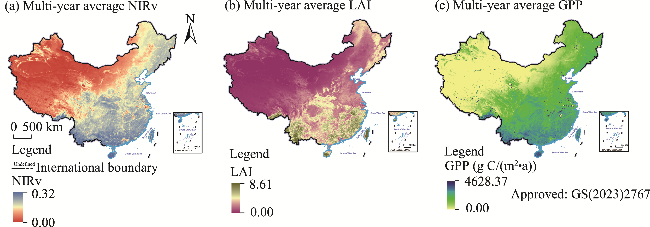
Fig. 6 Spatial distributions of multi-year average NIRv (a), multi-year average LAI (b), and multi-year average GPP (c) in China during 2000-2020. NIRv, near-infrared reflectance of vegetation; LAI, leaf area index; GPP, gross primary productivity. Note that the figures are based on the standard map (GS(2023)2767) of the Map Service System (http://bzdt.ch.mnr.gov.cn/) marked by the Ministry of Natural Resources of the People's Republic of China, and the base map has not been modified. |
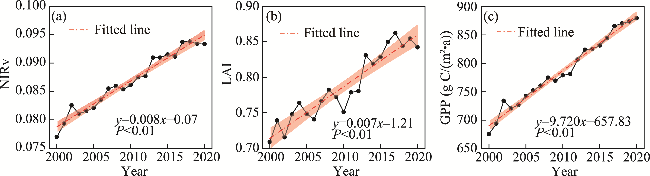
Fig. 7 Trends in NIRv (a), LAI (b), and GPP (c) in China during 2000-2020. Shaded areas indicate a 95% confidence interval. |
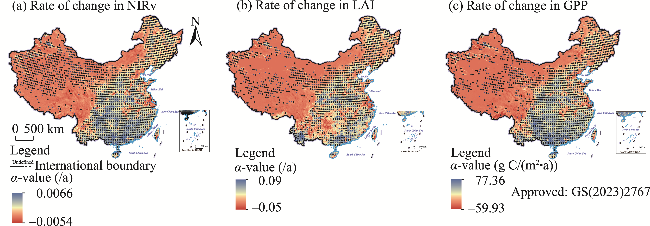
Fig. 8 Spatial variations in rates of change (indicated by α-values) of NIRv (a), LAI (b), and GPP (c) in China during 2000-2020. Black markers indicate the regions with statistically significant trends (P<0.05). Note that the figures are based on the standard map (GS(2023)2767) of the Map Service System (http://bzdt.ch.mnr.gov.cn/) marked by the Ministry of Natural Resources of the People's Republic of China, and the base map has not been modified. |
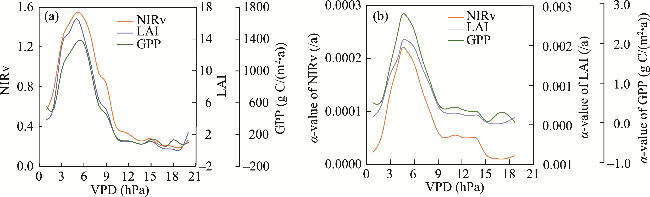
Fig. 9 Correlations between VPD and vegetation indices (a) as well as between VPD and rates of change (indicated by α-values) of vegetation indices (b). VPD, NIRv, LAI, and GPP values in the figures were multi-year average values during 2000-2020. |
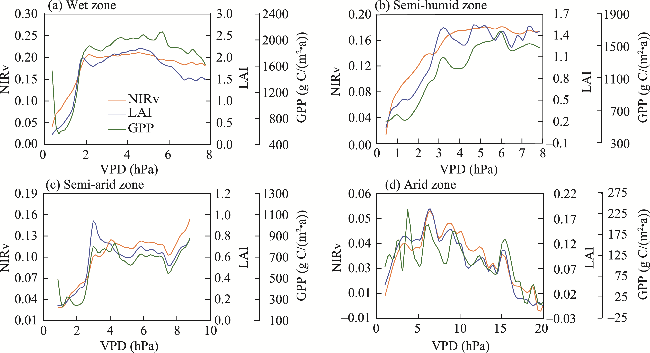
Fig. 10 Correlations between VPD and vegetation indices in wet zone (a), semi-humid zone (b), semi-arid zone (c), and arid zone (d) in China. VPD, NIRv, LAI, and GPP values in the figures were multi-year average values during 2000-2020. |
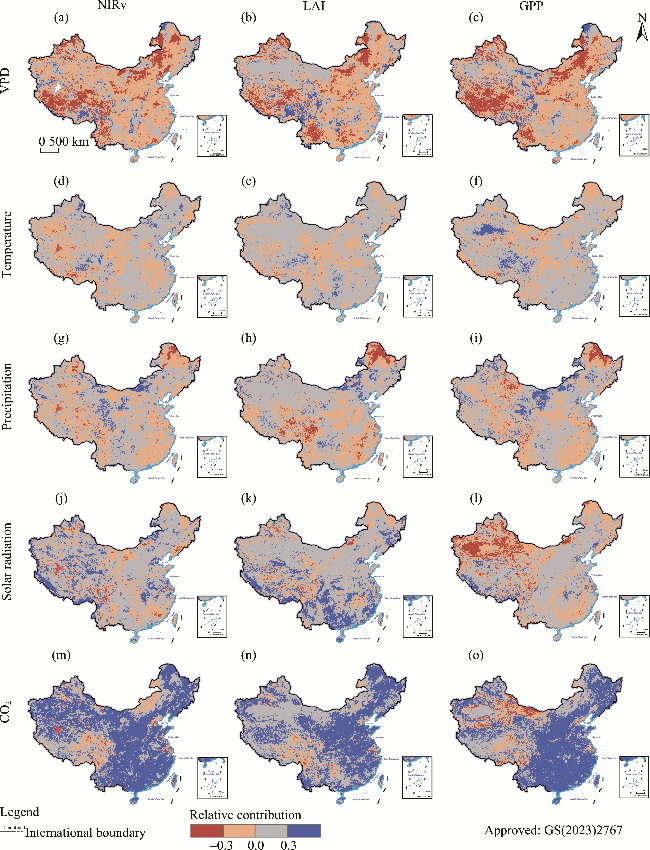
Fig. 11 Relative contributions of VPD (a-c), temperature (d-f), precipitation (g-i), solar radiation (j-l), and CO2 (m-o) to changes in NIRv, LAI, and GPP in China during 2000-2020. Note that the figures are based on the standard map (GS(2023)2767) of the Map Service System (http://bzdt.ch.mnr.gov.cn/) marked by the Ministry of Natural Resources of the People's Republic of China, and the base map has not been modified. |
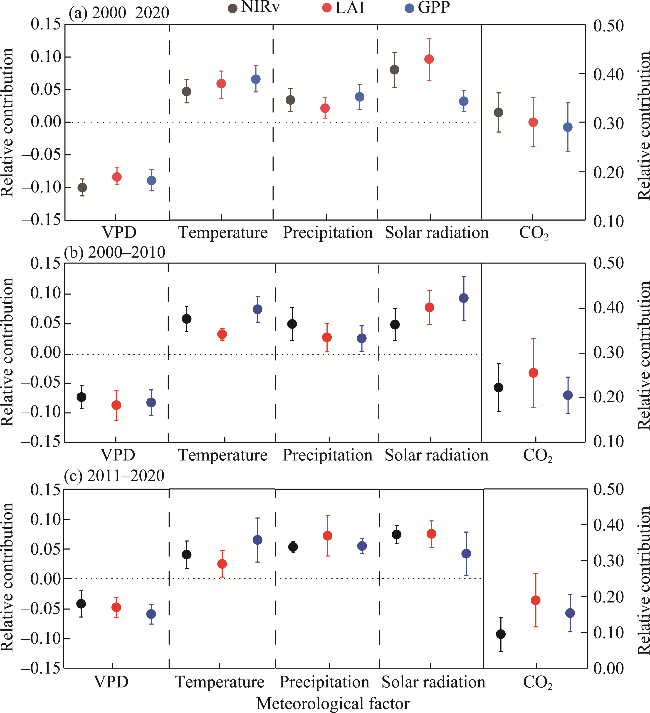
Fig. 12 Relative contributions of various meteorological factors to vegetation indices during 2000-2020 (a), 2000-2010 (b), and 2011-2020 (c). Solid circles represent mean values. Upper and lower whiskers indicate the confidence intervals of 5% and 95%, respectively. |
| [1] |
|
| [2] |
|
| [3] |
|
| [4] |
|
| [5] |
|
| [6] |
|
| [7] |
|
| [8] |
|
| [9] |
|
| [10] |
|
| [11] |
|
| [12] |
|
| [13] |
|
| [14] |
|
| [15] |
|
| [16] |
|
| [17] |
|
| [18] |
|
| [19] |
|
| [20] |
|
| [21] |
|
| [22] |
|
| [23] |
|
| [24] |
|
| [25] |
|
| [26] |
|
| [27] |
|
| [28] |
|
| [29] |
|
| [30] |
|
| [31] |
|
| [32] |
|
| [33] |
|
| [34] |
|
| [35] |
|
| [36] |
|
| [37] |
|
| [38] |
|
| [39] |
|
| [40] |
|
| [41] |
|
| [42] |
|
| [43] |
|
| [44] |
|
| [45] |
|
| [46] |
|
| [47] |
|
| [48] |
|
| [49] |
|
| [50] |
|
| [51] |
|
| [52] |
|
| [53] |
|
| [54] |
|
| [55] |
|
| [56] |
|
| [57] |
|
| [58] |
|
| [59] |
|
| [60] |
|
| [61] |
|
| [62] |
|
| [63] |
|
| [64] |
|
| [65] |
|
| [66] |
|
| [67] |
|
| [68] |
|
| [69] |
|
| [70] |
|
| [71] |
|
/
| 〈 |
|
〉 |
