
Assessment of rehabilitation strategies for lakes affected by anthropogenic and climatic changes: A case study of the Urmia Lake, Iran
Received date: 2024-01-28
Revised date: 2024-05-02
Accepted date: 2024-05-16
Online published: 2025-08-13
Seyed Morteza MOUSAVI , Hossein BABAZADEH , Mahdi SARAI-TABRIZI , Amir KHOSROJERDI . [J]. Journal of Arid Land, 2024 , 16(6) : 752 -767 . DOI: 10.1007/s40333-024-0019-x
Over the last three decades, more than half of the world's large lakes and wetlands have experienced significant shrinkage, primarily due to climate change and extensive water consumption for agriculture and other human needs. The desiccation of lakes leads to severe environmental, economic, and social repercussions. Urmia Lake, located in northwestern Iran and representing a vital natural ecosystem, has experienced a volume reduction of over 90.0%. Our research evaluated diverse water management strategies within the Urmia Lake basin and prospects of inter-basin water transfers. This study focused on strategies to safeguard the environmental water rights of the Urmia Lake by utilizing the modeling and simulating (MODSIM) model. The model simulated changes in the lake's water volume under various scenarios. These included diverting water from incoming rivers, cutting agricultural water use by 40.0%, releasing dam water in non-agricultural seasons, treated wastewater utilization, and inter-basin transfers. Analytical hierarchy process (AHP) was utilized to analyze the simulation results. Expert opinions with AHP analysis, acted as a multi-criteria decision-making tool to evaluate the simulation and determine the optimal water supply source priority for the Urmia Lake. Our findings underscore the critical importance of reducing agricultural water consumption as the foremost step in preserving the lake. Following this, inter-basin water transfers are suggested, with a detailed consideration of the inherent challenges and limitations faced by the source watersheds. It is imperative to conduct assessments on the impacts of these transfers on the downstream users and the potential environmental risks, advocating for a diplomatic and cooperative approach with adjacent country. This study also aims to forecast the volumes of water that can be transferred under different climatic conditions—drought, normal, and wet years—to inform strategic water management planning for the Urmia Lake. According to our projection, implementing the strategic scenarios outlined could significantly augment the lake's level and volume, potentially by 3.57×10⁹-9.38×10⁹ m3 over the coming 10 a and 3.57×10⁹-10.70×10⁹ m3 in the subsequent 15 a.
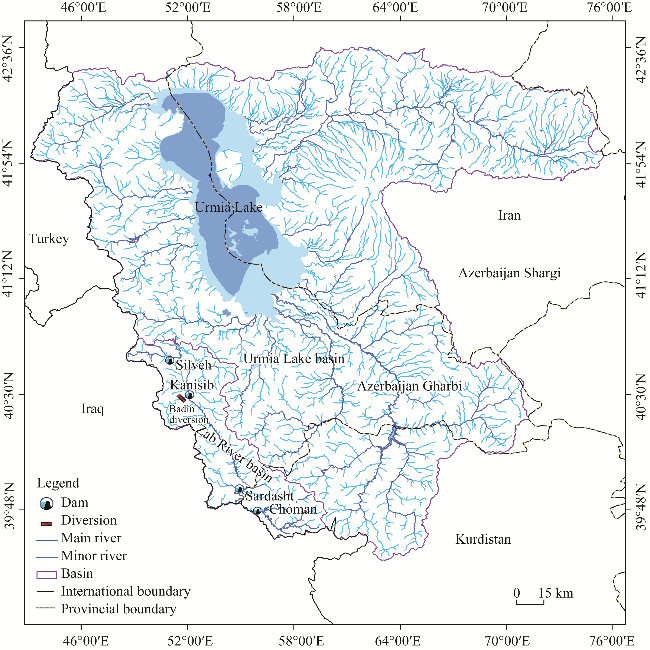
Fig. 1 Geographical overview of the Urmia Lake basin and Zab River basin |
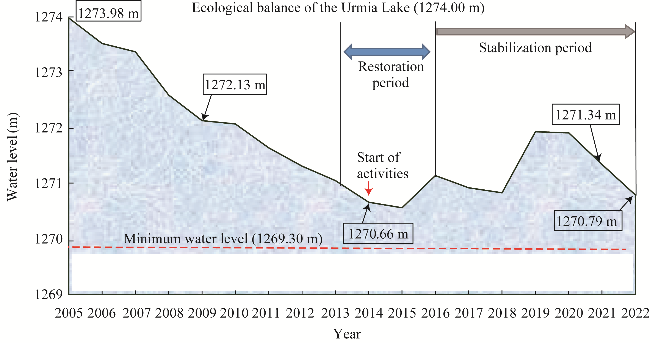
Fig. 2 Water levels in the Urmia Lake during 2005-2022 |
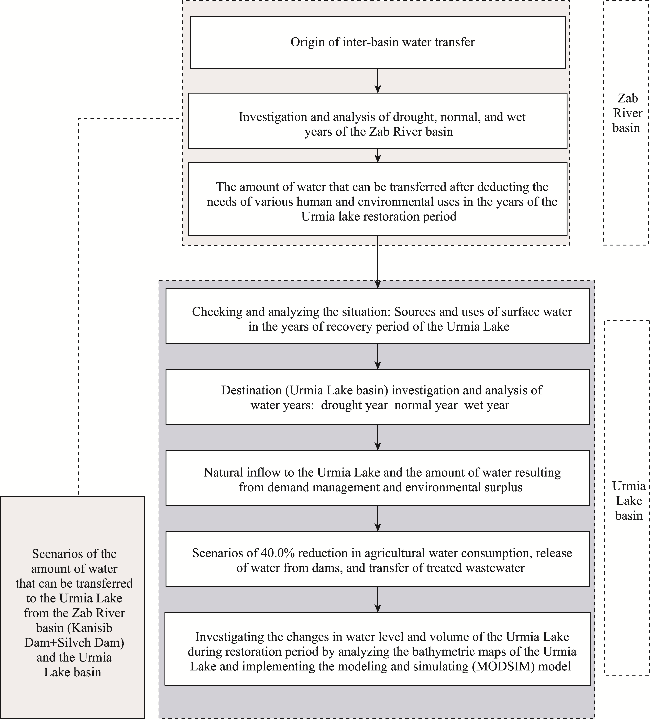
Fig. 3 Flowchart illustrating the process of this study |
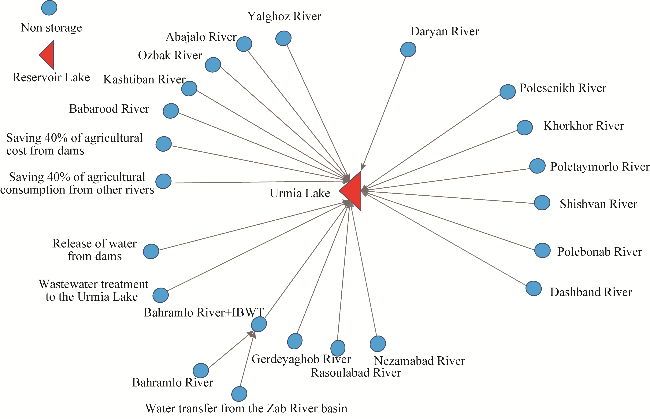
Fig. 4 Schematic diagram of the modeling and simulating (MODSIM) model. IBWT, inter-basin water transfer. |
Table 1 Water conservation and management scenarios for the Urmia Lake |
| Number | Description of options |
|---|---|
| 1 | Conservation from currently operating dams+saving from other rivers+release from currently operating dams in non-cultivation months+treated wastewater transfer+annual river input ending in the lake amounting to 10.86×10⁸ m3 in severe drought years. |
| 2 | Conservation from currently operating dams+saving from other rivers+release from currently operating dams in non-cultivation months+treated wastewater transfer+water transfer from the Zab River basin+annual river input ending in the lake amounting to 10.86×10⁸ m3 in severe drought years. |
| 3 | Conservation from currently operating dams+saving from other rivers+release from currently operating dams in non-cultivation months+treated wastewater transfer+annual river input ending in the lake amounting to 14.60×10⁸ m3 in moderate drought years. |
| 4 | Conservation from currently operating dams+saving from other rivers+release from currently operating dams in non-cultivation months+treated wastewater transfer+water transfer from the Zab River basin+annual river input ending in the lake amounting to 14.60×10⁸ m3 in moderate drought years. |
| 5 | Conservation from currently operating dams+saving from other rivers+release from currently operating dams in non-cultivation months+treated wastewater transfer+annual river input ending in the lake amounting to 18.62×10⁸ m3 in mild drought years. |
| 6 | Conservation from currently operating dams+saving from other rivers+release from currently operating dams in non-cultivation months+treated wastewater transfer+water transfer from the Zab River basin+annual river input ending in the lake amounting for 18.62×10⁸ m3 in mild drought years. |
| 7 | Savings from stopping irrigated agricultural cultivation in the irrigation network of operating dams (4.52×10⁸ m3 average irrigated cultivation consumption from dams over the last 8 a)+savings from stopping irrigated agriculture supplied by other rivers (8.28×10⁸ m3 according to the third round of survey)+water release from dams in non-cultivation months (3.00×10⁸ m3)+treated wastewater transfer (2.07×10⁸ m3)+water transfer from the Zab River basin (6.00×10⁸ m3)+annual river input ending in the lake (10.86×10⁸ m3 in severe drought years). |
| 8 | Savings from stopping irrigated agricultural cultivation in the irrigation network of operating dams (4.52×10⁸ m3 average irrigated cultivation consumption from dams over the last 8 a)+savings from stopping irrigated agriculture supplied by other rivers (8.28×10⁸ m3 according to the third round of survey)+water release from dams in non-cultivation months (3.00×10⁸ m3)+treated wastewater transfer (2.07×10⁸ m3)+water transfer from the Zab River basin (6.00×10⁸ m3)+annual river input ending in the lake (14.60×10⁸ m3 in moderate drought years). |
| 9 | Savings from stopping irrigated agricultural cultivation in the irrigation network of operating dams (4.52×10⁸ m3 average irrigated cultivation consumption from dams over the last 8 a)+savings from stopping irrigated agriculture supplied by other rivers (8.28×10⁸ m3 according to the third round of survey)+water release from dams in non-cultivation months (3.00×10⁸ m3)+treated wastewater transfer (2.07×10⁸ m3)+water transfer from the Zab River basin (6.00×10⁸ m3)+annual river input ending in the lake (18.62×10⁸ m3 in mild drought years). |
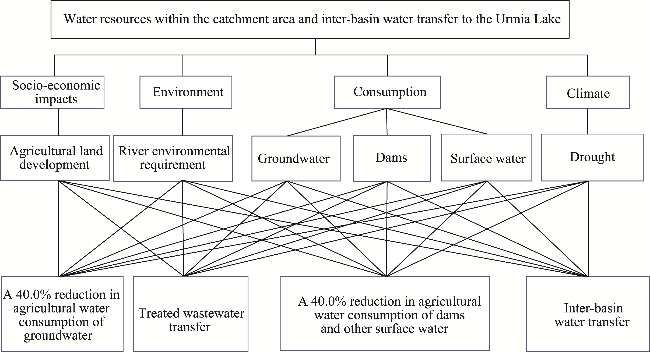
Fig. 5 Conceptual model illustrating the impact of reduced consumption and inter-basin water transfer with environmental goals to the Urmia Lake |
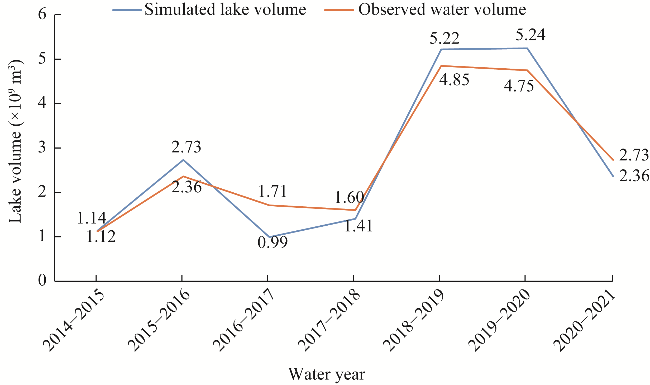
Fig. 6 Comparative analysis of simulated and observed lake volumes using MODSIM model from 2014-2015 to 2020-2021 water year |
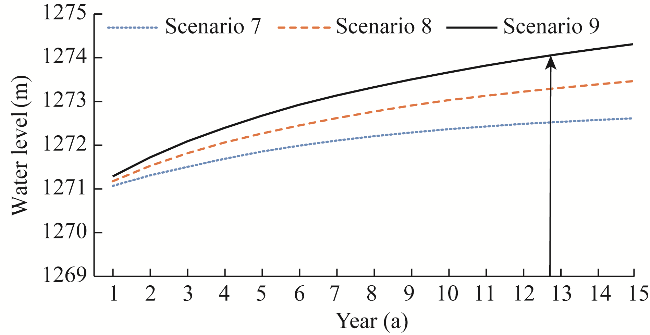
Fig. 7 Impact on water levels of the Urmia Lake from implementing Scenarios 7, 8, and 9 |
Table 2 Effectiveness of scenarios in MODSIM model on enhancing volume of the Urmia Lake |
| Effectiveness on volume of lake water in 15 a period (×109 m3) | Equivalent water level of the Urmia Lake (m) | Effectiveness on volume of lake water in 10 a period (×109 m3) | Equivalent level of the Urmia Lake (m) | Scenario number |
|---|---|---|---|---|
| 3.57 | 1270.92 | 3.57 | 1270.92 | 1 |
| 5.00 | 1271.35 | 4.77 | 1271.27 | 2 |
| 4.80 | 1271.29 | 4.65 | 1271.24 | 3 |
| 8.00 | 1272.21 | 7.40 | 1272.03 | 4 |
| 6.75 | 1271.86 | 5.97 | 1271.63 | 5 |
| 10.70 | 1272.94 | 9.38 | 1272.59 | 6 |
| 9.50 | 1272.60 | 8.57 | 1272.40 | 7 |
| 12.85 | 1273.50 | 11.00 | 1273.00 | 8 |
| 16.45 | 1274.30 | 13.70 | 1273.70 | 9 |
Table 3 Surface water flow exiting Iran via the Zab River basin without inter-basin water transfer |
| Surface flow output from the Zab River basin (×109 m3) | Year |
|---|---|
| 17.48 | Normal |
| 42.93 | Wet |
| 7.69 | Drought |
Table 4 Volume of inter-basin water transfer from the Zab River basin to the Urmia Lake |
| Inter-basin water transfer from the Zab River basin to the Urmia Lake )×108 m3( | Condition |
|---|---|
| 6.00 | Scenario of IBWT from the Kanisib+Silveh dams (short term) |
| 5.28 | Scenario of IBWT from the Kanisib+Silveh dams (long term) |
| 7.43 | Scenario of IBWT from the Kanisib+Silveh+Sardasht dams (long term) |
| 8.34 | Scenario of IBWT from the Kanisib+Silveh+Sardasht+Choman dams (long term) |
Note: IBWT, inter-basin water transfer. |
Table 5 Outflow from the Zab River basin under various scenarios |
| Outflow from the Zab River basin | Scenario | |||||
|---|---|---|---|---|---|---|
| Percent (%) | Drought year (×108 m3) | Percent (%) | Wet year (×108 m3) | Percent (%) | Normal year )×108 m3) | |
| -78.0 | 1.69 | -14.0 | 36.93 | -34.0 | 11.48 | Scenario of IBWT from the Kanisib+Silveh dams (short term) |
| -69.0 | 2.41 | -12.0 | 37.65 | -30.0 | 12.20 | Scenario of IBWT from the Kanisib+Silveh dams (long term) |
| -97.0 | 0.26 | -17.0 | 35.50 | -42.0 | 10.05 | Scenario of IBWT from the Kanisib+Silveh+Sardasht dams (long term) |
| 0.0 | -0.65 | -19.0 | 34.59 | -48.0 | 9.14 | Scenario of IBWT from Kanisib+Silveh+ Sardasht+Choman dams (long term) |
Table 6 Prioritization of main criteria based on importance |
| Weighted value (%) | Criteria | Rank |
|---|---|---|
| 47.9 | Socio-economic impact | 1 |
| 25.0 | Climate | 2 |
| 15.1 | Consumption | 3 |
| 12.1 | Environment | 4 |
Table 7 Ranking of options based on weighted value |
| Rank | Weighted value (%) | Option | Number |
|---|---|---|---|
| 3 | 15.5 | Inter-basin water transfer | 1 |
| 1 | 51.9 | A 40.0% reduction in agricultural water consumption of dams and other surface water | 2 |
| 4 | 6.5 | Treated wastewater transfer | 3 |
| 2 | 26.1 | A 40.0% reduction in agricultural water consumption of groundwater | 4 |
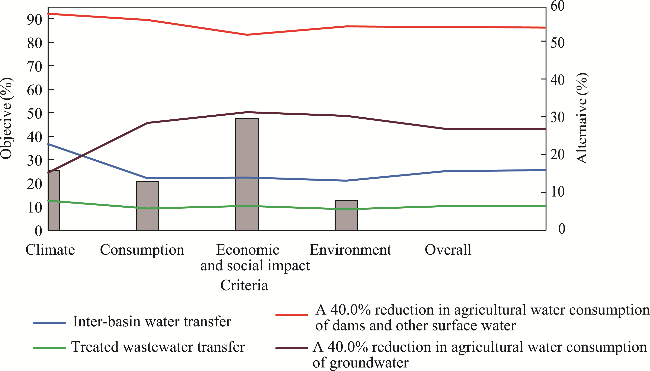
Fig. 8 Outcome of model sensitivity analysis |
| [1] |
|
| [2] |
|
| [3] |
|
| [4] |
|
| [5] |
|
| [6] |
|
| [7] |
|
| [8] |
|
| [9] |
|
| [10] |
|
| [11] |
|
| [12] |
|
| [13] |
|
| [14] |
|
| [15] |
|
| [16] |
|
| [17] |
|
| [18] |
|
| [19] |
|
| [20] |
|
| [21] |
|
| [22] |
|
| [23] |
Urmia Lake Rehabilitation Program. 2014. Report on Continuation of the Current Situation of the Lake Urmia. Tehran: Sharif University of Technology. (in Persian)
|
| [24] |
|
| [25] |
|
| [26] |
|
| [27] |
|
/
| 〈 |
|
〉 |