
Predicting changes in the suitable habitats of six halophytic plant species in the arid areas of Northwest China
The first, second, and third authors contributed equally to this work.
Received date: 2024-03-18
Revised date: 2024-07-07
Accepted date: 2024-07-23
Online published: 2025-08-13
YANG Ao , TU Wenqin , YIN Benfeng , ZHANG Shujun , ZHANG Xinyu , ZHANG Qing , HUANG Yunjie , HAN Zhili , YANG Ziyue , ZHOU Xiaobing , ZHUANG Weiwei , ZHANG Yuanming . [J]. Journal of Arid Land, 2024 , 16(10) : 1380 -1408 . DOI: 10.1007/s40333-024-0062-7
In the context of changes in global climate and land uses, biodiversity patterns and plant species distributions have been significantly affected. Soil salinization is a growing problem, particularly in the arid areas of Northwest China. Halophytes are ideal for restoring soil salinization because of their adaptability to salt stress. In this study, we collected the current and future bioclimatic data released by the WorldClim database, along with soil data from the Harmonized World Soil Database (v1.2) and A Big Earth Data Platform for Three Poles. Using the maximum entropy (MaxEnt) model, the potential suitable habitats of six halophytic plant species (Halostachys caspica (Bieb.) C. A. Mey., Halogeton glomeratus (Bieb.) C. A. Mey., Kalidium foliatum (Pall.) Moq., Halocnemum strobilaceum (Pall.) Bieb., Salicornia europaea L., and Suaeda salsa (L.) Pall.) were assessed under the current climate conditions (average for 1970-2000) and future (2050s, 2070s, and 2090s) climate scenarios (SSP245 and SSP585, where SSP is the Shared Socio-economic Pathway). The results revealed that all six halophytic plant species exhibited the area under the receiver operating characteristic curve values higher than 0.80 based on the MaxEnt model, indicating the excellent performance of the MaxEnt model. The suitability of the six halophytic plant species significantly varied across regions in the arid areas of Northwest China. Under different future climate change scenarios, the suitable habitat areas for the six halophytic plant species are expected to increase or decrease to varying degrees. As global warming progresses, the suitable habitat areas of K. foliatum, S. salsa, and H. strobilaceum exhibited an increasing trend. In contrast, the suitable habitat areas of H. glomeratus, S. europaea, and H. caspica showed an opposite trend. Furthermore, considering the ongoing global warming trend, the centroids of the suitable habitat areas for various halophytic plant species would migrate to different degrees, and four halophytic plant species, namely, S. salsa, H. strobilaceum, H. glomeratus, and H. capsica, would migrate to higher latitudes. Temperature, precipitation, and soil factors affected the possible distribution ranges of these six halophytic plant species. Among them, precipitation seasonality (coefficient of variation), precipitation of the warmest quarter, mean temperature of the warmest quarter, and exchangeable Na+ significantly affected the distribution of halophytic plant species. Our findings are critical to comprehending and predicting the impact of climate change on ecosystems. The findings of this study hold significant theoretical and practical implications for the management of soil salinization and for the utilization, protection, and management of halophytes in the arid areas of Northwest China.
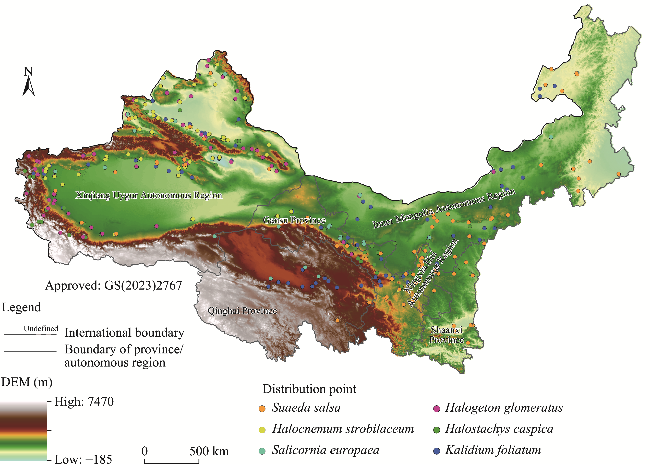
Fig. 1 Overview of the study area based on the digital elevation model (DEM) and distribution points of six halophytic plant species (Halostachys caspica (Bieb.) C. A. Mey., Halogeton glomeratus (Bieb.) C. A. Mey., Kalidium foliatum (Pall.) Moq., Halocnemum strobilaceum (Pall.) Bieb., Salicornia europaea L., and Suaeda salsa (L.) Pall.) in the arid areas of Northwest China. The DEM data were obtained from the Hydrological data and maps based on SHuttle Elevation Derivatives at multiple Scales (HydroSHEDS; https://hydrosheds.org/downloads). Note that the figure is based on the standard map (GS(2023)2767) of the Map Service System (http://bzdt.ch.mnr.gov.cn/) marked by the Ministry of Natural Resources of the People's Republic of China, and the boundary of the standard map has not been modified. |
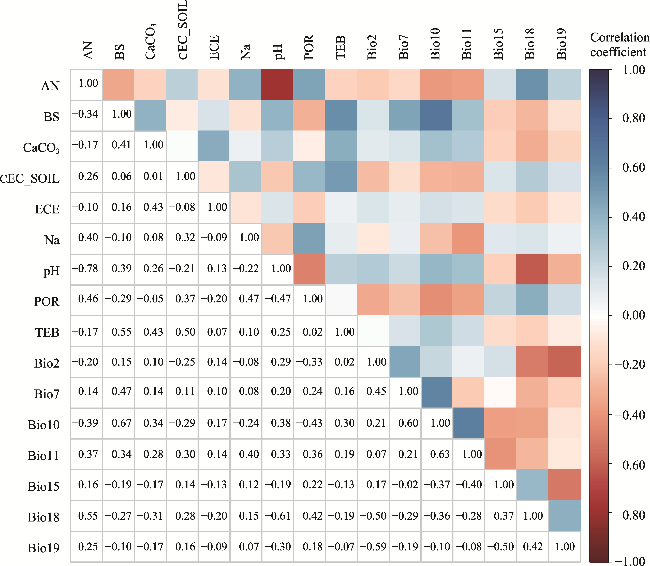
Fig. 2 Pearson's correlation analysis of the 16 selected environmental variables. AN, available nitrogen; BS, soil base saturation; CaCO3, soil calcium carbonate; CEC_SOIL, cation exchange capacity; ECE, electrical conductivity; Na, exchangeable Na+; pH, acidity and basicity; POR, porosity; TEB, soil exchangeable base; Bio2, mean diurnal range; Bio7, temperature annual range; Bio10, mean temperature of the warmest quarter; Bio11, mean temperature of the coldest quarter; Bio15, precipitation seasonality (coefficient of variation); Bio18, precipitation of the warmest quarter; Bio19, precipitation of the coldest quarter. |
Table 1 Area under the receiver operating characteristic curve (AUC) values of six halophytic plant species under the current climate conditions and future climate scenarios based on the maximum entropy (MaxEnt) model |
| Species | AUC | ||||||
|---|---|---|---|---|---|---|---|
| 1970-2000 | SSP245 | SSP585 | |||||
| 2050s | 2070s | 2090s | 2050s | 2070s | 2090s | ||
| S. salsa | 0.85±0.05 | 0.85±0.03 | 0.85±0.05 | 0.84±0.07 | 0.83±0.04 | 0.84±0.04 | 0.83±0.04 |
| S. europaea | 0.83±0.05 | 0.83±0.05 | 0.82±0.04 | 0.82±0.03 | 0.80±0.05 | 0.83±0.06 | 0.83±0.04 |
| H. glomeratus | 0.89±0.02 | 0.89±0.02 | 0.89±0.03 | 0.89±0.03 | 0.88±0.02 | 0.89±0.03 | 0.89±0.03 |
| H. strobilaceum | 0.91±0.02 | 0.92±0.03 | 0.94±0.03 | 0.92±0.03 | 0.93±0.03 | 0.93±0.02 | 0.93±0.03 |
| K. foliatum | 0.83±0.01 | 0.85±0.03 | 0.83±0.03 | 0.83±0.03 | 0.83±0.02 | 0.84±0.02 | 0.82±0.02 |
| H. caspica | 0.84±0.02 | 0.86±0.02 | 0.86±0.02 | 0.85±0.02 | 0.86±0.01 | 0.86±0.02 | 0.85±0.02 |
Note: S. salsa, Suaeda salsa (L.) Pall.; S. europaea, Salicornia europaea L.; H. glomeratus, Halogeton glomeratus (Bieb.) C. A. Mey.; H. strobilaceum, Halocnemum strobilaceum (Pall.) Bieb.; K. foliatum, Kalidium foliatum (Pall.) Moq.; H. caspica, Halostachys caspica (Bieb.) C. A. Mey. SSP, Shared Socio-economic Pathway. Mean±SD. |
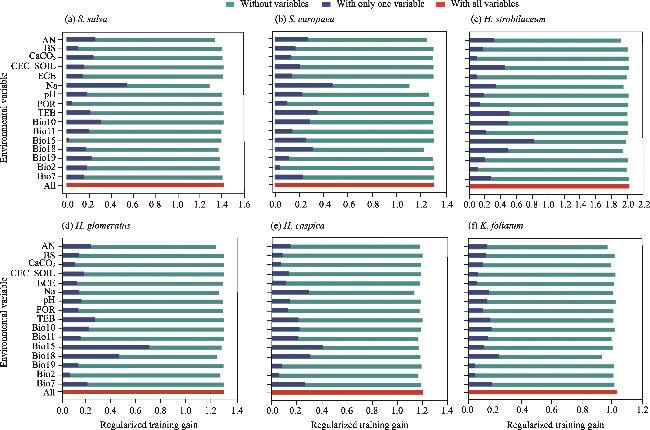
Fig. 3 Contribution rates of the selected 16 environmental variables to the distribution of six halophytic plant species based on the Jackknife test. (a), S. salsa; (b), S. europaea; (c), H. strobilaceum; (d), H. glomeratus; (e), H. capsica; (f), K. foliatum. |
Fig. 4 Predicted current distribution ranges and changes in the centroid distribution of six halophytic plant species in the future (2050s, 2070s, and 2090s) under two climate scenarios (SSP245 and SSP585) in the arid areas of Northwest China. (a), S. salsa; (b), S. europaea; (c), H. strobilaceum; (d), H. glomeratus; (e), H. capsica; (f), K. foliatum. SSP, Shared Socio-economic Pathway. Note that the figures are based on the standard map (GS(2023)2767) of the Map Service System (http://bzdt.ch.mnr.gov.cn/) marked by the Ministry of Natural Resources of the People's Republic of China, and the boundary of the standard map has not been modified. |
Table 2 Change rates of the suitable habitat area for the six halophytic plant species in the future (2050s, 2070s, and 2090s) under two climate scenarios (SSP245 and SSP585) compared to the current conditions |
| Species | Change rate of the suitable habitat area (%) | |||||
|---|---|---|---|---|---|---|
| SSP245 | SSP585 | |||||
| 2050s | 2070s | 2090s | 2050s | 2070s | 2090s | |
| S. salsa | -0.85 | 8.63 | 11.95 | 16.11 | 6.73 | 6.90 |
| S. europaea | -9.00 | 0.54 | 0.43 | -9.18 | -2.21 | 1.79 |
| H. strobilaceum | -10.72 | 4.16 | -4.01 | 6.20 | 5.57 | 6.67 |
| H. glomeratus | -12.53 | -10.56 | -13.95 | -12.89 | -15.30 | -4.61 |
| H. caspica | 2.56 | -1.29 | -3.82 | 2.87 | -4.66 | 2.94 |
| K. foliatum | 3.35 | 1.40 | 5.95 | 3.60 | 6.27 | 2.14 |
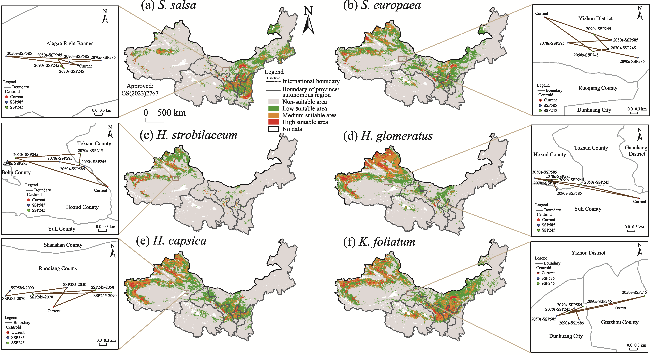
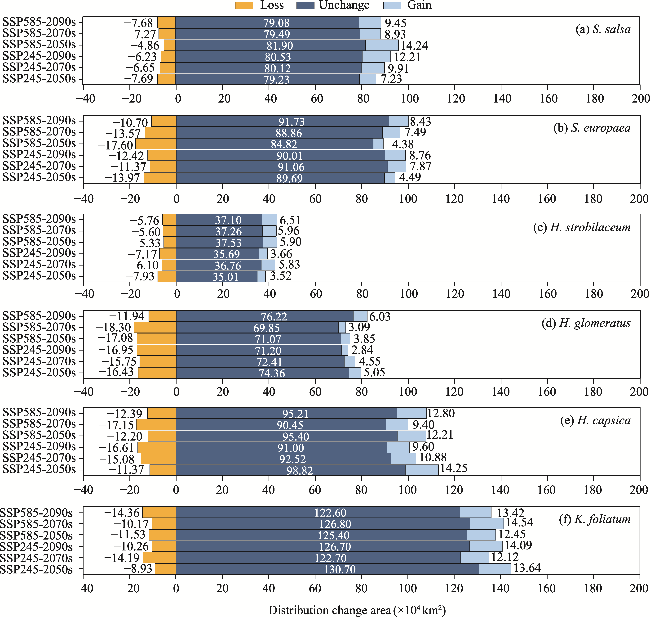
Fig. 5 Distribution change areas of the suitable habitats for the six halophytic plant species in the future (2050s, 2070s, and 2090s) under two climate scenarios (SSP245 and SSP585) compared to the current conditions. (a), S. salsa; (b), S. europaea; (c), H. strobilaceum; (d), H. glomeratus; (e), H. capsica; (f), K. foliatum. |
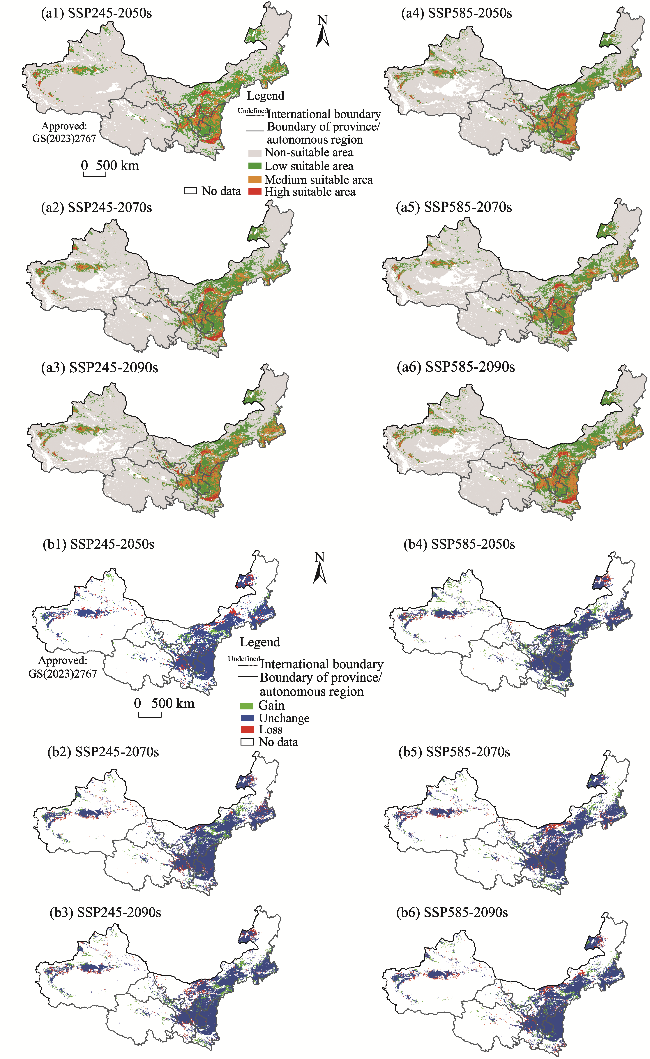
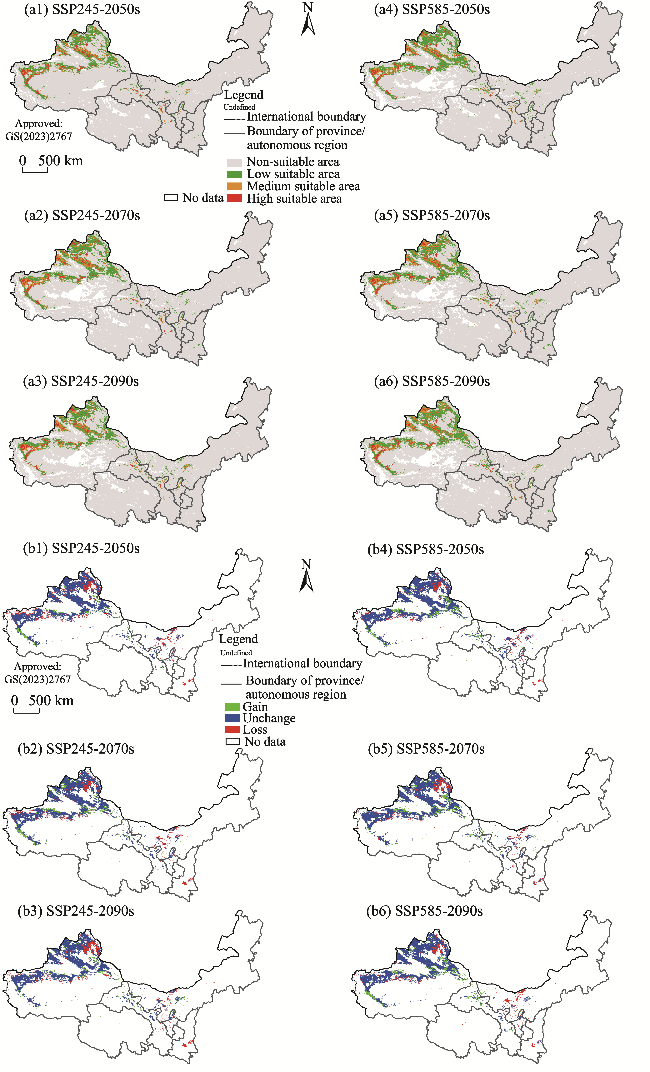
Fig. 6 Potential suitable habitats (a1, a2, a3, a4, a5, and a6) and changes in the distribution ranges (b1, b2, b3, b4, b5, and b6) of S. salsa in the future (2050s, 2070s, and 2090s) under two climate scenarios (SSP245 and SSP585) compared to its current distribution in the arid areas of Northwest China. Note that the figures are based on the standard map (GS(2023)2767) of the Map Service System (http://bzdt.ch.mnr.gov.cn/) marked by the Ministry of Natural Resources of the People's Republic of China, and the boundary of the standard map has not been modified. |
Fig. 7 Potential suitable habitats (a1, a2, a3, a4, a5, and a6) and changes in the distribution range (b1, b2, b3, b4, b5, and b6) of S. europaea in the future (2050s, 2070s, and 2090s) under two climate scenarios (SSP245 and SSP585) compared to its current distribution in the arid areas of Northwest China. Note that the figures are based on the standard map (GS(2023)2767) of the Map Service System (http://bzdt.ch.mnr.gov.cn/) marked by the Ministry of Natural Resources of the People's Republic of China, and the boundary of the standard map has not been modified. |
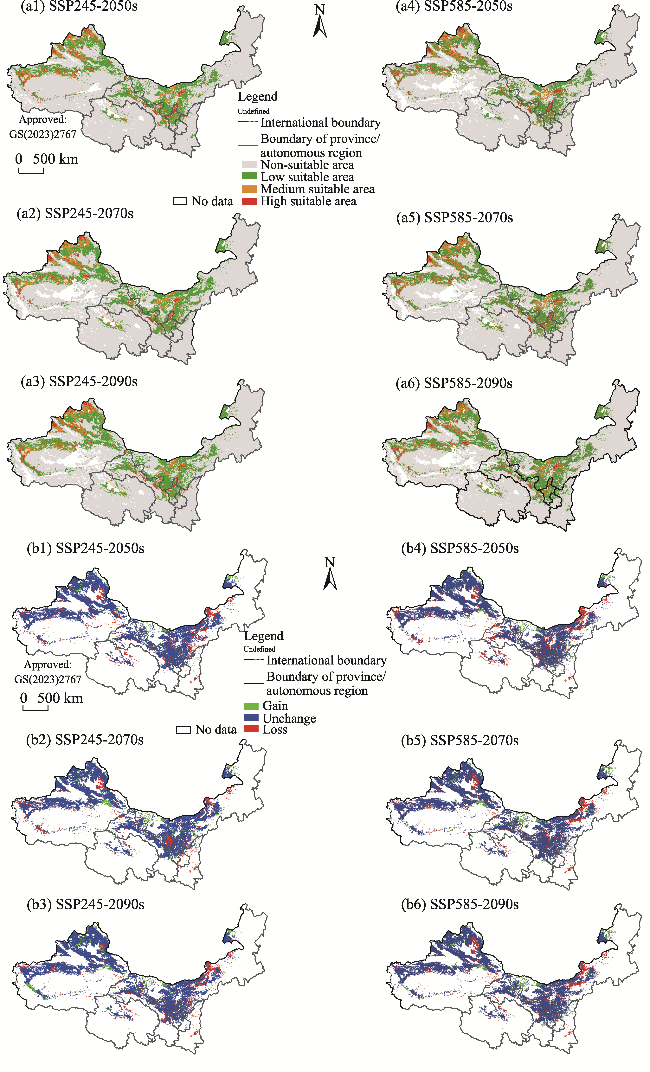
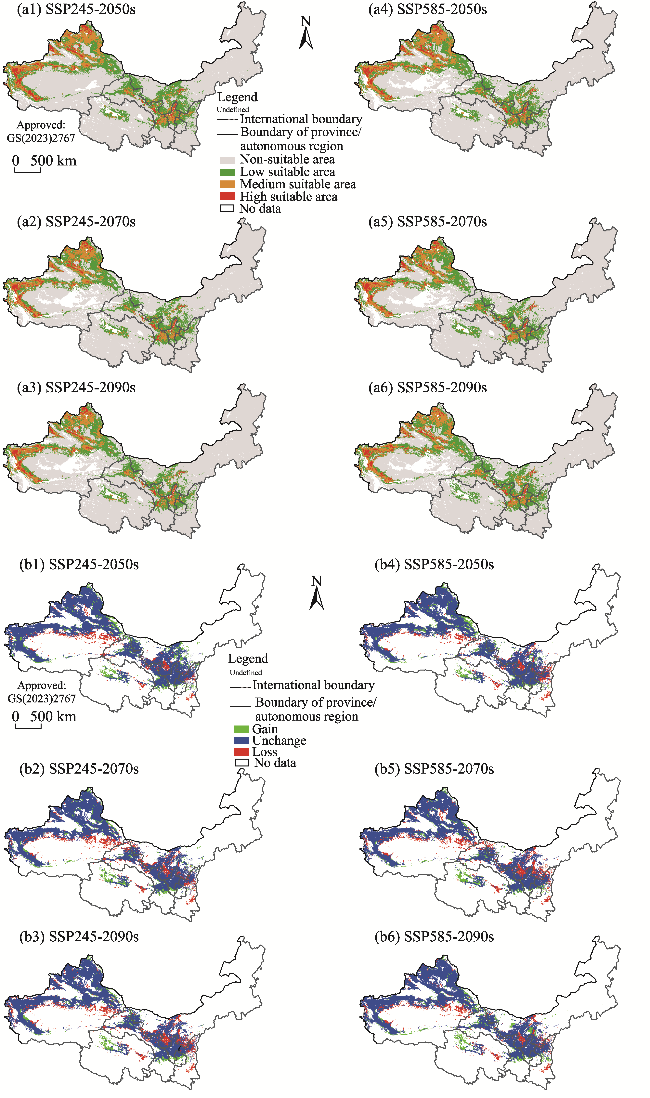
Fig. 8 Potential suitable habitats (a1, a2, a3, a4, a5, and a6) and changes in the distribution range (b1, b2, b3, b4, b5, and b6) of H. glomeratus in the future (2050s, 2070s, and 2090s) under two climate scenarios (SSP245 and SSP585) compared to its current distribution in the arid areas of Northwest China. Note that the figures are based on the standard map (GS(2023)2767) of the Map Service System (http://bzdt.ch.mnr.gov.cn/) marked by the Ministry of Natural Resources of the People's Republic of China, and the boundary of the standard map has not been modified. |
Fig. 9 Potential suitable habitats (a1, a2, a3, a4, a5, and a6) and changes in the distribution range (b1, b2, b3, b4, b5, and b6) of H. strobilaceum in the future (2050s, 2070s, and 2090s) under two climate scenarios (SSP245 and SSP585) compared to its current distribution in the arid areas of Northwest China. Note that the figures are based on the standard map (GS(2023)2767) of the Map Service System (http://bzdt.ch.mnr.gov.cn/) marked by the Ministry of Natural Resources of the People's Republic of China, and the boundary of the standard map has not been modified. |
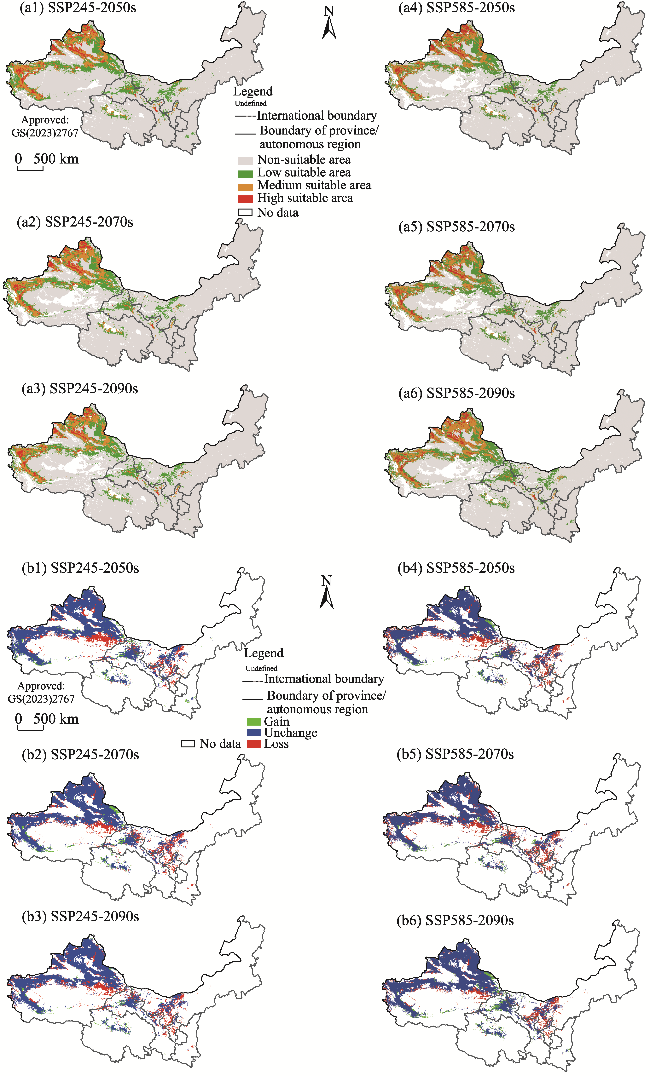
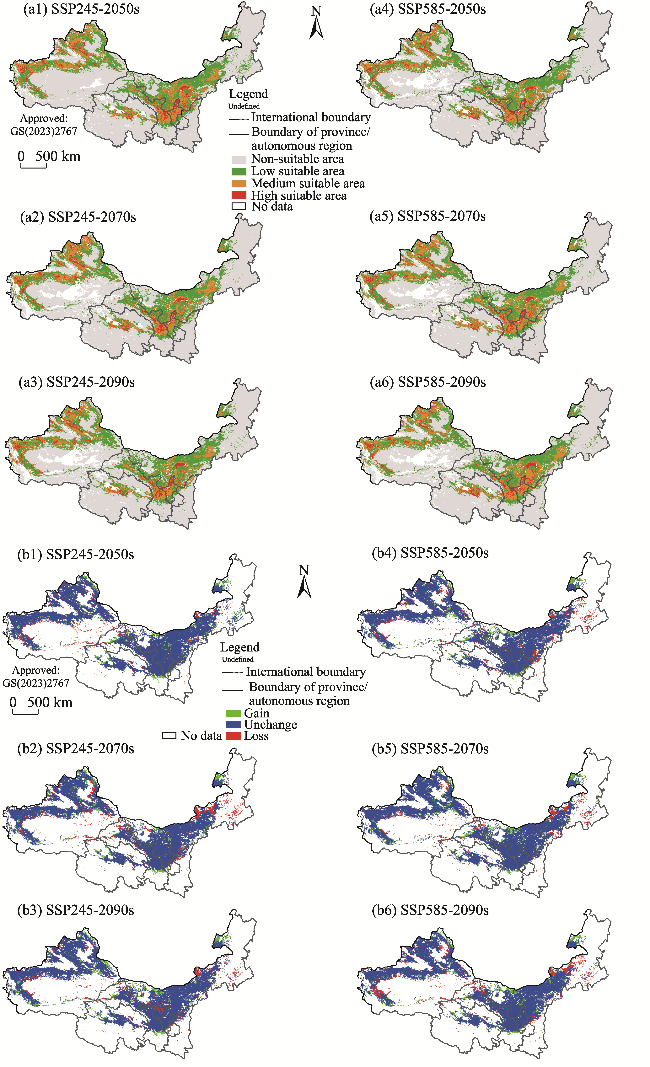
Fig. 10 Potential suitable habitats (a1, a2, a3, a4, a5, and a6) and changes in the distribution range (b1, b2, b3, b4, b5, and b6) of H. caspica in the future (2050s, 2070s, and 2090s) under two climate scenarios (SSP245 and SSP585) compared to its current distribution in the arid areas of Northwest China. Note that the figures are based on the standard map (GS(2023)2767) of the Map Service System (http://bzdt.ch.mnr.gov.cn/) marked by the Ministry of Natural Resources of the People's Republic of China, and the boundary of the standard map has not been modified. |
Fig. 11 Potential suitable habitats (a1, a2, a3, a4, a5, and a6) and changes in the distribution range (b1, b2, b3, b4, b5, and b6) of K. foliatum in the future (2050s, 2070s, and 2090s) under two climate scenarios (SSP245 and SSP585) compared to its current distribution in the arid areas of Northwest China. Note that the figures are based on the standard map (GS(2023)2767) of the Map Service System (http://bzdt.ch.mnr.gov.cn/) marked by the Ministry of Natural Resources of the People's Republic of China, and the boundary of the standard map has not been modified. |
Table S1 Description of the 40 environmental variables in this study |
| Variable | Definition | Unit | Variable | Definition | Unit |
|---|---|---|---|---|---|
| Bio1 | Annual mean temperature | °C | Slope | Slope | ° |
| Bio2 | Mean diurnal range | °C | Aspect | Aspect index | ° |
| Bio3 | Isothermality ((Bio2/Bio7)×100) | - | AN | Available nitrogen | mg/kg |
| Bio4 | Temperature seasonality | °C | AP | Available phosphorus | mg/kg |
| Bio5 | Maximum temperature of the warmest month | °C | AK | Available potassium | mg/kg |
| Bio6 | Minimum temperature of the coldest month | °C | BD | Soil bulk density | g/cm3 |
| Bio7 | Temperature annual range | °C | BS | Soil base saturation | % |
| Bio8 | Mean temperature of the wettest quarter | °C | SOM | Soil organic matter | % |
| Bio9 | Mean temperature of the driest quarter | °C | pH | Acidity and basicity | - |
| Bio10 | Mean temperature of the warmest quarter | °C | SOC | Soil organic carbon | % |
| Bio11 | Mean temperature of the coldest quarter | °C | CEC_SOIL | Cation exchange capacity | cmol/kg |
| Bio12 | Annual precipitation | mm | SILT | Silt content | % |
| Bio13 | Precipitation of the wettest month | mm | CLAY | Clay content | % |
| Bio14 | Precipitation of the driest month | mm | SAND | Sand content | % |
| Bio15 | Precipitation seasonality (coefficient of variation) | mm | ECE | Electrical conductivity | dS/m |
| Bio16 | Precipitation of the wettest quarter | mm | TEB | Soil exchangeable base | cmol/kg |
| Bio17 | Precipitation of the driest quarter | mm | ESP | Soil sodicity | % |
| Bio18 | Precipitation of the warmest quarter | mm | POR | Porosity | % |
| Bio19 | Precipitation of the coldest quarter | mm | Na | Exchangeable Na+ | cmol/kg |
| DEM | Altitude | m | CACO3 | Soil calcium carbonate | % |
Note: - indicates dimensionless. |
Table S2 Contribution rates of the selected 16 environmental variables to the distribution of six halophytic plant species based on the maximum entropy (MaxEnt) model |
| Variable | Contribution rate (%) | ||||||
|---|---|---|---|---|---|---|---|
| S. salsa | S. europaea | H. glomeratus | H. strobilaceum | K. foliatum | H. caspica | Average | |
| Na | 31.40 | 28.40 | 5.00 | 4.60 | 9.70 | 14.50 | 11.68 |
| AN | 7.80 | 5.30 | 6.90 | 8.80 | 4.50 | 3.00 | 6.87 |
| pH | 7.40 | 10.50 | 1.60 | 0.30 | 6.20 | 4.20 | 3.33 |
| BS | 2.50 | 10.00 | 2.90 | 3.40 | 10.10 | 0.50 | 3.72 |
| TEB | 2.40 | 2.30 | 3.80 | 6.70 | 2.60 | 1.90 | 4.02 |
| POR | 0.90 | 0.10 | 0.90 | 0.60 | 3.10 | 2.90 | 1.53 |
| ECE | 0.90 | 0.80 | 3.40 | 2.40 | 2.40 | 9.10 | 3.47 |
| CaCO3 | 6.10 | 1.90 | 2.00 | 2.50 | 5.30 | 1.10 | 3.38 |
| CEC_SOIL | 3.20 | 7.80 | 5.60 | 11.50 | 5.90 | 4.20 | 6.08 |
| Bio2 | 3.20 | 0.30 | 2.60 | 1.80 | 5.70 | 5.90 | 3.43 |
| Bio7 | 3.70 | 3.10 | 1.50 | 4.00 | 1.70 | 8.80 | 3.72 |
| Bio10 | 6.80 | 5.10 | 0.20 | 5.50 | 9.90 | 1.00 | 4.90 |
| Bio11 | 3.60 | 2.30 | 0.60 | 1.10 | 5.80 | 5.10 | 2.83 |
| Bio15 | 1.70 | 9.40 | 44.00 | 32.00 | 2.00 | 23.40 | 23.15 |
| Bio18 | 8.80 | 10.40 | 17.40 | 11.10 | 19.60 | 10.70 | 13.20 |
| Bio19 | 9.70 | 2.10 | 1.60 | 3.50 | 5.40 | 3.70 | 4.62 |
Table S3 Suitable habitat ranges of the selected 16 environmental variables for the six halophytic plant species based on the retention of environmental factor response curves |
| Variable | S. salsa | S. europaea | H. glomeratus |
|---|---|---|---|
| Na (cmol/kg) | 0.11-0.17 | 0.11-0.17 | 0.10-0.18 |
| AN (mg/kg) | 94.43-95.10 | 39.77-103.10 | 41.11-109.77 |
| pH | 8.03-8.45 | 8.12-8.49 | 8.24-9.82 |
| BS (%) | 99.85-100.00 | 99.88-100.00 | 99.80-100.00 |
| TEB (cmol/kg) | 40.81-40.89 | 21.15-68.20 | 1.60-17.96 |
| POR (%) | 43.32-50.14 | 47.69-52.70 | 47.11-52.26 |
| ECE (dS/m) | 30.41-42.80 | 15.30-42.80 | 9.97-42.80 |
| CaCO3 (%) | 4.70-15.53 | 0.62-19.67 | 0.80-29.50 |
| CEC_SOIL (cmol/kg) | 43.48-87.00 | 1.00-2.31 | 1.00-1.79 |
| Bio2 (℃) | 10.10-13.53 | 10.67-14.51 | 10.10-13.64 |
| Bio7 (℃) | 39.07-46.93 | 41.60-48.91 | 41.36-47.72 |
| Bio10 (℃) | 19.40-23.94 | 20.17-25.21 | 20.97-32.56 |
| Bio11 (℃) | -7.96-4.58 | -9.92- -2.17 | -12.42- -0.61 |
| Bio15 (mm) | 82.27-111.27 | 12.07-72.35 | 23.26-70.13 |
| Bio18 (mm) | 86.29-270.86 | 41.66-140.86 | 39.36-95.47 |
| Bio19 (mm) | 3.28-69.00 | 24.21-66.00 | 15.88-62.00 |
| Environmental variable | H. strobilaceum | K. foliatum | H. caspica |
| Na (cmol/kg) | 0.09-0.17 | 0.11-0.17 | 0.12-0.17 |
| AN (mg/kg) | 49.11-107.10 | 31.78-102.43 | 35.11-109.10 |
| pH | 8.07-8.47 | 8.15-8.57 | 8.18-8.60 |
| BS (%) | 90.00-100.00 | 99.80-100.00 | 99.80-100.00 |
| TEB (cmol/kg) | 29.55-68.20 | 19.43-57.30 | 20.27-47.64 |
| POR (%) | 45.99-52.14 | 45.99-52.39 | 47.51-52.84 |
| ECE (dS/m) | 17.20-42.80 | 6.92-42.80 | 28.78-42.80 |
| CaCO3 (%) | 1.51-29.50 | 1.51-18.96 | 1.09-29.50 |
| CEC_SOIL (cmol/kg) | 1.00-1.69 | 35.33-87.00 | 1.00-1.89 |
| Bio2 (℃) | 10.10-13.65 | 10.89-14.24 | 10.52-14.13 |
| Bio7 (℃) | 42.05-49.05 | 40.55-47.22 | 40.88-46.71 |
| Bio10 (℃) | 21.87-30.76 | -10.33- -1.82 | 20.67-25.65 |
| Bio11 (℃) | -6.77-1.14 | -27.48-4.74 | -8.45-1.23 |
| Bio15 (mm) | 23.26-68.34 | 37.17-80.05 | 23.22-76.41 |
| Bio18 (mm) | 30.18-96.70 | 45.98-169.6 | 35.50-116.14 |
| Bio19 (mm) | 3.22-66.00 | 2.64-7.14 | 5.95-63.00 |
| [1] |
|
| [2] |
|
| [3] |
|
| [4] |
|
| [5] |
|
| [6] |
|
| [7] |
|
| [8] |
|
| [9] |
|
| [10] |
|
| [11] |
|
| [12] |
|
| [13] |
|
| [14] |
|
| [15] |
|
| [16] |
|
| [17] |
|
| [18] |
|
| [19] |
|
| [20] |
|
| [21] |
|
| [22] |
|
| [23] |
|
| [24] |
|
| [25] |
|
| [26] |
FAO Food Agriculture Organization. 2012. Harmonized World Soil Database (version 1.2). FAO, Rome, Italy and IIASA, Laxenburg, Austria. [2023-11-20]. http://webarchive.iiasa.ac.at/Research/LUC/External-World-soil-database/HTML/.
|
| [27] |
|
| [28] |
|
| [29] |
|
| [30] |
|
| [31] |
|
| [32] |
|
| [33] |
|
| [34] |
|
| [35] |
|
| [36] |
|
| [37] |
|
| [38] |
|
| [39] |
|
| [40] |
|
| [41] |
|
| [42] |
|
| [43] |
|
| [44] |
|
| [45] |
|
| [46] |
|
| [47] |
|
| [48] |
|
| [49] |
|
| [50] |
IPBES Intergovernmental Science-Policy Platform on Biodiversity and Ecosystem Services. 2019. Global Assessment Report on Biodiversity and Ecosystem Services of the Intergovernmental Science-Policy Platform on Biodiversity and Ecosystem Services. In: Brondizio E S, Settele J, Díaz S, et al. Bonn: IPBES Secretariat, 1-1148.
|
| [51] |
|
| [52] |
|
| [53] |
|
| [54] |
|
| [55] |
|
| [56] |
|
| [57] |
|
| [58] |
|
| [59] |
|
| [60] |
|
| [61] |
|
| [62] |
|
| [63] |
|
| [64] |
|
| [65] |
|
| [66] |
|
| [67] |
|
| [68] |
|
| [69] |
|
| [70] |
|
| [71] |
|
| [72] |
|
| [73] |
|
| [74] |
|
| [75] |
|
| [76] |
|
| [77] |
|
| [78] |
|
| [79] |
|
| [80] |
|
| [81] |
|
| [82] |
|
| [83] |
|
| [84] |
|
| [85] |
|
| [86] |
|
| [87] |
|
| [88] |
|
| [89] |
|
| [90] |
|
| [91] |
|
| [92] |
|
| [93] |
|
| [94] |
|
| [95] |
|
| [96] |
|
| [97] |
|
| [98] |
|
| [99] |
|
| [100] |
|
| [101] |
|
| [102] |
|
| [103] |
|
| [104] |
|
| [105] |
|
| [106] |
|
| [107] |
|
| [108] |
|
| [109] |
|
| [110] |
|
| [111] |
|
| [112] |
|
| [113] |
|
| [114] |
|
| [115] |
|
| [116] |
|
| [117] |
|
| [118] |
|
| [119] |
|
| [120] |
|
| [121] |
|
| [122] |
|
| [123] |
|
| [124] |
|
| [125] |
|
| [126] |
|
| [127] |
|
| [128] |
|
| [129] |
|
| [130] |
|
| [131] |
|
| [132] |
|
| [133] |
|
| [134] |
|
| [135] |
|
| [136] |
|
| [137] |
|
| [138] |
|
| [139] |
|
| [140] |
|
| [141] |
|
| [142] |
|
| [143] |
|
| [144] |
|
| [145] |
|
| [146] |
|
| [147] |
|
| [148] |
|
| [149] |
|
/
| 〈 |
|
〉 |