
Spatial distribution of soil salinization under the influence of human activities in arid areas, China
Received date: 2024-06-02
Revised date: 2024-09-25
Accepted date: 2024-09-30
Online published: 2025-08-13
LIU Yufang , YANG Qingwen , PEI Xiangjun , LI Jingji , WANG Shuangcheng , HUANG Zhenfu , HAN Wei , ZHENG Tianliang . [J]. Journal of Arid Land, 2024 , 16(10) : 1344 -1364 . DOI: 10.1007/s40333-024-0108-x
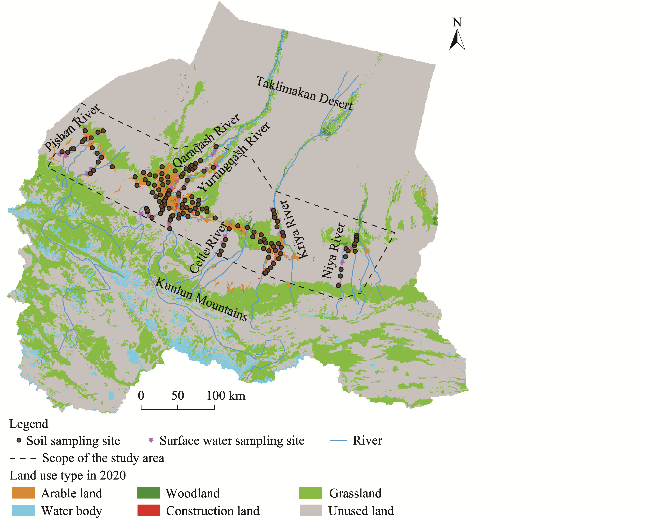
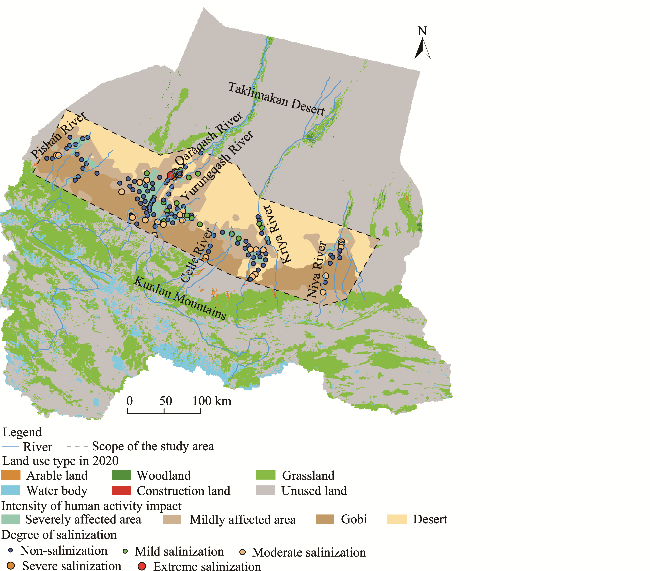
The Hotan Prefecture of Xinjiang Uygur Autonomous Region, China belongs to arid desert climate, with significant soil salinization issues. The study selected six rivers in Hotan Prefecture (Pishan, Qaraqash, Yurungqash, Celle, Kriya, and Niya rivers) to explore the spatial distribution of soil salinization in this area and its underlying mechanisms. Sampling was conducted along each river's watershed, from the Gobi in the upper reaches, through the anthropogenic impact area in the middle reaches, to the desert area in the lower reaches. Soil physical-chemical indicators, including total soluble salts, pH, K+, Na+, Ca2+, Mg2+, SO42-, Cl-, CO32-, HCO3-, organic matter, available nitrogen, available phosphorus, and available potassium, were tested, along with the total dissolved solids of surface water and groundwater. The results revealed that the soil water and nutrient contents in anthropogenic impact area were higher than those in Gobi and desert areas, while the pH and total soluble salts were lower than those in Gobi and desert areas. The ions in the soil of the study area were primarily Cl-, SO42-, K+, and Na+, and the ion concentration of soil salt were positively correlated with surface water and groundwater. Overall, the study area exhibited low soil water content, low clay content, infertile soil, and high soil salinization, dominated by weak to moderate chloride-sulfate types. Compared with Gobi and desert areas, the soil in anthropogenic impact area had higher soil water content, lower pH, lower soluble salts, and higher nutrients, indicating that human farming activities help mitigate salinization. These findings have practical implications for guiding the scientific prevention and control of soil salinization in the arid areas and for promoting sustainable agricultural development.
Fig. 1 Spatial distribution of sampling sites in the study area |
Table 1 Assigned value of each indicator in this study |
| Indicator | Classification | Assigned value |
|---|---|---|
| Land use type | Construction land | 10 |
| Arable land | 7 | |
| Woodland | 5 | |
| Grassland | 3 | |
| Water body | 2 | |
| Unused land | 1 | |
| Population density (persons/km2) | >1200 | 10 |
| 250-1200 | 7 | |
| 70-250 | 5 | |
| 30-70 | 2 | |
| 0-30 | 1 | |
| Nighttime light (nW/(cm2·sr)) | 75.0-160.0 | 10 |
| 40.0-75.0 | 7 | |
| 24.0-40.0 | 5 | |
| 10.0-24.0 | 3 | |
| 4.6-10.0 | 2 | |
| 0.0-4.6 | 1 |
Note: The assigned value to each indicator was referred from Duan and Luo (2021). |
Table 2 Results of hydro-chemical parameters of surface water and groundwater in the study area |
| Type | Statistical indicator | pH | Concentration (mg/L) | |||||||
|---|---|---|---|---|---|---|---|---|---|---|
| TDS | K+ | Na+ | Ca2+ | Mg2+ | Cl- | SO42- | HCO3- | |||
| Groundwater | Min | 7.05 | 654.70 | 10.65 | 91.36 | 11.63 | 24.09 | 137.57 | 13.01 | 58.67 |
| Max | 8.86 | 3338.92 | 59.58 | 698.38 | 192.58 | 275.41 | 1134.63 | 1095.96 | 549.51 | |
| Average | 8.04 | 1270.00 | 21.70 | 265.24 | 78.10 | 66.59 | 374.65 | 310.21 | 310.94 | |
| SD | 0.40 | 662.08 | 9.68 | 159.07 | 33.59 | 45.08 | 257.01 | 225.94 | 110.94 | |
| Surface water | Min | 7.63 | 288.00 | 2.18 | 38.10 | 31.70 | 10.50 | 35.40 | 75.70 | 5.72 |
| Max | 8.80 | 9135.00 | 138.00 | 449.00 | 1957.00 | 336.00 | 4297.00 | 2589.00 | 3097.00 | |
| Average | 8.32 | 1325.36 | 15.70 | 85.50 | 229.00 | 49.00 | 359.00 | 467.00 | 494.00 | |
| SD | 0.29 | 1453.74 | 54.59 | 68.90 | 310.42 | 54.59 | 663.00 | 609.78 | 618.48 | |
Note: TDS, total dissolved solids; Min, minimum value; Max, maximum value; SD, standard deviation. |
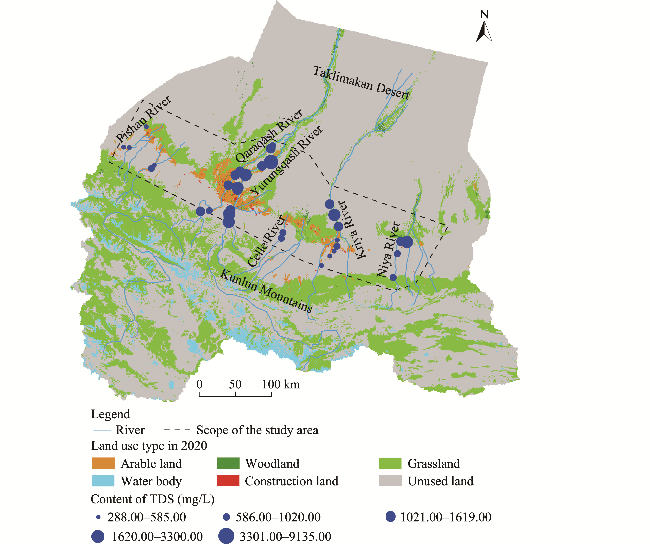
Fig. 2 Spatial distribution of the total dissolved solids (TDS) of surface water in the study area |
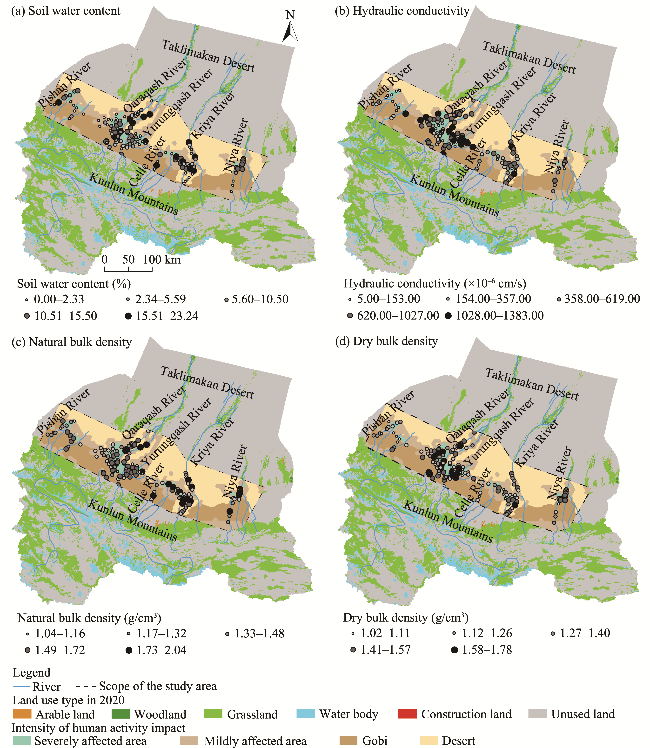
Fig. 3 Spatial distribution of soil physical and chemical property parameters in the study area. (a), soil water content; (b), hydraulic conductivity; (c), natural bulk density; (d), dry bulk density. |
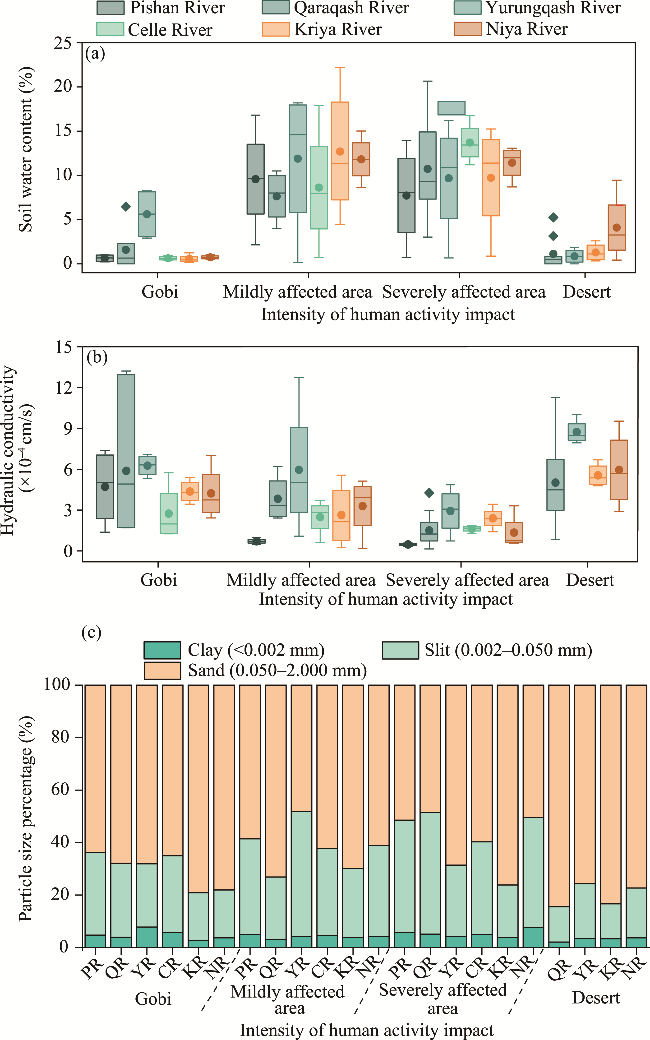
Fig. 4 Change in soil physical and chemical property parameters in typical watersheds of the study area. (a), soil water content; (b), particle size percentage; (c) hydraulic conductivity. The upper and lower limits of the box plots represent the maximum and minimum values, the middle line represents median, the origin represents arithmetic mean, and the diamond-shaped block represents outlier. PR, Pishan River; QR, Qaraqash River; YR, Yurungqash River; CR, Celle River; KR, Kriya River; NR, Niya River. |
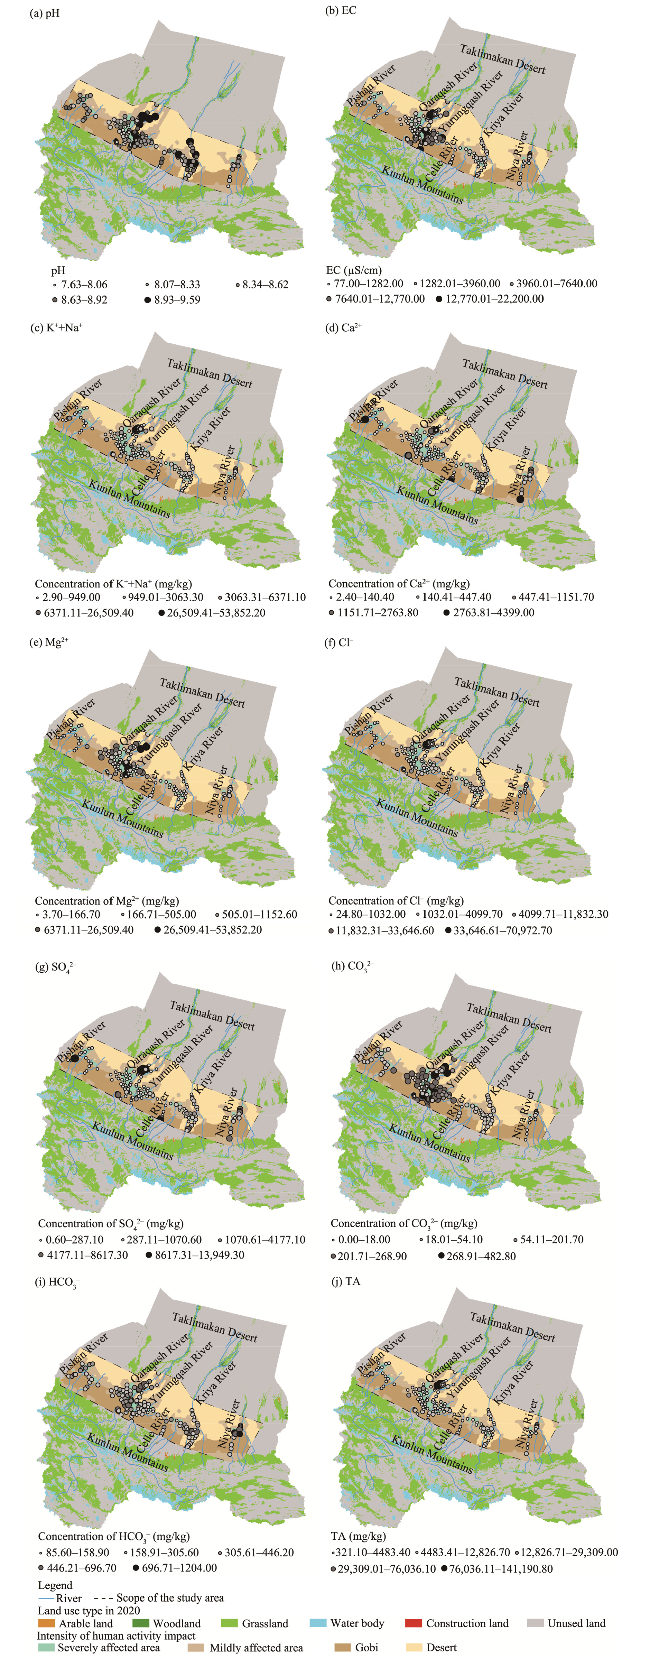
Fig. 5 Spatial distribution of soil soluble salt in the study area. (a), pH; (b), electrical conductivity (EC); (c), K++Na+; (d), Ca2+; (e), Mg2+; (f), Cl-; (g), SO42-; (h), CO32-; (i), HCO3-; (j), total salt content (TA). |
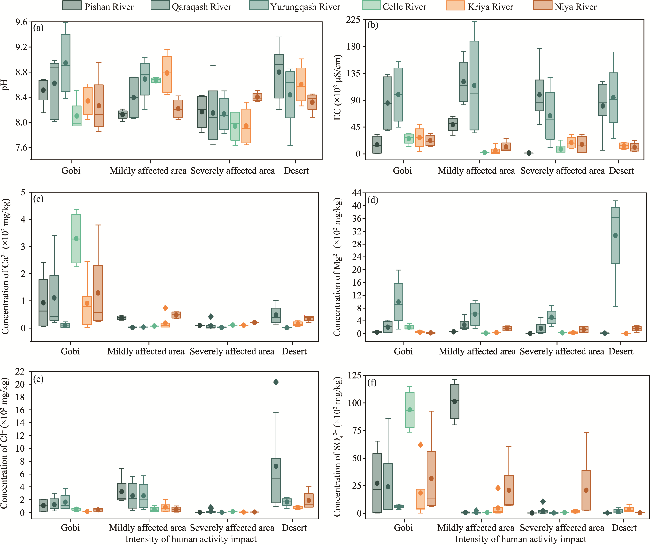
Fig. 6 Variation of soil soluble salt in typical watersheds of the study area. (a), pH; (b), EC; (c), Ca2+; (d), Mg2+; (e), Cl-; (f) SO42-. The upper and lower limits of the box plots represent the maximum and minimum values, the middle line represents median, the origin represents arithmetic mean, and the diamond-shaped block represents outlier. |
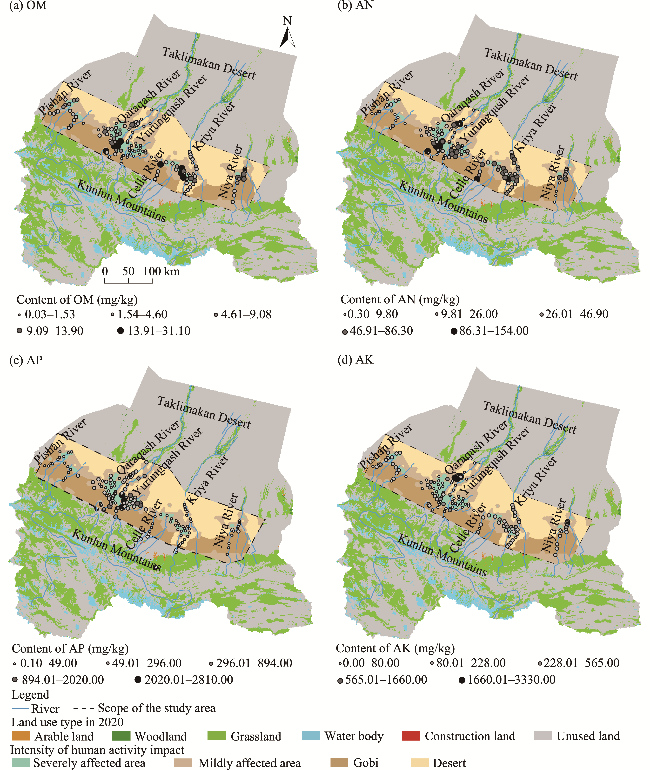
Fig. 7 Spatial distribution of soil nutrient in the study area. (a), organic matter (OM); (b), available nitrogen (AN); (c), available phosphorus (AP); (d), available potassium (AK). |
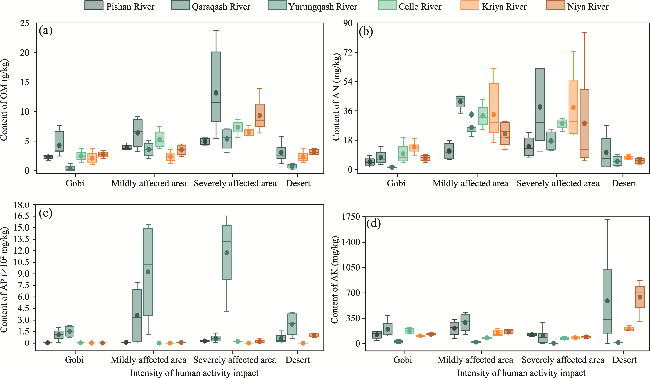
Fig. 8 Variation of soil nutrient in typical watersheds in the study area. (a), OM; (b), AN; (c), AP; (d), AK. The upper and lower limits of the box plots represent the maximum and minimum values, the middle line represents median, the origin represents arithmetic mean, and the diamond-shaped block represents outlier. |
Fig. 9 Spatial distribution of soil salinity in the study area |
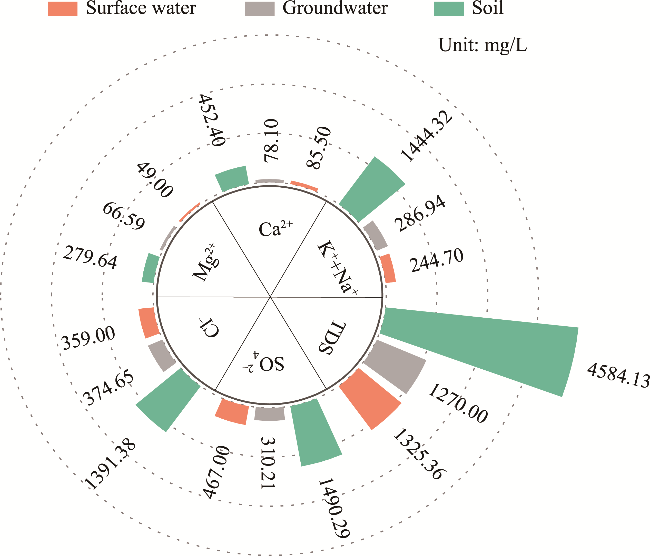
Fig. 10 Ion content of water and soil in the Yurungqash and Qaraqash river basins |
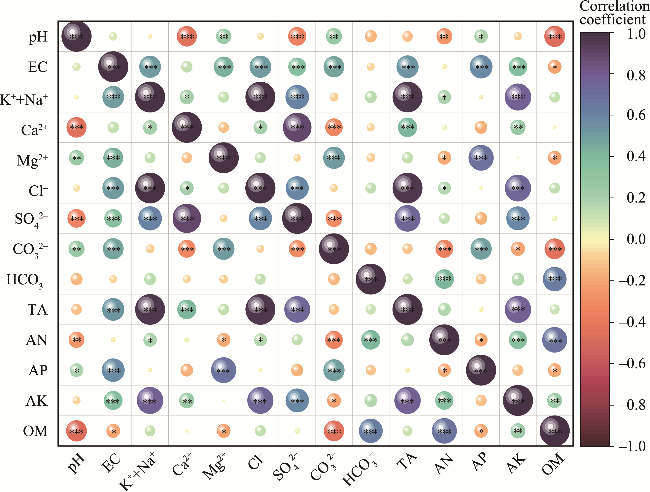
Fig. 11 Pearson correlation matrix of soil salinity and nutrient in the study area. *, P≤0.050; **, P≤0.010; ***, P≤0.001. |
| [1] |
|
| [2] |
|
| [3] |
|
| [4] |
|
| [5] |
|
| [6] |
|
| [7] |
|
| [8] |
|
| [9] |
|
| [10] |
|
| [11] |
|
| [12] |
|
| [13] |
|
| [14] |
|
| [15] |
|
| [16] |
|
| [17] |
|
| [18] |
|
| [19] |
|
| [20] |
|
| [21] |
|
| [22] |
|
| [23] |
Ministry of Ecology and Environment of the People's Republic of China. 2002. Technical Specifications Requirements for Monitoring of Surface Water and Waste Water (HJ/T 91-2002). [2024-01-01]. https://www.mee.gov.cn/ywgz/fgbz/bz/bzwb/jcffbz/200301/t20030101_66890.htm. (in Chinese)
|
| [24] |
Ministry of Housing and Urban-Rural Development of the People's Republic of China. 2009. Code for Investigation of Geotechnical Engineering (GB 50021-2001(2009)).[2024-05-18]. http://www.cday.cn/doc/GB50021-2009.pdf. (in Chinese)
|
| [25] |
National Health Commission of the People's Republic of China. 2006. Standards for Drinking Water Quality (GB5749-2006). [2024-01-26]. http://www.nhc.gov.cn/wjw/pgw/201212/33644.shtml. (in Chinese)
|
| [26] |
|
| [27] |
|
| [28] |
|
| [29] |
|
| [30] |
|
| [31] |
|
| [32] |
|
| [33] |
|
| [34] |
|
| [35] |
|
| [36] |
|
| [37] |
|
| [38] |
|
| [39] |
|
| [40] |
|
| [41] |
|
| [42] |
|
| [43] |
|
| [44] |
|
| [45] |
|
| [46] |
|
| [47] |
|
| [48] |
|
| [49] |
|
| [50] |
|
| [51] |
|
| [52] |
|
| [53] |
|
| [54] |
|
| [55] |
|
| [56] |
|
/
| 〈 |
|
〉 |