
Rock mechanical characteristics and landscape evolutionary mechanism of the slit-type Danxia landform on the Chinese Loess Plateau
Received date: 2024-03-26
Revised date: 2024-08-20
Accepted date: 2024-09-15
Online published: 2025-08-13
MEN Huan , DING Hua , DENG Yahong , MU Huandong , HE Nainan , SUN Pushuo , LI Zhixu , LIU Yan . [J]. Journal of Arid Land, 2024 , 16(10) : 1327 -1343 . DOI: 10.1007/s40333-024-0029-8
Since 2015, the newly discovered slit-type Danxia landform on the Chinese Loess Plateau has become a hot topic in the field of geomorphology worldwide. However, the relationships among its formation, evolutionary mechanism, and mechanical characteristics of its strata and rocks are not clear. In this paper, the Ganquan canyon group is used as the research object. Basic physical and mechanical indices of sandstone in the Ganquan canyon group were measured through field investigation and indoor experiments, and the deterioration trends for the mechanical parameters of sandstone in this area under the action of infiltration, acid dry-wet cycles, and freeze-thaw cycles were revealed. Lastly, the formation and evolutionary mechanism of the slit-type Danxia landform were discussed. The results showed that: (1) The sandstone in the canyon group had a low cementation degree and weak cohesive force, which was easily weakened under the action of water, resulting in a decrease in compressive strength and elastic modulus. (2) Acidic dry-wet cycles caused the mineral composition of the sandstone to be dissolved, and the micropores continued to grow and develop until new cracks were produced. Macroscopically, the compressive strength and elastic modulus of sandstone were greatly reduced, and this damage was cumulative and staged. The greater the acidity, the greater the damage. (3) As the number of freeze-thaw cycles increased, the uniaxial compressive strength and elastic modulus of the sandstone decreased continuously. During the freeze-thaw cycle process, the growth and development of cracks were primarily in fracture mode and usually developed along parallel bedding positions. (4) The interaction of tectonic activity and lithology with different weathering processes was a key factor in the formation and evolution of the slit-type Danxia landform. In conclusion, the intricate process of weathering influenced by historical climatic fluctuations has been pivotal in shaping the topography of Danxia landform.
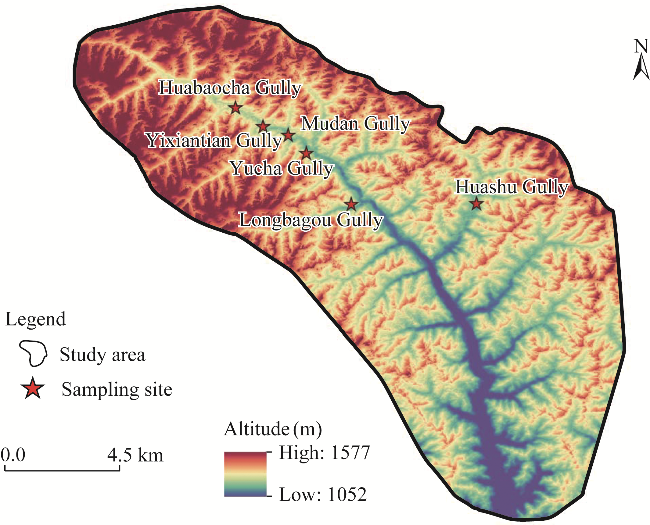
Fig. 1 Sampling sites of the Ganquan canyon group, Shaanxi Province, China |
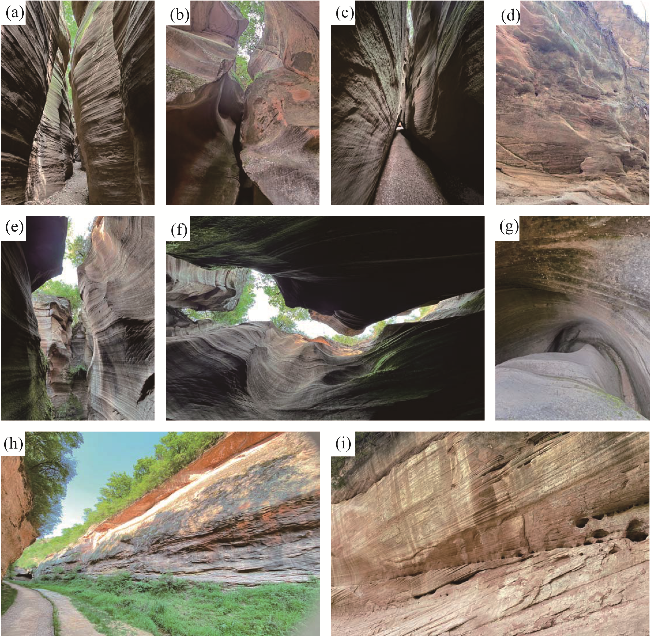
Fig. 2 Danxia landform landscape of the Ganquan canyon group. (a), Huabaocha Gully; (b), Mudan Gully; (c), Yixiantian Gully; (d), Longbagou Gully; (e and f), Huashu Gully; (g), kettle caves; (h), red cliffs; (i), micro-geomorphology. |
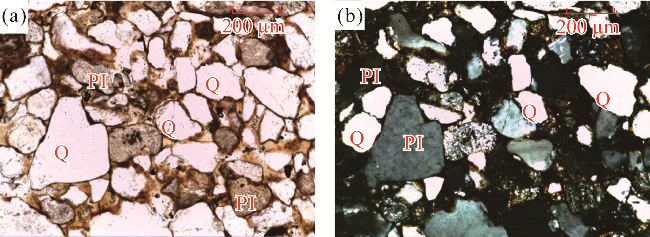
Fig. 3 Microscopic characterization of sandstones in the Lower Cretaceous Luohe Formation. (a), single polarized photo; (b), orthogonal polarizer photo. PI, feldspar; Q, quartz. |
Table 1 Overall experimental design |
| Test type | Content | Groups×number of samples per group |
|---|---|---|
| Basic physical and mechanical test | Natural moisture | 2×5 |
| Water absorption | 2×5 | |
| Saturated water absorption | 2×5 | |
| Natural density | 2×5 | |
| Uniaxial compression strength | 1×3 | |
| Triaxial compressive strength (1, 3, 6, 9, and 12 MPa) | 5×3 | |
| Softening test | Natural | 1×3 |
| Dry | 1×3 | |
| Saturated | 1×3 | |
| Acid dry-wet cycle test | The samples were dried in the oven for 12 h, cooled naturally for 15 min to room temperature, and then soaked in the solution for 12 h to ensure full water absorption. After soaking, we dried the samples at room temperature for 15 min. | 4×3, pH=4 |
| 4×3, pH=5 | ||
| 4×3, pH=6 | ||
| Freeze-thaw cycle test | The samples were frozen at -20°C for 4 h, and then thawed in a water bath at 20°C for 4 h. | 4×3 |
Table 2 Basic physical-mechanical properties of sandstone |
| Natural density (g/cm3) | Natural moisture content (%) | Water absorption (%) | Saturated water absorption (%) | Saturation coefficient | Cohesion (MPa) | Internal friction angle (°) |
|---|---|---|---|---|---|---|
| 2.10 | 5.81 | 6.40 | 9.29 | 0.69 | 3.79 | 41.98 |
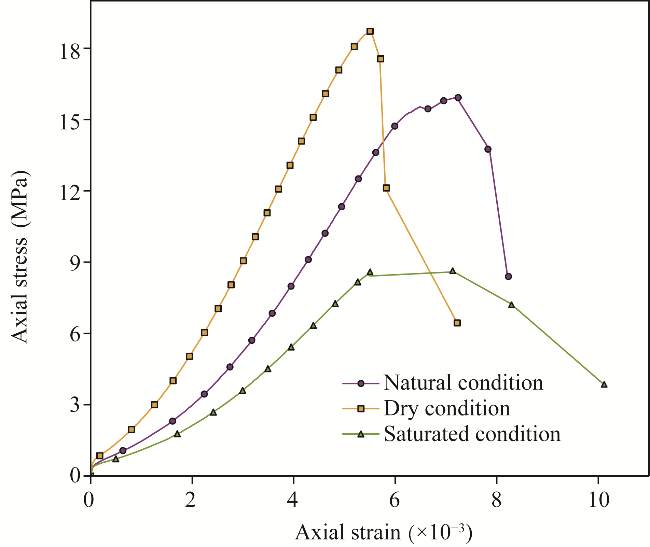
Table 3 Unconfined uniaxial compressive strength test results under natural, dry, and saturated conditions |
| Sample state | Peak strength (MPa) | Elastic modulus (GPa) | Mean | |
|---|---|---|---|---|
| Peak strength (MPa) | Elastic modulus (GPa) | |||
| Natural | 15.936 | 3.070 | 14.049 | 2.491 |
| 13.617 | 2.591 | |||
| 12.593 | 1.813 | |||
| Dry | 17.811 | 2.846 | 18.517 | 3.433 |
| 19.012 | 3.335 | |||
| 18.728 | 4.119 | |||
| Saturated | 11.924 | 2.286 | 9.578 | 1.980 |
| 8.759 | 1.846 | |||
| 8.590 | 1.808 | |||
Fig. 4 Comparison of uniaxial stress-strain curves under natural, dry, and saturated conditions |
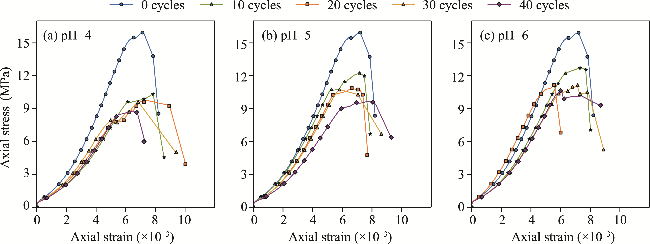
Fig. 5 Stress-strain curves of sandstone under different dry-wet cycles and acidic environments. (a), pH=4; (b), pH=5; (c), pH=6. |
Table 4 Peak strength and modulus of elasticity of sandstones under acidic wet-dry cycles |
| Number of cycles | pH=4 | pH=5 | pH=6 | |||
|---|---|---|---|---|---|---|
| Peak strength (MPa) | Elastic modulus (GPa) | Peak strength (MPa) | Elastic modulus (GPa) | Peak strength (MPa) | Elastic modulus (GPa) | |
| 0 | 15.936 | 3.070 | 15.936 | 3.070 | 15.936 | 3.070 |
| 10 | 10.355 | 1.911 | 12.227 | 2.480 | 12.722 | 2.412 |
| 20 | 9.790 | 1.801 | 10.887 | 2.282 | 11.169 | 2.600 |
| 30 | 9.668 | 1.994 | 10.737 | 2.221 | 11.095 | 2.129 |
| 40 | 8.724 | 1.800 | 9.699 | 1.813 | 10.641 | 2.138 |
Table 5 Mechanical parameters of sandstone under acid dry-wet cycles |
| Number of dry-wet cycles | pH=4 | pH=5 | pH=6 | |||||||||
|---|---|---|---|---|---|---|---|---|---|---|---|---|
| Peak strength | Elastic modulus | Peak strength | Elastic modulus | Peak strength | Elastic modulus | |||||||
| ${{S}_{n}}$(%) | $\Delta {{S}_{n}}$(%) | ${{S}_{n}}$(%) | $\Delta {{S}_{n}}$(%) | ${{S}_{n}}$(%) | $\Delta {{S}_{n}}$(%) | ${{S}_{n}}$(%) | $\Delta {{S}_{n}}$(%) | ${{S}_{n}}$(%) | $\Delta {{S}_{n}}$(%) | ${{S}_{n}}$(%) | $\Delta {{S}_{n}}$(%) | |
| 10 | 35.02 | 35.02 | 37.75 | 37.75 | 23.27 | 23.27 | 19.22 | 19.22 | 20.17 | 20.17 | 21.43 | 21.43 |
| 20 | 38.57 | 3.55 | 41.34 | 3.58 | 31.68 | 8.41 | 25.67 | 6.45 | 29.91 | 9.74 | 15.31 | -6.12 |
| 30 | 39.33 | 0.77 | 35.05 | -6.29 | 32.62 | 0.94 | 27.65 | 1.98 | 30.38 | 0.46 | 30.65 | 15.34 |
| 40 | 45.26 | 5.92 | 41.37 | 6.32 | 39.14 | 6.51 | 40.91 | 13.29 | 33.23 | 2.85 | 30.36 | -0.29 |
Note: Sn, total deterioration degree; ΔSn, stage deterioration degree. |
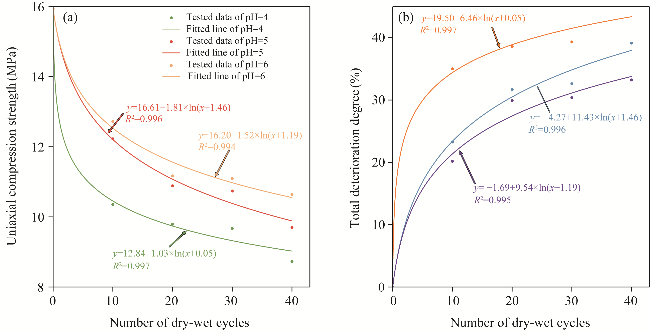
Fig. 6 Trends of uniaxial compression strength (a) and total deterioration degree (b) under acidic dry-wet cycles |
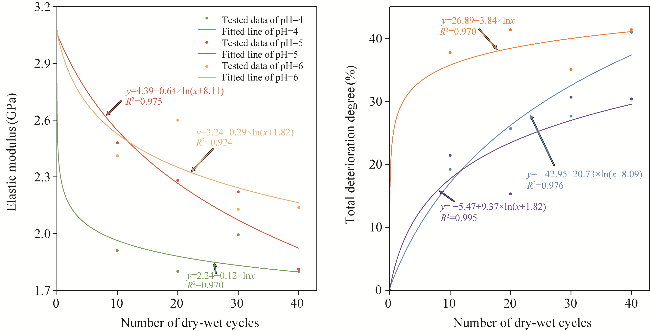
Fig. 7 Trends of elastic modulus (a) and total deterioration degree (b) under acidic dry-wet cycles |
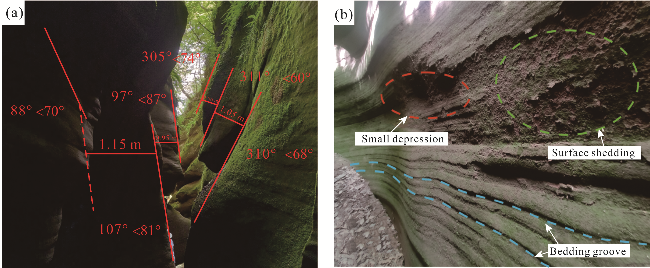
Fig. 8 Slit-type Danxia landform rock echelon joints (a) and bryophyte-attached rock walls (b) |
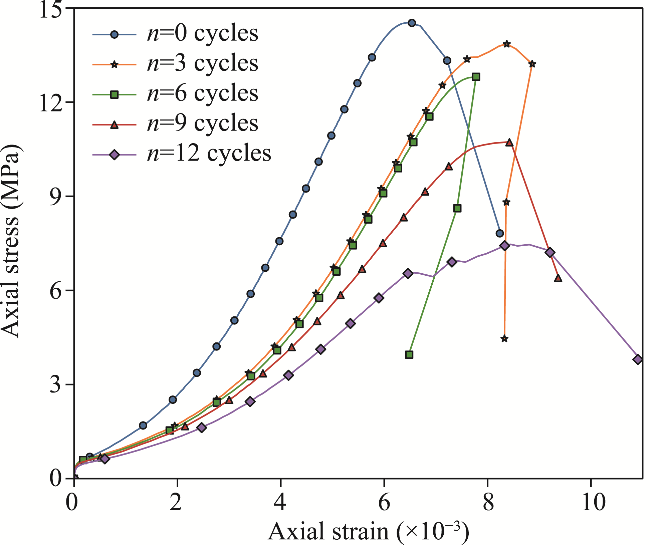
Fig. 9 Uniaxial stress-strain curves of sandstone under freeze-thaw cycles. n is the number of freeze-thaw cycles. |
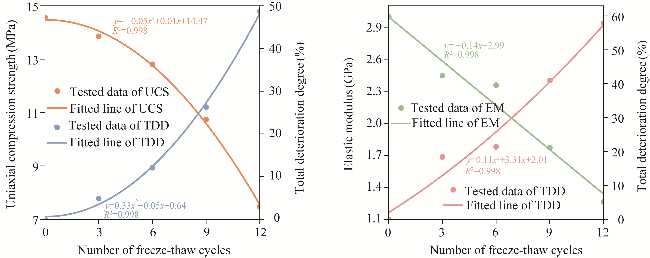
Fig. 10 Trends of peak strength (a) and elastic modulus (b) of sandstone under freeze-thaw cycles. UCS, uniaxial compression strength; TDD, total deterioration degree; EM, elastic modulus. |
Table 6 Mechanical parameter of sandstone under freeze-thaw cycles |
| Number of freeze-thaw cycles | Peak strength (MPa) | Elastic modulus (GPa) | Total deterioration degree (%) | Stage deterioration degree (%) | ||
|---|---|---|---|---|---|---|
| Peak strength | Elastic modulus | Peak strength | Elastic modulus | |||
| 0 | 14.566 | 2.998 | 0.00 | 0.00 | 0.00 | 0.00 |
| 3 | 13.856 | 2.446 | 4.87 | 18.41 | 4.87 | 18.41 |
| 6 | 12.807 | 2.357 | 12.08 | 21.38 | 7.20 | 2.97 |
| 9 | 10.736 | 1.770 | 26.29 | 40.96 | 14.22 | 19.58 |
| 12 | 7.467 | 1.263 | 48.74 | 57.87 | 22.44 | 16.91 |
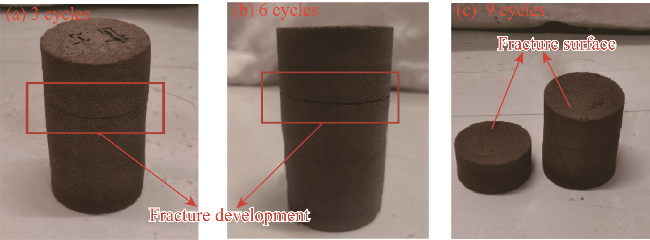
Fig. 11 Growth and development of cracks in rocks during freeze-thaw cycles. (a), 3 cycles; (b), 6 cycles; (c), 9 cycles. |
| [1] |
|
| [2] |
|
| [3] |
|
| [4] |
|
| [5] |
|
| [6] |
|
| [7] |
|
| [8] |
|
| [9] |
|
| [10] |
|
| [11] |
|
| [12] |
|
| [13] |
|
| [14] |
|
| [15] |
|
| [16] |
|
| [17] |
|
| [18] |
|
| [19] |
|
| [20] |
|
| [21] |
|
| [22] |
|
| [23] |
|
| [24] |
|
| [25] |
|
| [26] |
|
| [27] |
National Standards Compilation Group of People's Republic of China. 2013. GB/T 50266-2013: Standard for Test Method of Engineering Rock Mass. Beijing: China Planning Publishing House. (in Chinese)
|
| [28] |
|
| [29] |
|
| [30] |
|
| [31] |
|
| [32] |
|
| [33] |
|
| [34] |
|
| [35] |
|
| [36] |
|
| [37] |
|
| [38] |
|
| [39] |
|
| [40] |
|
| [41] |
|
| [42] |
|
| [43] |
|
| [44] |
|
| [45] |
|
| [46] |
|
| [47] |
|
| [48] |
|
| [49] |
|
/
| 〈 |
|
〉 |