Spatiotemporal evolution and future simulation of land use/land cover in the Turpan-Hami Basin, China
Received date: 2024-05-31
Revised date: 2024-09-03
Accepted date: 2024-09-06
Online published: 2025-08-13
CHEN Yiyang , ZHANG Li , YAN Min , WU Yin , DONG Yuqi , SHAO Wei , ZHANG Qinglan . [J]. Journal of Arid Land, 2024 , 16(10) : 1303 -1326 . DOI: 10.1007/s40333-024-0086-z
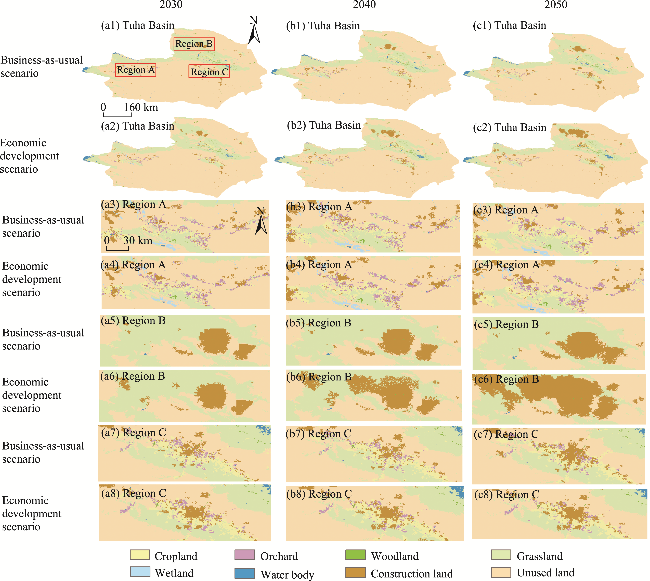
The Turpan-Hami (Tuha) Basin in Xinjiang Uygur Autonomous Region of China, holds significant strategic importance as a key economic artery of the ancient Silk Road and the Belt and Road Initiative, necessitating a holistic understanding of the spatiotemporal evolution of land use/land cover (LULC) to foster sustainable planning that is tailored to the region's unique resource endowments. However, existing LULC classification methods demonstrate inadequate accuracy, hindering effective regional planning. In this study, we established a two-level LULC classification system (8 primary types and 22 secondary types) for the Tuha Basin. By employing Landsat 5/7/8 imagery at 5-a intervals, we developed the LULC dataset of the Tuha Basin from 1990 to 2020, conducted the accuracy assessment and spatiotemporal evolution analysis, and simulated the future LULC under various scenarios via the Markov-Future Land Use Simulation (Markov-FLUS) model. The results revealed that the average overall accuracy values of our LULC dataset were 0.917 and 0.864 for the primary types and secondary types, respectively. Compared with the seven mainstream LULC products (GlobeLand30, Global 30-meter Land Cover with Fine Classification System (GLC_FCS30), Finer Resolution Observation and Monitoring of Global Land Cover PLUS (FROM_GLC PLUS), ESA Global Land Cover (ESA_LC), Esri Land Cover (ESRI_LC), China Multi-Period Land Use Land Cover Change Remote Sensing Monitoring Dataset (CNLUCC), and China Annual Land Cover Dataset (CLCD)) in 2020, our LULC data exhibited dramatically elevated overall accuracy and provided more precise delineations for land features, thereby yielding high-quality data backups for land resource analyses within the basin. In 2020, unused land (78.0% of the study area) and grassland (18.6%) were the dominant LULC types of the basin; although cropland and construction land constituted less than 1.0% of the total area, they played a vital role in arid land development and primarily situated within oases that form the urban cores of the cities of Turpan and Hami. Between 1990 and 2020, cropland and construction land exhibited a rapid expansion, and the total area of water body decreased yet resurging after 2015 due to an increase in areas of reservoir and pond. In future scenario simulations, significant increases in areas of construction land and cropland are anticipated under the business-as-usual scenario, whereas the wetland area will decrease, suggesting the need for ecological attention under this development pathway. In contrast, the economic development scenario underscores the fast-paced expansion of construction land, primarily from the conversion of unused land, highlighting the significant developmental potential of unused land with a slowing increase in cropland. Special attention should thus be directed toward ecological and cropland protection during development. This study provides data supports and policy recommendations for the sustainable development goals of Tuha Basin and other similar arid areas.
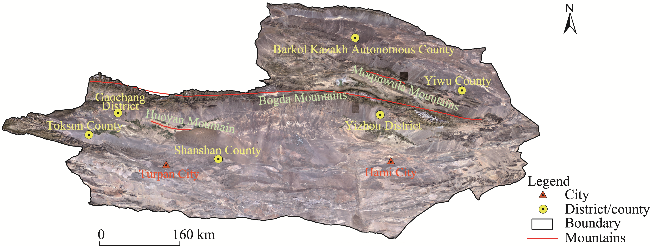
Fig. 1 Overview of the Turpan-Hami (Tuha) Basin based on the remote sensing images in 2020. The images are sourced from Google Earth (https://www.google.com/). The boundary is based on the standard map (GS (2020)4619) of the Map Service System (https://bzdt.ch.mnr.gov.cn/), and the boundary has not been modified. |
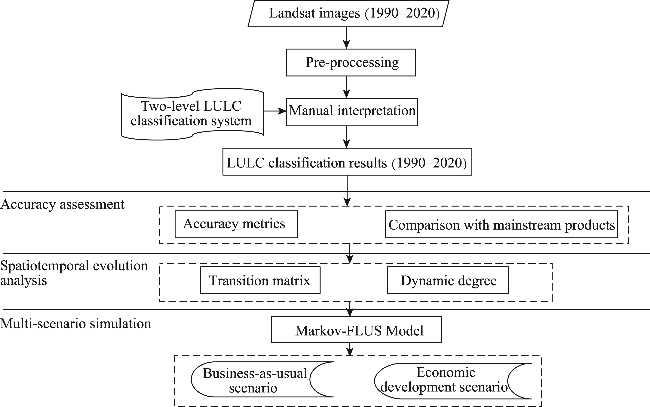
Fig. 2 Flow diagram of the study. LULC, land use/land cover; Markov-FLUS, Markov-Future Land Use Simulation. |
Table 1 Classification system of land use/land cover (LULC) in the study |
| ID | Primary LULC type | ID | Secondary LULC type | ID | Primary LULC type | ID | Secondary LULC type |
|---|---|---|---|---|---|---|---|
| 1 | Cropland | - | - | 7 | Construction land | 71 | Urban residential area |
| 2 | Orchard | - | - | 72 | Rural residential area | ||
| 3 | Woodland | 31 | Forestland | 73 | Mining land | ||
| 32 | Shrub land | 74 | Wind power and photovoltaic land | ||||
| 33 | Sparse woodland | 75 | Other construction land | ||||
| 34 | Other woodland | 8 | Unused land | 81 | Sandy land | ||
| 4 | Grassland | 41 | High-coverage grassland | 82 | Gobi | ||
| 42 | Mid-coverage grassland | 83 | Saline‒alkali land | ||||
| 43 | Low coverage grassland | 84 | Bare land | ||||
| 5 | Wetland | - | - | 85 | Bare rocky land | ||
| 6 | Water body | 61 | River | 86 | Other unused land | ||
| 62 | Lake | ||||||
| 63 | Reservoir and pond | ||||||
| 64 | Permanent glacier |
Note: "-" indicates no corresponding ID or secondary LULC type. |
Table 2 Overall accuracy and kappa coefficients for the primary and secondary types of our LULC dataset |
| Year | Primary LULC type | Secondary LULC type | ||
|---|---|---|---|---|
| Overall accuracy | Kappa coefficient | Overall accuracy | Kappa coefficient | |
| 1990 | 0.915 | 0.845 | 0.870 | 0.835 |
| 1995 | 0.906 | 0.828 | 0.858 | 0.819 |
| 2000 | 0.911 | 0.839 | 0.862 | 0.825 |
| 2005 | 0.907 | 0.833 | 0.863 | 0.827 |
| 2010 | 0.916 | 0.860 | 0.854 | 0.822 |
| 2015 | 0.919 | 0.871 | 0.848 | 0.817 |
| 2020 | 0.946 | 0.918 | 0.894 | 0.875 |
| Average | 0.917 | 0.856 | 0.864 | 0.831 |
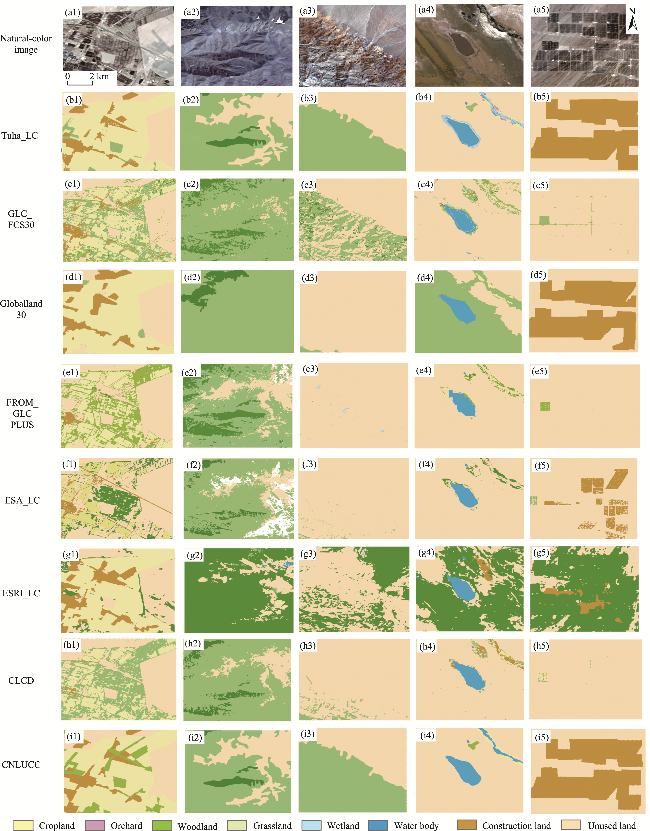
Fig. 3 Comparison of LULC classification performance between our LULC data and seven mainstream LULC products for primary LULC types in 2020 in five typical regions. (a1-a5), natural-color images created using bands 4, 3, and 2 from Landsat 8 data in 2020; (b1-b5), Tuha_LC; (c1-c5), GLC_FCS30; (d1-d5), Globelland30; (e1-e5), FROM_GLC PLUS; (f1-f5), ESA_LC; (g1-g5), ESRI_LC; (h1-h5), CLCD; (i1-i5), CNLUCC. Tuha_LC represents our LULC data. GLC_FCS30, Global 30-meter Land Cover with Fine Classification System; FROM_GLC PLUS, Finer Resolution Observation and Monitoring of Global Land Cover PLUS; ESA_LC, ESA Global Land Cover; ESRI_LC, Esri Land Cover; CLCD, China Annual Land Cover Dataset; CNLUCC, China Multi-Period Land Use Land Cover Change Remote Sensing Monitoring Dataset. |
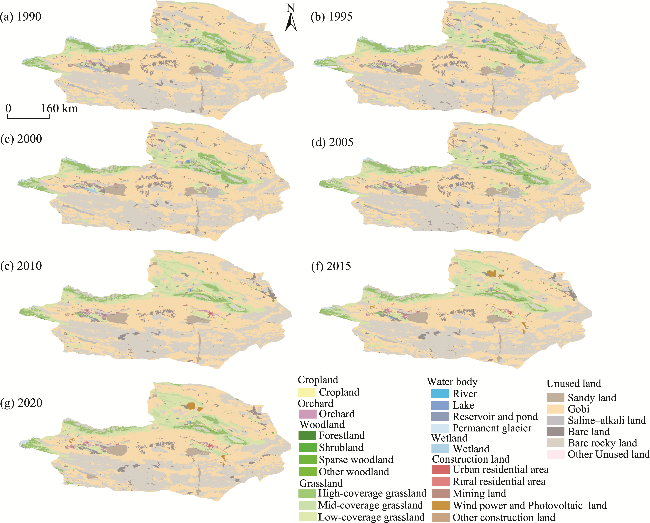
Fig. 4 Spatial distribution of LULC in the Tuha Basin in 1990 (a), 1995 (b), 2000 (c), 2005 (d), 2010 (e), 2015 (f), and 2020 (g) |
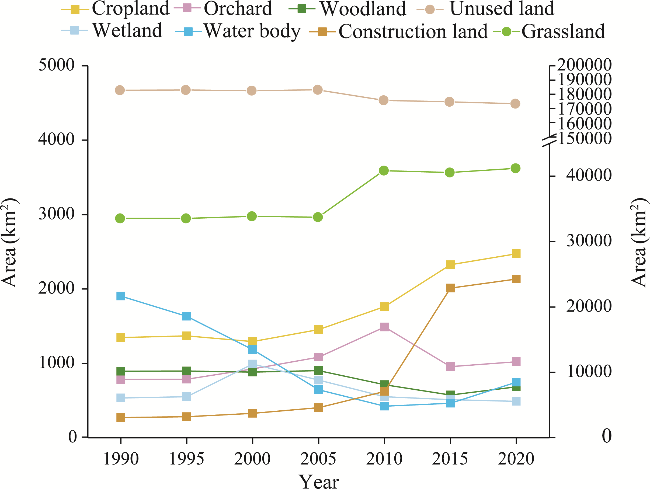
Fig. 5 Temporal variation in area of each primary LULC type in the Tuha Basin from 1990 to 2020. Note that grassland and unused land are represented on the right-hand axis, while other LULC types correspond to the left-hand axis. |
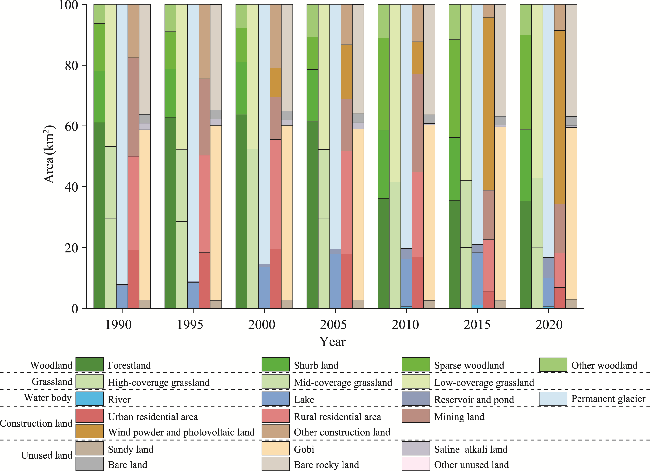
Fig. 6 Temporal variation in area of each secondary LULC type in the Tuha Basin from 1990 to 2020 |
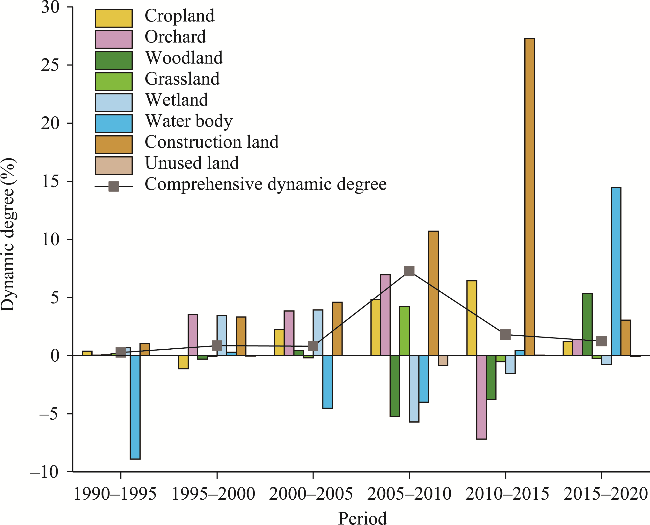
Fig. 7 Variation in single dynamic degree and comprehensive dynamic degree of LULC in the Tuha Basin in different periods from 1990 to 2020 |
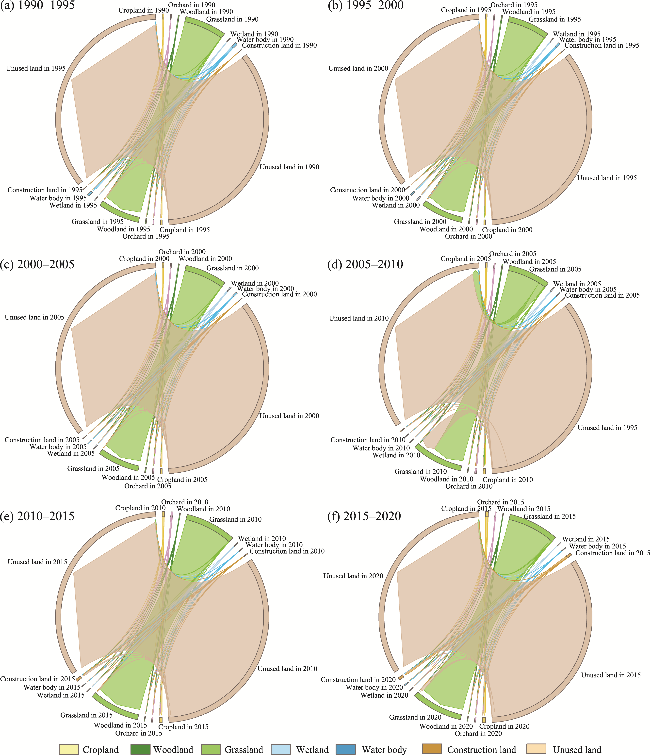
Fig. 8 Sankey diagram illustrating the transitions between primary LULC types in the Tuha Basin during the periods of 1990-1995 (a), 1995-2000 (b), 2000-2005 (c), 2005-2010 (d), 2010-2015 (e), and 2015-2020 (f) |
Table 3 Simulated area of each primary LULC type in the Tuha Basin under the business-as-usual and economic development scenarios in 2030, 2040, and 2050 |
| Scenario | Year | Area (km2) | ||||||||
|---|---|---|---|---|---|---|---|---|---|---|
| Cropland | Orchard | Woodland | Grassland | Wetland | Water body | Construction land | Unused land | |||
| Business-as- usual scenario | 2030 | 2924.26 | 877.05 | 697.77 | 41,590.16 | 447.04 | 971.22 | 2886.44 | 171,325.79 | |
| 2040 | 3326.94 | 767.46 | 694.54 | 41,948.26 | 400.11 | 1130.06 | 3596.53 | 169,855.80 | ||
| 2050 | 3697.84 | 678.18 | 691.28 | 42,306.87 | 358.48 | 1274.75 | 4290.44 | 168,421.88 | ||
| Economic development scenario | 2030 | 2864.47 | 872.64 | 701.90 | 39,740.00 | 425.18 | 958.00 | 2964.71 | 173,192.83 | |
| 2040 | 3052.29 | 777.79 | 714.74 | 38,207.60 | 368.84 | 1169.38 | 4707.38 | 172,721.68 | ||
| 2050 | 3018.36 | 755.14 | 726.46 | 36,427.31 | 326.26 | 1234.33 | 7130.56 | 172,101.31 | ||
Fig. 9 Spatial distribution of simulated LULC in the Tuha Basin and three partial regions under the business-as- usual and economic development scenarios in 2030 (a1-a8), 2040 (b1-b8), and 2050 (c1-c8) |
Table S1 Accuracy assessment results for each primary LULC type of Tuha_LC from 1990 to 2020 |
| Year | Metric | Cropland | Orchard | Woodland | Grassland | Wetland | Water body | Construction land | Unused land |
|---|---|---|---|---|---|---|---|---|---|
| 1990 | PA | 0.649 | 0.903 | 0.576 | 0.883 | 0.954 | 0.982 | 0.706 | 0.958 |
| UA | 0.897 | 0.509 | 0.810 | 0.792 | 0.883 | 0.809 | 0.857 | 0.983 | |
| 1995 | PA | 0.638 | 0.897 | 0.559 | 0.861 | 0.943 | 0.944 | 0.813 | 0.952 |
| UA | 0.923 | 0.491 | 0.733 | 0.768 | 0.872 | 0.797 | 0.765 | 0.979 | |
| 2000 | PA | 0.617 | 0.976 | 0.567 | 0.860 | 0.988 | 0.983 | 0.737 | 0.958 |
| UA | 0.985 | 0.577 | 0.756 | 0.775 | 0.876 | 0.881 | 0.875 | 0.972 | |
| 2005 | PA | 0.591 | 0.974 | 0.586 | 0.897 | 0.837 | 0.978 | 0.769 | 0.963 |
| UA | 0.974 | 0.475 | 0.791 | 0.769 | 0.928 | 0.938 | 0.800 | 0.971 | |
| 2010 | PA | 0.702 | 0.900 | 0.800 | 0.825 | 0.989 | 0.917 | 0.778 | 0.967 |
| UA | 0.890 | 0.600 | 0.698 | 0.880 | 0.918 | 0.815 | 0.946 | 0.978 | |
| 2015 | PA | 0.907 | 0.778 | 0.765 | 0.834 | 0.978 | 0.921 | 0.892 | 0.960 |
| UA | 0.824 | 0.800 | 0.765 | 0.878 | 0.897 | 0.967 | 0.851 | 0.964 | |
| 2020 | PA | 0.922 | 0.957 | 0.908 | 0.832 | 0.989 | 0.979 | 0.897 | 0.974 |
| UA | 0.870 | 0.968 | 0.814 | 0.940 | 0.979 | 0.912 | 0.853 | 0.976 |
Note: LULC, land use/land cover. Tuha_LC represents the LULC data generated in this study. PA, producer accuracy; UA, user accuracy. |
Table S2 Accuracy assessment results for each primary LULC type of Tuha_LC and the seven mainstream LULC products in 2020 |
| LULC data | Metric | Cropland | Woodland | Grassland | Water body | Construction land | Unused land | OA | Kappa |
|---|---|---|---|---|---|---|---|---|---|
| Tuha_LC | PA | 0.922 | 0.957 | 0.908 | 0.832 | 0.989 | 0.979 | 0.917 | 0.845 |
| UA | 0.870 | 0.968 | 0.814 | 0.940 | 0.979 | 0.912 | |||
| GLC_FCS30 | PA | 0.060 | 0.121 | 0.288 | 0.214 | 0.000 | 0.703 | 0.553 | 0.154 |
| UA | 0.069 | 0.129 | 0.243 | 0.095 | 0.000 | 0.805 | |||
| Global-land30 | PA | 0.128 | 0.316 | 0.360 | 0.477 | 0.056 | 0.708 | 0.585 | 0.209 |
| UA | 0.186 | 0.138 | 0.283 | 0.221 | 0.021 | 0.822 | |||
| FROM_GLC PLUS | PA | 0.073 | 0.041 | 0.237 | 0.283 | 0.100 | 0.679 | 0.562 | 0.121 |
| UA | 0.069 | 0.023 | 0.177 | 0.137 | 0.010 | 0.839 | |||
| ESA_LC | PA | 0.090 | 0.451 | 0.698 | 0.306 | 0.083 | 0.806 | 0.697 | 0.451 |
| UA | 0.098 | 0.586 | 0.822 | 0.116 | 0.010 | 0.861 | |||
| ESRI_LC | PA | 0.058 | 0.051 | 0.909 | 0.222 | 0.000 | 0.772 | 0.345 | 0.086 |
| UA | 0.069 | 0.484 | 0.042 | 0.105 | 0.000 | 0.477 | |||
| CLCD | PA | 0.074 | 0.000 | 0.290 | 0.250 | 0.000 | 0.700 | 0.561 | 0.157 |
| UA | 0.088 | 0.000 | 0.296 | 0.116 | 0.000 | 0.814 | |||
| CNLUCC | PA | 0.210 | 0.042 | 0.270 | 0.280 | 0.041 | 0.735 | 0.577 | 0.206 |
| UA | 0.127 | 0.034 | 0.296 | 0.147 | 0.021 | 0.828 |
Note: GLC_FCS30, Global 30-meter Land Cover with Fine Classification System; FROM_GLC PLUS, Finer Resolution Observation and Monitoring of Global Land Cover PLUS; ESA_LC, ESA Global Land Cover; ESRI_LC, Esri Land Cover; CLCD, China Annual Land Cover Dataset; CNLUCC, China Multi-Period Land Use Land Cover Change Remote Sensing Monitoring Dataset; OA, overall accuracy. Kappa represents the kappa coefficient. |
Table S3 Land transitions between primary LULC types in different periods from 1900 to 2020 |
| Land transition | Area (km2) | |||||
|---|---|---|---|---|---|---|
| 1900-1995 | 1995-2000 | 2000-2005 | 2005-2010 | 2010-2015 | 2015-2020 | |
| Cropland to cropland | 1243.79 | 941.15 | 1126.99 | 883.64 | 1569.73 | 1871.84 |
| Cropland to orchard | 62.46 | 41.35 | 95.80 | 290.30 | 22.47 | 288.33 |
| Cropland to woodland | 4.31 | 6.85 | 2.22 | 10.46 | 0.51 | 0.62 |
| Cropland to grassland | 19.23 | 330.82 | 33.82 | 154.76 | 88.61 | 98.49 |
| Cropland to wetland | 1.04 | 5.00 | 2.00 | 0.35 | 0.45 | 0.27 |
| Cropland to water body | 0.01 | 0.24 | 0.33 | 0.20 | 1.64 | 1.61 |
| Cropland to construction land | 5.74 | 20.64 | 14.19 | 48.64 | 49.55 | 48.27 |
| Cropland to unused land | 9.65 | 24.09 | 17.39 | 66.98 | 29.89 | 16.65 |
| Orchard to cropland | 32.34 | 35.07 | 81.35 | 230.11 | 483.09 | 297.40 |
| Orchard to orchard | 704.30 | 683.40 | 813.00 | 747.67 | 885.08 | 593.86 |
| Orchard to woodland | 26.03 | 15.98 | 9.77 | 0.58 | 0.04 | 1.17 |
| Orchard to grassland | 10.40 | 24.91 | 9.52 | 47.90 | 21.32 | 33.44 |
| Orchard to wetland | 0.30 | 0.00 | 0.03 | 0.42 | 0.17 | 0.75 |
| Orchard to water body | 0.07 | 0.06 | 0.10 | 0.11 | 0.93 | 1.08 |
| Orchard to construction land | 7.99 | 16.35 | 11.06 | 38.43 | 82.97 | 18.83 |
| Orchard to unused land | 3.15 | 11.16 | 1.80 | 16.39 | 15.48 | 4.92 |
| Woodland to cropland | 35.37 | 7.52 | 1.13 | 42.78 | 8.13 | 3.66 |
| Woodland to orchard | 5.75 | 40.35 | 33.50 | 79.62 | 0.72 | 3.82 |
| Woodland to woodland | 800.97 | 803.07 | 807.78 | 216.43 | 517.37 | 492.11 |
| Woodland to grassland | 32.45 | 32.31 | 9.06 | 497.77 | 160.08 | 37.78 |
| Woodland to wetland | 0.10 | 0.49 | 27.19 | 0.62 | 0.38 | |
| woodland to water body | 0.22 | 0.09 | 0.00 | 1.12 | 0.27 | 23.46 |
| woodland to construction land | 1.51 | 3.38 | 1.16 | 4.80 | 3.45 | 1.72 |
| woodland to unused land | 16.67 | 9.57 | 3.73 | 59.38 | 21.20 | 12.06 |
| Grassland to cropland | 36.63 | 172.11 | 145.84 | 349.29 | 154.52 | 145.66 |
| Grassland to orchard | 8.47 | 95.23 | 98.02 | 150.46 | 19.47 | 50.67 |
| Grassland to woodland | 51.74 | 41.68 | 41.30 | 379.42 | 46.46 | 155.00 |
| Grassland to grassland | 32,988.39 | 32,937.56 | 33,334.00 | 27,364.77 | 39,803.95 | 38,602.64 |
| Grassland to wetland | 3.61 | 80.38 | 19.81 | 24.71 | 7.02 | 11.78 |
| Grassland to water body | 267.14 | 55.23 | 2.27 | 60.57 | 150.85 | 282.08 |
| Grassland to construction land | 5.57 | 11.95 | 4.31 | 57.41 | 59.56 | 151.86 |
| Grassland to unused land | 249.50 | 206.37 | 275.50 | 5390.03 | 667.37 | 1219.14 |
| Wetland to cropland | 0.08 | 0.12 | 0.96 | 11.21 | 0.75 | 0.69 |
| Wetland to orchard | 0.04 | 0.26 | 0.30 | 0.34 | 0.75 | 0.03 |
| Wetland to woodland | 0.30 | 0.07 | 0.76 | 4.37 | 0.00 | 0.27 |
| Wetland to grassland | 2.89 | 1.75 | 25.20 | 184.91 | 16.67 | 27.68 |
| Wetland to wetland | 516.43 | 532.83 | 622.76 | 495.31 | 495.64 | 468.58 |
| Wetland to water body | 0.18 | 8.37 | 0.03 | 1.39 | 4.37 | 7.17 |
| Wetland to construction land | 0.12 | 0.00 | 0.38 | 0.84 | 0.70 | 1.10 |
| Wetland to unused land | 13.93 | 8.53 | 339.78 | 76.71 | 33.75 | 5.91 |
| Water body to cropland | 0.24 | 0.01 | 0.34 | 0.77 | 1.51 | 1.37 |
| Water body to orchard | 0.09 | 0.62 | 0.04 | 0.67 | 0.20 | 0.23 |
| Water body to woodland | 0.05 | 0.05 | 0.00 | 0.06 | 0.08 | 0.41 |
| Water body to grassland | 45.63 | 232.58 | 130.06 | 78.25 | 6.03 | 93.41 |
| Water body to wetland | 0.05 | 0.66 | 10.28 | 0.18 | 0.25 | 0.35 |
| Water body to water body | 1323.25 | 1047.25 | 640.63 | 273.92 | 250.52 | 349.89 |
| Water body to construction land | 0.00 | 0.00 | 0.00 | 1.05 | 0.01 | 1.24 |
| Water body to unused land | 532.84 | 340.75 | 401.85 | 289.53 | 164.89 | 16.90 |
| Construction land to cropland | 7.01 | 9.93 | 3.20 | 19.99 | 24.99 | 89.87 |
| Construction land to orchard | 3.46 | 15.15 | 3.46 | 37.26 | 11.59 | 34.21 |
| Construction land to woodland | 3.02 | 1.46 | 0.60 | 1.02 | 0.01 | 1.15 |
| Construction land to grassland | 3.56 | 5.54 | 0.53 | 18.42 | 6.76 | 48.62 |
| Construction land to wetland | 0.02 | 0.17 | 1.51 | 0.07 | 0.01 | 0.38 |
| Construction land to water body | 0.00 | 0.00 | 0.01 | 0.02 | 0.11 | 0.60 |
| Construction land to construction land | 247.21 | 239.19 | 316.08 | 200.22 | 522.11 | 1604.39 |
| Construction land to unused land | 6.12 | 12.69 | 4.13 | 128.90 | 57.13 | 234.53 |
| Unused land to cropland | 14.66 | 126.83 | 95.51 | 225.06 | 83.37 | 62.05 |
| Unused land to orchard | 2.35 | 50.29 | 37.50 | 182.77 | 11.18 | 49.41 |
| Unused land to woodland | 10.36 | 14.37 | 40.09 | 99.26 | 10.14 | 34.64 |
| Unused land to grassland | 497.94 | 355.60 | 234.48 | 12,562.41 | 515.41 | 2328.14 |
| Unused land to wetland | 30.36 | 370.63 | 91.50 | 30.96 | 7.51 | 8.04 |
| Unused land to water body | 31.07 | 71.96 | 1.05 | 86.16 | 55.10 | 80.52 |
| Unused land to construction land | 15.98 | 38.01 | 58.72 | 271.32 | 1295.40 | 305.74 |
| Unused land to unused land | 181,728.90 | 181,538.49 | 181,592.80 | 169,179.04 | 173,228.86 | 171,350.03 |
| [1] |
|
| [2] |
|
| [3] |
|
| [4] |
|
| [5] |
|
| [6] |
|
| [7] |
|
| [8] |
|
| [9] |
|
| [10] |
|
| [11] |
|
| [12] |
|
| [13] |
|
| [14] |
|
| [15] |
|
| [16] |
|
| [17] |
|
| [18] |
|
| [19] |
|
| [20] |
|
| [21] |
|
| [22] |
|
| [23] |
|
| [24] |
|
| [25] |
|
| [26] |
|
| [27] |
|
| [28] |
|
| [29] |
|
| [30] |
|
| [31] |
|
| [32] |
|
| [33] |
|
| [34] |
|
| [35] |
|
| [36] |
|
| [37] |
|
| [38] |
|
| [39] |
|
| [40] |
|
| [41] |
|
| [42] |
|
| [43] |
|
| [44] |
|
| [45] |
|
| [46] |
|
| [47] |
|
/
| 〈 |
|
〉 |