
Variations of soil bacterial community structure and function under different habitats of Tamarix ramosissima Ledeb. in the upper reaches of the Tarim River, Northwest China
Received date: 2024-10-04
Revised date: 2025-01-23
Accepted date: 2025-02-20
Online published: 2025-08-13
YANG Qianqian , WU Xue , Bota BAHETHAN , TIAN Cuiping , YANG Xianyao , WANG Xiantao . [J]. Journal of Arid Land, 2025 , 17(4) : 560 -574 . DOI: 10.1007/s40333-025-0010-1
Diversity of soil microorganisms in different habitats of arid and semi-arid areas plays an important role in the soil texture and nutrient, promoting the growth of vegetation in those areas. To clarify the response of soil bacterial community diversity to the changes of environmental factors in different habitats, this study collected soil samples under the canopies of Tamarix ramosissima Ledeb. in oasis, transition zone, and desert habitats in the upper reaches of the Tarim River, Northwest China. High-throughput sequencing technology and PICRUSt2 software were used to explore the composition and function of soil bacterial communities in different habitats of T. ramosissima. The results showed that: (1) soil environmental factors under the canopy of T. ramosissima in the three habitats differed significantly, with soil moisture and nutrient conditions being better in the oasis; (2) Proteobacteria, Bacteroidetes, Firmicutes, Actinobacteria, and Gemmatimonadetes were the major bacterial communities in the three habitats; (3) soil bacterial community composition under the canopy of T. ramosissima varied greatly, and the richness was significantly different among the three habitats; (4) redundancy analysis indicated that soil water content and available phosphorous were the most important environmental factors influencing the composition of soil bacterial community; and (5) 6 primary functions and 21 secondary functions were obtained by PICRUSt2 function prediction, with metabolism being the most dominant function. This study revealed the response of soil bacterial community composition to habitat changes and their driving factors in the upper reaches of the Tarim River, which could improve the understanding of ecological sensitivity of soil microorganisms in arid and semi-arid areas, and provide a theoretical foundation for improving soil quality and ecological protection.
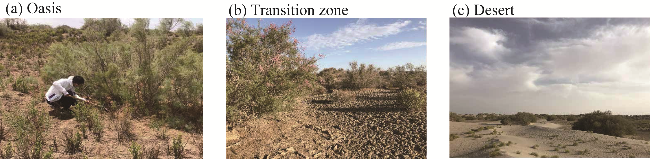
Fig. 1 Landscape of different habitats of Tamarix ramosissima Ledeb. in the upper reaches of the Tarim River. (a), oasis; (b), transition zone; (c), desert. |
Table 1 Community structure of Tamarix ramosissima Ledeb. in different habitats |
| Habitat type | Density (plants/hm²) | Height (cm) | Crown width (cm) | Coverage (%) |
|---|---|---|---|---|
| Oasis | 183.33±58.57b | 380.81±35.95a | 398.47±57.47a | 92.00±2.00a |
| Transition zone | 383.33±92.80a | 132.04±4.25b | 190.63±14.01b | 67.00±2.00b |
| Desert | 191.33+30.14b | 161.97±2.80b | 202.41±12.78b | 52.00±2.00c |
Note: Different lowercase letters within the same column indicate significant differences at P<0.05 level. Mean±SE. |
Table 2 Characteristics of soil environmental factors under the canopy of T. ramosissima in different habitats |
| Soil environmental factor | Oasis | Transition zone | Desert |
|---|---|---|---|
| SWC (%) | 32.00±1.00a | 22.00±3.00b | 1.00±0.00c |
| BD (g/cm³) | 1.10±0.18a | 1.14±0.08a | 1.30±0.01a |
| pH | 8.74±0.08a | 8.29±0.28ab | 8.24±0.07b |
| EC (µS/cm) | 420.33±26.36c | 2396.67±129.14a | 1640.67±132.16b |
| SOC (g/kg) | 3.49±0.09a | 2.03±0.04b | 2.18±0.11b |
| TP (g/kg) | 0.61±0.01a | 0.54±0.01b | 0.57±0.02ab |
| TN (g/kg) | 0.27±0.02a | 0.08±0.01b | 0.07±0.01b |
| AN (mg/kg) | 8.48±0.89a | 4.12±0.24b | 5.07±0.31b |
| AP (mg/kg) | 1.34±0.01b | 0.87±0.07c | 1.91±0.11a |
| MBN (mg/kg) | 2.78±0.21a | 4.27±1.06a | 4.20±0.28a |
| MBC (mg/kg) | 49.36±10.49a | 44.02±1.44a | 54.35±6.23a |
| MBP (mg/kg) | 3.01±0.18a | 2.00±0.11b | 2.10±0.16b |
Note: SWC, soil water content; BD, bulk density; EC, electrical conductivity; SOC, soil organic carbon; TP, total phosphorus; TN, total nitrogen; AN, available nitrogen; AP, available phosphorus; MBN, microbial biomass nitrogen; MBC, microbial biomass carbon; MBP, microbial biomass phosphorus. Different lowercase letters within the same row indicate significant differences among the three habitats at P<0.05 level. Mean±SE. The abbreviations are the same in the following figures. |
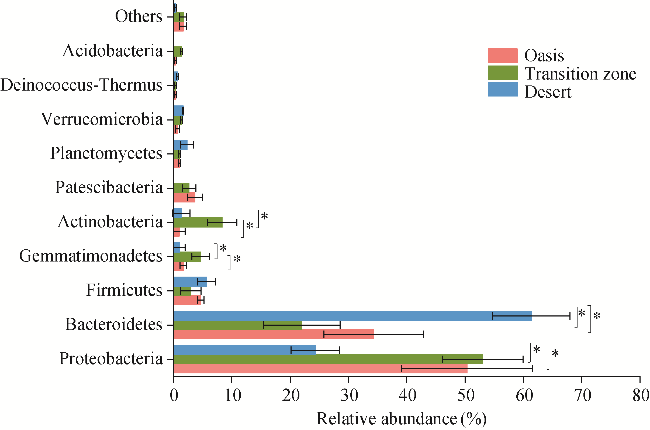
Fig. 2 Relative abundance of the first 10 phyla of soil bacterial community under the canopy of T. ramosissima in different habitats. Bars are standard errors. * indicates significant differences among the three habitats at P<0.05 level. |
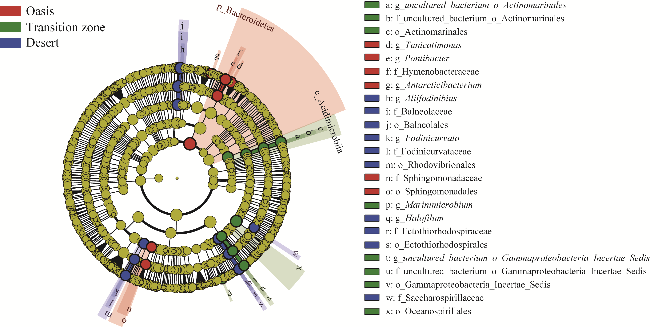
Fig. 3 Linear discriminant analysis (LDA) effect size (LEfSe) of soil bacterial community under the canopy of T. ramosissima in different habitats. We used LDA score >4 to identify significant differences based on biomarkers between groups. p, phylum; c, class; o, order; f, family; g, genus. |
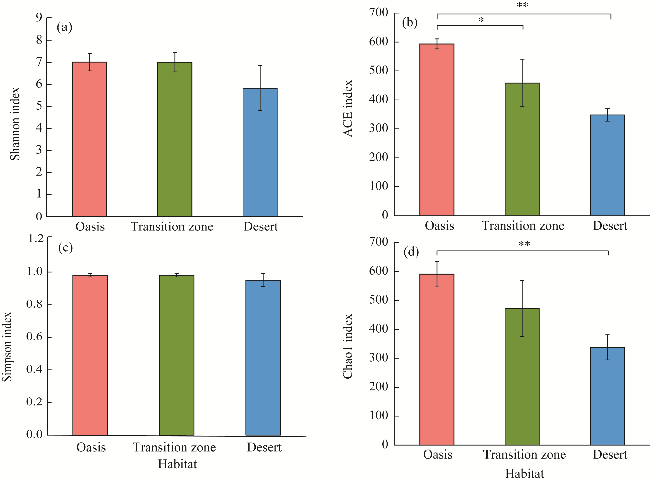
Fig. 4 Diversity and richness indices of soil bacterial community under the canopy of T. ramosissima in different habitats. (a), Shannon index; (b), ACE (accumulated cyclone energy) index; (c), Simpson index; (d), Chao1 index. Bars are standard errors. * indicates significant differences among the three habitats at P<0.05 level, and ** indicates significant differences among the three habitats at P<0.01 level. |
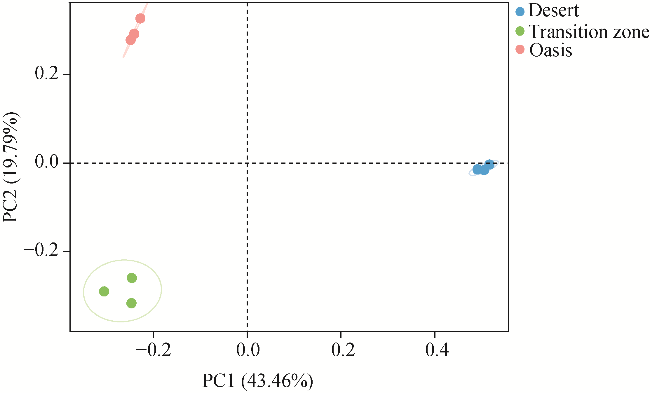
Fig. 5 Principal coordinate analysis (PCoA) of soil bacterial community under the canopy of T. ramosissima in different habitats. PC, principal coordinate. |
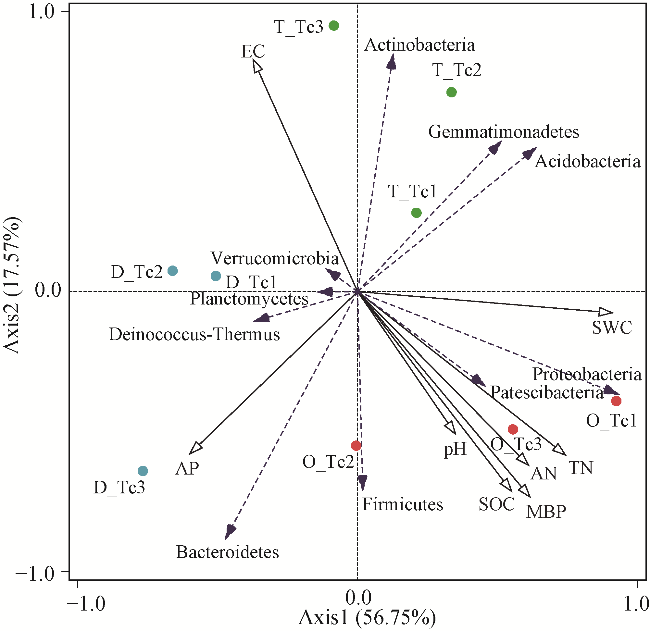
Fig. 6 Redundancy analysis (RDA) of phylum-level bacterial community and soil environmental factors. O_Tc, oasis; D_Tc, desert; T_Tc, transition zone. |
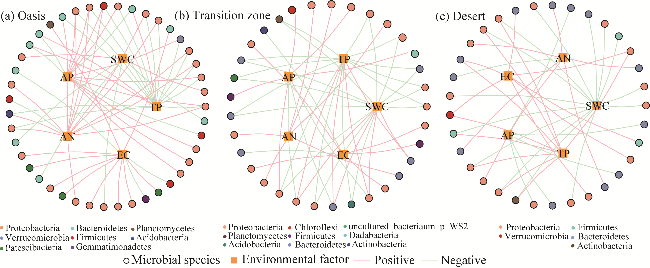
Fig. 7 Correlation network between soil microbial species and environmental factors in different habitats. (a), oasis; (b), transition zone; (c), desert. |
Table 3 Characteristics of primary function of soil bacterial community under the canopy of T. ramosissima in different habitats |
| Soil bacterial function | Relative abundance (%) | ||
|---|---|---|---|
| Oasis | Transition zone | Desert | |
| Metabolism | 80.85a | 79.45b | 79.18b |
| Genetic information processing | 7.23a | 7.28a | 7.27a |
| Environmental information processing | 5.14b | 5.94a | 5.98a |
| Cellular processes | 2.74b | 3.42a | 3.54a |
| Human diseases | 2.65a | 2.57a | 2.66a |
| Organismal systems | 1.39a | 1.34b | 1.37ab |
Note: Different lowercase letters within the same row indicate significant differences among the three habitats at P<0.05 level. |
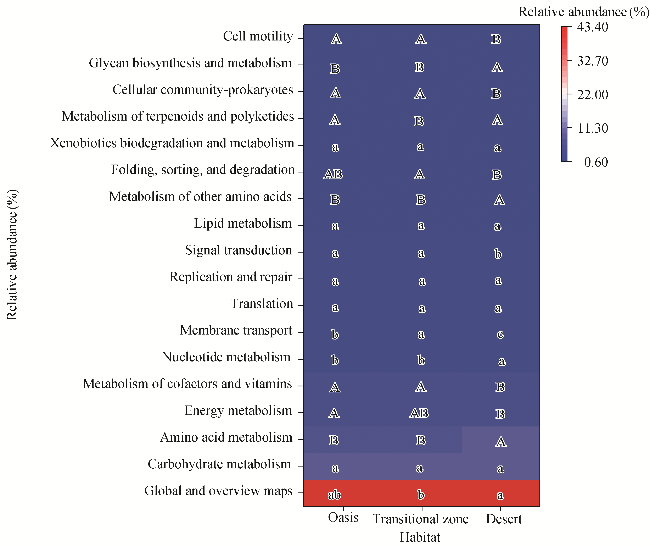
Fig. 8 Heatmap of soil bacterial function prediction in different habitats. Only the function with relative abundance of metabolic pathways greater than 0.10% was demonstrated. Different uppercase letters within the same row indicate significant differences among the three habitats at P<0.01 level, and different lowercase letters within the same row indicate significant differences among the three habitats at P<0.05 level. |
| [1] |
|
| [2] |
|
| [3] |
|
| [4] |
|
| [5] |
|
| [6] |
|
| [7] |
|
| [8] |
|
| [9] |
|
| [10] |
|
| [11] |
|
| [12] |
|
| [13] |
|
| [14] |
|
| [15] |
|
| [16] |
|
| [17] |
|
| [18] |
|
| [19] |
|
| [20] |
|
| [21] |
|
| [22] |
|
| [23] |
|
| [24] |
|
| [25] |
|
| [26] |
|
| [27] |
|
| [28] |
|
| [29] |
|
| [30] |
|
| [31] |
|
| [32] |
|
| [33] |
|
| [34] |
|
| [35] |
|
| [36] |
|
| [37] |
|
| [38] |
|
| [39] |
|
| [40] |
|
| [41] |
|
| [42] |
|
| [43] |
|
| [44] |
|
| [45] |
|
| [46] |
|
| [47] |
|
/
| 〈 |
|
〉 |