• HE Dequan ,
  • LU Haijing , * ,
  • HU Xiasong ,
  • WANG Cheng ,
  • LIU Changyi ,
  • ZHAO Yingxiao ,
  • LI Shuaifei ,
  • DENG Taiguo
展开

收稿日期: 2024-11-21

  修回日期: 2025-03-10

  录用日期: 2025-03-17

  网络出版日期: 2025-08-13

Mechanical properties and enhanced soil shear strength of herbaceous plant roots in the alpine meadow layer of the permafrost region on the Qinghai-Xizang Plateau, China

  • HE Dequan ,
  • LU Haijing , * ,
  • HU Xiasong ,
  • WANG Cheng ,
  • LIU Changyi ,
  • ZHAO Yingxiao ,
  • LI Shuaifei ,
  • DENG Taiguo
Expand
  • College of Geological Engineering, Qinghai University, Xining 810016, China
*LU Haijing (E-mail: )

The second and third authors contributed equally to this work.

Received date: 2024-11-21

  Revised date: 2025-03-10

  Accepted date: 2025-03-17

  Online published: 2025-08-13

本文引用格式

HE Dequan , LU Haijing , HU Xiasong , WANG Cheng , LIU Changyi , ZHAO Yingxiao , LI Shuaifei , DENG Taiguo . [J]. Journal of Arid Land, 2025 , 17(4) : 515 -537 . DOI: 10.1007/s40333-025-0051-5

Abstract

The Qinghai-Xizang Plateau of China faces challenges like thaw slumping, threatening slope stability and infrastructure. Understanding the mechanical properties of the roots of the dominant herbaceous plant species in the alpine meadow layer of the permafrost regions on the Qinghai-Xizang Plateau is essential for evaluating their role in enhancing soil shear strength and mitigating slope deformation in these fragile environments. In this study, the roots of four dominant herbaceous plant species—Kobresia pygmaea, Kobresia humilis, Carex moorcroftii, and Leontopodium pusillum—that are widely distributed in the permafrost regions of the Qinghai-Xizang Plateau were explored to determine their mechanical properties and effects in enhancing soil shear strength. Through indoor single root tensile and root group tensile tests, we determined the root diameter, tensile force, tensile strength, tensile ratio, and strength frequency distributions. We also evaluated their contributions to inhibiting slope deformation and failure during the formation and development of thermal thaw slumps in the alpine meadow. The results showed that the distribution of the root diameter of the dominant plant species is mostly normal, while the tensile strength tends to be logarithmically normally distributed. The relationship between the root diameter and root tensile strength conforms to a power function. The theoretical tensile strength of the root group was calculated using the Wu-Waldron Model (WWM) and the Fiber Bundle Model (FBM) under the assumption that the cumulative single tensile strength of the root bundle is identical to the tensile strength of the root group in the WWM. The FBM considers three fracture modes: FBM-D (the tensile force on each single root is proportional to its diameter relative to the total sum of all the root diameters), FBM-S (the cross-sectional stress in the root bundle is uniform), and FBM-N (each tensile strength test of individual roots experiences an equal load). It was found that the model-calculated tensile strength of the root group was 162.60% higher than the test value. The model-derived tensile force of the root group from the FBM-D, FBM-S, and FBM-N was 73.10%, 28.91%, and 13.47% higher than the test values, respectively. The additional cohesion of the soil provided by the roots was calculated to be 25.90-45.06 kPa using the modified WWM, 67.05-38.15 kPa using the FBM-S, and 57.24-32.74 kPa using the FBM-N. These results not only provide a theoretical basis for further quantitative evaluation of the mechanical effects of the root systems of herbaceous plant species in reinforcing the surface soil but also have practical significance for the effective prevention and control of thermal thaw slumping disasters in the permafrost regions containing native alpine meadows on the Qinghai-Xizang Plateau using flexible plant protection measures.

1 Introduction

The Qinghai-Xizang Plateau in China, with its vast permafrost regions, faces secondary freeze-thaw disasters such as frost heave mounds, hot melt lakes, and heat melting slumps (Wu et al., 2007). Permafrost degradation, driven mainly by climate change, leads to frequent thermal thawing, frost heaving, and freeze-thaw disasters in frozen slopes, particularly in areas with fragile ecology (Yang et al., 2010; Niu et al., 2015; Luo et al., 2018). Thaw slumping, a common type of landslide in the permafrost regions, exhibits a creep rate exceeding typical landslides and develops cyclically with annual temperature changes, posing a major challenge to slope stability (Luo et al., 2019). Thaw slumping destroys the alpine meadow layer and exposes the surface, forming psoriasis landforms. In addition, the disruption of the soil water and heat balance by permafrost thawing releases carbon, various chemicals, and even heavy metals, such as mercury, which can significantly impact the regional climate, water resources, and overall eco-environment (St. Pierre et al., 2018; Barry et al., 2023; Zhou et al., 2023). Luo et al. (2014) have created a comprehensive catalog of 875 thaw slumping hazards in the permafrost region of the Qinghai-Xizang Plateau. Thus far, thaw slumping on the Qinghai-Xizang Plateau has been identified on PlanetScope CubeSat images using DeepLab V3+ (Xia et al., 2022). The Qinghai-Xizang Plateau is prone to thaw slumping disasters (Luo et al., 2014), but this phenomenon can be minimized by various means, including revegetation.
Numerous studies have shown that vegetation roots can enhance shallow slope stability (Schwarz et al., 2012; Leung et al., 2015; Lann et al., 2024). Vegetation revetment stabilizes slopes by leveraging the water conservation and soil consolidation properties of plant roots (Gong et al., 2024). Due to its low cost and minimal environmental impact, vegetation revetment promotes ecological conservation (Hu et al., 2009). Researchers have found that plant roots can increase soil shear strength and internal friction in thaw slumping areas, highlighting their benefits in stabilizing slopes and preventing thaw slumps (Wang et al., 2024a, b). Therefore, plant restoration is urgently needed to effectively control and avoid thaw slumping disasters in the permafrost regions on the Qinghai-Xizang Plateau.
The major challenge in evaluating slope stability enhancement through revegetation is how to determine the additional cohesion in root-reinforced soil. Commonly used approaches include comparing root-soil composites with root-free soils (Zhu et al., 2022), establishing calculation models for root-soil composites (Wang et al., 2024c), and utilizing numerical simulations to develop and analyze root-soil composite models (Li et al., 2022). The calculations of these models, which are closely related to the mechanical properties of roots, are central to the primary theoretical models—particularly the Wu-Waldron Model (WWM) and the Fiber Bundle Model (FBM)—designed to assess the shear strength of root-soil composites. Previous research on root mechanical properties has primarily focused on the relationship between the root diameter and tensile characteristics of individual roots (Lin et al., 2024). However, studies addressing the uneven distribution of root diameters and the variability of tensile properties among individual roots remain limited (Fu et al., 2014; Mao et al., 2018; Sun et al., 2023).
In spite of its wide use, the WWM often overestimates the additional cohesion of the soil provided by plant roots, necessitating correction of the calculated results (Zhu et al., 2014; Hao et al., 2023a). Zhu et al. (2014) found that the WWM overestimated shear strength by 90.00%, suggesting that a correction coefficient of 0.63 is needed. By calculating the additional cohesion of the soil provided by Robinia pseudoacacia and Platycladus orientalis at various soil depths on the Loess Plateau of China, Ji et al. (2017) found the correction coefficients for the WWM and FBM to be 0.63 and 0.60, respectively. The additional cohesion of the soil provided by Medicago sativa in its different growth stages in loess region was determined by comparing the results of the WWM to establish a functional relationship between the model's correction parameters and plant growth cycle (Mao et al., 2023). Although the WWM has been improved, its correction parameters remain inconsistent. Thus, empirical correction coefficients must be re-determined for different regions and plant species, requiring repeated experiments to ensure accuracy (Zhou et al., 2012; Zhou et al., 2022).
The FBM has been used in material science to simulate fiber mechanics and applied to root-soil composites to study root fracture properties (Pollen and Simon, 2005). Although it accounts for the differential fracturing of roots based on varying tensile strengths in examining root fracture mechanisms, the specific fracture sequence of the root bundles remains a controversial topic (Hao et al., 2023a). Bischetti et al. (2009) calculated the root cohesion of trees such as Fagus sylvatica and Picea abies in northern Italy using the FBM, which assumes that each fiber in the root bundle carries an equal force. Their results showed that root cohesion ranged from 4.12 to 110.00 kPa at 5 cm soil depth and from 2.40 to 20.00 kPa at 30 cm depth. Based on the mechanical reinforcement effect of Salix viminalis on soil, Mickovski et al. (2009) suggested using equal stress on the cross-sectional area in the FBM calculations. In assessing slope stability under mixed growth and woody plants, such as Abies alba, Picea abies, and Fagus sylvatica, the FBM produced lower values than the uncorrected WWM under all fracture modes aligning more closely with actual conditions, but each model considers different root fracture modes (Mao et al., 2012). The accuracy of the FBM can be significantly enhanced by incorporating continuous root changes when calculating the strength of plant roots and their ability to improve soil shear strength (Meijer, 2021).
Thus far, few studies have explored the role of herbaceous plant roots in the alpine meadow layer in enhancing soil shear strength in the permafrost regions, in particular the shear strength of root-reinforced soils in thermal thaw slumping slopes and the mechanical mechanisms by which roots inhibit shallow slope deformation and failures. In this study, we focused on thaw slumping slopes in a permafrost region on the Qinghai-Xizang Plateau. Through tensile tests on single roots and groups of roots, we evaluated the contribution of the roots of the dominant herbaceous plant species in the native alpine meadow layer to inhibiting thaw slumping development. The WWM and FBM were then used to calculate the additional cohesion of soil provided by the plant roots and its ability to enhance soil shear strength. We also explored a theoretical model for evaluating the shear strength of the soil provided by the plant roots in the alpine meadow layer of the permafrost region and its surroundings. The results help improve the prevention and control of thaw slumping slope disasters in the permafrost regions on the Qinghai-Xizang Plateau, providing theoretical and practical guidance for quantifying the role of plant roots in enhancing soil shear strength in high-altitude areas.

2 Materials and methods

2.1 Study area

In this research, the study area (92°53′38"E, 34°43′37"N; Fig. 1) was defined as the distribution zone of slopes characterized by thaw slumping, located in Beiluhe area on the Qinghai-Xizang Plateau, Zhidoi County, Yushu Tibetan Autonomous Prefecture, Qinghai Province, China. From the perspective of geomorphologic distribution, the region is located on the Hoh Xil alluvial and diluvial high plain. This thermal thaw slumping distribution area is situated in a permafrost region at 4760 m a.s.l. The thickness of the permafrost in this area ranges from approximately 50 to 80 m, and the active layer is 2-3 m thick (Yin et al., 2017; Zhang et al., 2020). The region is characterized by an arid, cold climate. The average annual temperature is -5.2°C, with temperatures exceeding 0.0°C from May to September. The average annual precipitation is 290.9 mm, concentrated from June to August, accounting for over 80.00% of the annual total. The average annual evaporation is 1316.9 mm (Gao et al., 2018). The dominant plant species in the alpine meadow layer include Kobresia pygmaea, Kobresia humilis, Carex moorcroftii, Littledalea racemosa, Poa annua, Leontopodium pusillum, and Stipa purpurea (Niu et al., 2019b).
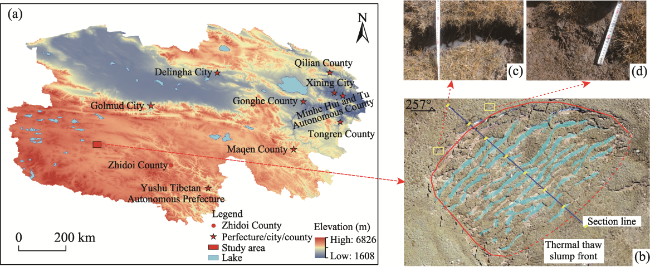
Fig. 1 Location of the study area (a) and development range and tensile crack distribution characteristics of the selected thermal thaw slump slope, including (b) thermal thaw slumping distribution area, (c) formation of tensile cracks (4 cm depth), and (d) continuous tensile cracks (10 cm depth)

2.2 Selection and preparation of test materials

The selected thaw slumping region in the study area has a northwest-southeast orientation, a length of 21 m, a maximum width of 70 m, and a slope gradient of 8°. As shown in Figure 1, tensile cracks have formed in the back wall of the slump due to its slumping. In situ observations revealed that these cracks, mainly located along the trailing edge and boundaries, are arc-shaped, and the plant roots in these cracks remain in a tensile state (Fig. 1c and d).
Due to the high altitude, the active layer of the permafrost region only melts during the months from May to October, and at the same time, the alpine meadow layer becomes active again. The sampling of this study was conducted in September 2023. To investigate the mechanical strengths of the herbaceous plant roots in the alpine meadow layer, we collected root-soil composite samples from the vicinity of meadow cracks with a depth of 30-40 cm. The sampling process followed a strict procedure (Fig. 2). First, the meadow crack areas were selected as sampling sites due to their ability to reflect the natural state of the meadow ecosystem. Along the side of the crack, root-soil composites were extracted using a soil auger to collect cubic meadow soil samples (Fig. 2a), with the sampling depth limited to 0-30 cm. We focused on the trailing edge of the slumped body to ensure representativeness and to fully reflect the distribution characteristics of the plant roots in the alpine meadow layer. A soil cutter was used as the sampling tool to ensure the uniformity and representativeness of the root-soil composite samples. The samples were all collected from the same crack, with samples being rectangular prisms approximately 30 cm×30 cm in size, and a total of 6 samples were collected. The collected root-soil composite samples were immediately sealed in plastic bags to prevent water loss and temperature fluctuations from affecting the samples. After they were transported to the laboratory, the root-soil composite samples were stored in a QX-300B low-temperature storage box (Qinyuan Group Co. Ltd., Ningbo, China) at 4.0°C for 24 h to maintain the sample stability. Although the tests were conducted at room temperature, the duration of the tests was kept short to effectively control the impact of temperature fluctuations on the results. The soil texture of the root-soil composite samples was silty clay. The leaves and seeds of the plants were identified and distinguished, and it was found that four types of dominant plant species are contained: Kobresia pygmaea, Kobresia humilis, Carex moorcroftii, and Leontopodium pusillum. The collected root-soil composite samples were placed in a 2.00 mm sieve and washed until only the plant roots remained. The roots were then air-dried before the tensile tests (Fig. 2b and c). Root samples (≥180 roots for single root tensile tests and ≥2080 roots for root group tensile tests) were randomly selected, irrespective of their species, age, and viability, to conform to the root system composition and assess their mechanical properties under natural conditions.
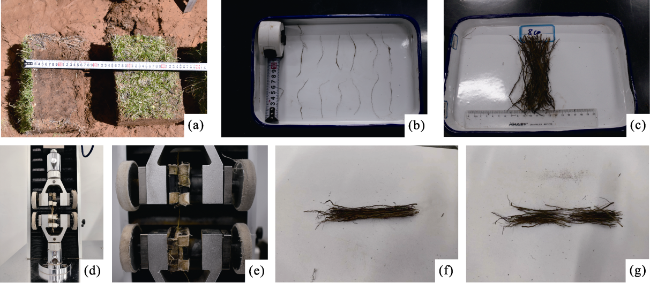
Fig. 2 Photos showing field sampling, root sample preparation, and testing procedure. (a), field sampling; (b), root preparation; (c), root samples; (d), universal testing machine; (e), tensile test process; (f), group root before tensile test; (g), group root after tensile test.

2.3 Tensile tests of individual roots

The tensile tests of individual roots were conducted using an HY-0580 microcomputer-controlled electronic universal testing machine (Shanghai Hengyi Precision Instrument Co., Ltd., Shanghai, China) (Fig. 2d), which allows the output of resistance-displacement curves on the computer (with tensile displacement on the x-axis and tensile force on the y-axis), thereby obtaining the peak tensile force of the roots. The root samples were chopped into 6-10 cm segments for testing. Only the segments with an intact epidermis were selected, and their diameters was measured. Each root segment was clamped between the upper and lower fixtures of the testing machine with a gauge length of 20.00 mm and a loading rate of 20.00 mm/min. The test was automatically terminated when the root segment fractured, and then the fractured root was replaced for the next test set. This testing procedure was repeated 180 times. The reading at the fracture position in the middle of the two fixtures was considered valid. If the root fractures near the position where the fixtures are applied, the test data are considered invalid. The maximum tensile force and corresponding tensile length were recorded, from which the tensile strength (tr; MPa), tensile ratio (ε; %), and tensile modulus (Er; MPa) of each individual root were calculated using Equations 1-3, respectively (Fu and Li, 2020; Fu et al., 2021).
t r = 4 R r π d r 2 ,
ε = Δ l l × 100 % ,
E r = t r 0.01 ε ,
where Rr represents the maximum tensile force of a single root (N); dr denotes the diameter of the plant root (mm); Δl indicates the elongation under axial tension (mm); and l refers to the original length of the root system subjected to axial tension (mm), specifically the gauge width set between the upper and lower fixtures.

2.4 Tensile tests of root groups

To study the tensile force and additional cohesion of the soil provided by the plant roots during the formation and development of tensile cracks at the trailing edge of the thaw slumping, we conducted tests on root groups containing various quantities of roots. Initially, the roots were cut into segments ranging from 5 to 8 cm in length. Only root segments with an intact epidermis were retained for testing (Fig. 2f). To investigate the relationship between the root quantity and tensile force, we bundled fresh root samples into n groups (n=64), with each group containing one more root than the previous group, and the diameters of all roots in each group were measured and recorded. The tensile performance of each root group was tested following the same protocol for the individual roots described above. The only difference was that the test was terminated when the force-displacement curve approached the x-axis, allowing for the determination of the maximum tensile force of the root group.

2.5 Calculation of the additional cohesion of the soil provided by the plant roots

The root tensile values of individual roots and root groups for the dominant herbaceous plant species were calculated using the root-soil models in the WWM and FBM (Mao et al., 2023) and were compared with the test values, from which the additional cohesion of the soil provided by the plant roots was calculated to assess the roots' contribution to the soil shear strength. The two models are described below.

2.5.1 WWM

Initially proposed by Waldron (1977) and Wu et al. (1979), the WWM is grounded in the Mohr-Coulomb theorem. This model considers the strength of root-enhanced soil as the additional cohesion of the soil (Fu et al., 2014). However, the original WWM assumes that all roots fracture simultaneously, which is rarely true in reality; hence, this model tends to overestimate the roots' contribution to soil shear strength. Despite this defect, the WWM is still widely used due to its relatively small number of parameters and straightforward calculation of the additional cohesion of the soil provided by the plant roots as follows (Fu et al., 2014; Hao et al., 2023a):
$\Delta S=k \frac{F_{\mathrm{WWM}}}{A}=k \frac{\sum_{i=1}^{N}\left(t_{r}\right)_{i} \times\left(A_{r}\right)_{i}}{A}=k \sum_{i=1}^{N}\left(t_{r}\right)_{i} \times R A R_{i},$
k = sin θ + cos θ tan φ ,
where ∆S is the additional cohesion of the soil provided by the plant roots (kPa); k is the angle correction parameter that converts the root tensile force into the shear force of the root-soil composite during the shear process; FWWM denotes the tensile strength provided by the roots (N), which is the sum of the tensile strengths of all individual roots crossing the shear plane calculated using the WWM; A is the shear area (mm2); N represents the number of roots intersecting the shear plane; (tr)i is the average shear strength of the ith root (MPa); (Ar)i denotes the cross-sectional area of the ith root (mm2); RAR is the ratio of the root cross-sectional area to the shear surface area, defined as the ratio of (Ar)i to A (Hao et al., 2023a); and θ and ϕ represent the angle between the root and shear surface, and the internal friction angle of the soil, respectively. Although k varies with shear deformation, its range of change is relatively small, so it is typically assigned a fixed value of 1.2.

2.5.2 FBM

To effectively address the overestimation issue of the WWM, the root-soil model to be developed must better reflect the differential fracturing of the roots under real conditions. For example, Pollen and Simon (2005) introduced the FBM to calculate the additional cohesion of the soil provided by the plant roots, focusing specifically on the reinforcement effect of the roots on riverbanks. This model assumes that when the roots are perpendicular to the shear surface, the load is evenly distributed among them. As the load increases, the weaker roots fail first, causing the load they carried to be redistributed to the remaining intact roots. This process continues until all of the roots are fractured (Schwarz et al., 2012). In constructing the model, Pollen and Simon (2005) did not account for the conversion ratio between the root tensile force and soil shear force. Instead, they opted to directly convert the root tensile force into the additional cohesion of the soil provided by the plant roots (Hao et al., 2023a). Therefore, by retaining the angle correction parameter k proposed by Waldron (1977), this study introduced this parameter into the model of Ji et al. (2020) to derive the equation for calculating the shear strength of root-soil composites in vertical shear planes:
Δ S = k F FBM A ,
where FFBM represents the maximum tensile force calculated using the FBM, with the unit in N.
Comparing Equations 4 and 6 reveals that the differences in the calculation results of the two models (WWM and FBM) arise from the maximum tensile force of the root groups. Therefore, to evaluate the applicability of the two models, we compared the maximum tensile forces calculated using both models and the tensile force obtained from tests of root groups. The maximum tensile force that different individual roots can withstand varies with their inherent properties, and as a result, the roots in a group will likely fracture successively instead of simultaneously (Mao et al., 2023). When using the FBM to calculate the tensile strength of root groups, two key factors must be determined: the failure strength of a single root and the load distribution mode among root groups (Meijer, 2021). Based on the tensile test results for a single root, the distribution characteristics of the maximum tensile strength relative to the root diameter can be established. However, it is challenging to design a reasonable test for determining the load distribution mode when the root groups are stretched, so it is simplified by applying three hypotheses. The first hypothesis (FBM-D) states that in the tensile strength test of root groups, the tensile force on each single root is proportional to its diameter relative to the total sum of all the root diameters (Zhou et al., 2012). The second hypothesis (FBM-S) posits that during the tensile strength test of individual roots, the cross-sectional stress in the root bundle is uniform, implying that the load is distributed proportionally to the cross-sectional area of each root to the total cross-sectional area, and fractures occur in the root with the lowest tensile strength first (Pollen and Simon, 2005). The third hypothesis (FBM-N) assumes that each tensile strength test of individual roots experiences an equal load when the root of groups is loaded, leading to the breakage of the weakest root first (Hao et al., 2023a). The maximum tensile strength of the root groups in the FBM, derived under different load distribution modes, can be calculated as follows (Hao et al., 2023a):
F FBM D = MAX i = 1 N ( t r ) i × ( A r ) i j = i n d j d i ,
F FBM S = MAX i = 1 N ( t r ) i j = i n ( A r ) j ,
F FBM N = MAX i = 1 N j = i n ( t r ) j × ( A r ) j ,
where FFBM-D, FFBM-S, and FFBM-N represent the maximum tensile force calculated using the FBM-D, FBM-S, and FBM-N, respectively, with the unit in N; di represents the diameter of the ith root (mm); dj represents the diameter of the remaining intact root corresponding to the root with diameter di when it reaches its ultimate tensile strength, where j is the index (mm); (Ar)j denotes the tensile strength of the remaining intact root corresponding to the root with diameter di when it reaches its ultimate tensile strength, where j is the index (MPa); and (Ar)j denotes the cross-sectional area of the remaining intact root corresponding to the root with diameter di when it reaches its ultimate tensile strength, where j is the index (mm2). The value of (tr)i was determined using the fitting function that describes the relationship between the tensile strength and root diameter, derived from the tensile tests of individual roots.

2.5.3 Errors in the root-soil model calculations and simplification of model calculations

The calculation error in the WWM and FBM primarily arises from the different assumptions regarding the root fracturing sequence (Hao et al., 2023a). Based on Equations 4 and 5 for the WWM and Equations 7-9 for the FBM involving three different fracturing sequence assumptions, we assumed identical conditions for converting the root tensile force into the additional cohesion of the soil provided by the plant roots. Specifically, the shear surface area and the angle correction parameter were considered the same. Under these conditions, only the maximum tensile force of the root groups was calculated, and the tensile test results of the root groups were compared. This approach was used to assess the applicability of the WWM and FBM in estimating the additional cohesion of the soil provided by the plant roots in the alpine meadow layer in the study area. In this study, the overestimation effect of the WWM in the calculations was explored. The applicability of the FBM under different root fracture sequence assumptions in estimating the additional cohesion of the soil provided by the plant roots was also investigated. To achieve this, under the same shear surface conditions, tensile tests were conducted on different numbers of root group to determine the actual maximum tensile force at the point of fracturing in the root bundle. In the calculations, the root diameter was derived from the actual statistical data, and the corresponding tensile strength of single root was calculated using the fitting function obtained from the tensile strength tests of individual roots.
To address the overestimation caused by the WWM's assumption, empirical correction coefficient was proposed to adjust the calculation results (Mao et al., 2012):
Δ S = k × Δ S = k k F WWM A = k k i = 1 N ( t r ) i × ( A r ) i A = k k i = 1 N ( t r ) i × R A R i ,
where ∆S′ is the modified additional cohesion of the soil provided by the plant roots (kPa); and k′ is the empirical correction coefficient, defined in this study as the ratio of the actual group root test value to the linearly fitted slope of the maximum tensile force calculated from the WWM model.
Equations 7-9 all consider using the limit of the mechanical strength of the roots to determine the root fracturing mode (Mao et al., 2012). However, Schwarz et al. (2012) proposed that in the FBM, the root fracturing sequence should be determined based on when the tensile ratio reaches its limit, and the additional cohesive force should be calculated accordingly. Since roots are natural fibrous materials, their tensile strengths and tensile ratios are not perfectly linearly correlated with the root diameter; thus, the results obtained from the two models will inevitably differ. Therefore, in this study, as proposed by Schwarz et al. (2012), we corrected the results of the FBM by considering the limit of the tensile displacement. In tensile tests or meadow failure, the tensile displacement experienced by the roots is consistent, and it is possible for the maximum tensile displacement when thicker roots break to be smaller than the tensile displacement when finer roots break. In the root bundle, individual roots with a tensile ratio lower than the root group's tensile ratio will break before the maximum tensile force is reached, and thus these roots do not contribute to the sharing of the maximum tensile force by the root group. Therefore, the portion of the roots in the root group tensile test, whose own stretching ratio is smaller than the stretching ratio corresponding to the maximum tensile strength in the test, should be subtracted from Equations 7-9 as follows:
F FBM = F FBM × 1 F ( a ) ,
where F FBM , represents the fiber bundle model calculation formula (N), which is related to root diameter after modification; a is the root group tensile ratio, which can be determined by the tensile ratio of the maximum tensile force obtained from the root group tests; and F(a) is the cumulative probability function for the root group tensile ratio a.
In addition, Fu et al. (2021) demonstrated that the root diameter of fully developed plant roots follows a stable distribution pattern. The statistical analysis conducted in this study further confirms that the root diameter distribution in the alpine meadow layer is similarly stable. Based on this observation, it is suggested that the probability density function of the root diameter distribution can be used as a proxy for the actual root diameter distribution in the traditional WWM and FBM calculations. The control formula is as follows:
i N = d i φ ( t ) d t ,
where φ(t) represents the probability density function of the root diameter; and t represents the possible root diameter (mm).

2.6 Statistical analysis

The calculation processes of the WWM and the FBM were completed using custom formulas in Excel. All of the experimental data and calculation results were first input into an Excel file and then imported into Origin 2022 software for further analysis. Statistical analysis of the tensile test data was performed using the statistical module in Origin 2022, and the data from the individual tensile tests were fitted using the Levenberg-Marquardt iteration algorithm via the analysis module in Origin 2022. All of the relevant charts and curves in this study were plotted in Origin 2022 to ensure clear visualization and accurate presentation of the results.

3 Results

3.1 Distribution characteristics of tensile cracks

Field investigations revealed a significant relationship between the formation of tensile cracks in the alpine meadow layer and the occurrence of thermal thaw slumps. We divided tensile crack development into four stages based on crack width, continuity, root distribution, and position relative to the back wall of the landslide (Fig. 3).
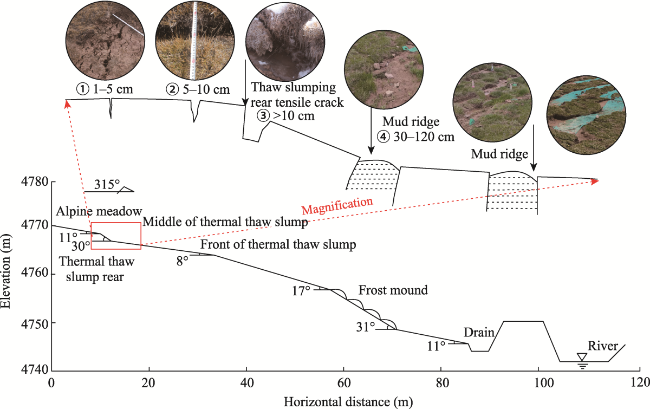
Fig. 3 Development of tensile cracks at the trailing edge of thermal thaw slump slope in the study area, along with the tensile crack characteristics at different development stages. This figure is modified from the work of Wang et al. (2024b) and supplemented with additional relevant results from this study.
In the early stage, fine cracks (1-5 cm width) appear intermittently in the original alpine meadow layer above the back wall of the thermal thaw slump. In the middle stage, tensile fractures (5-10 cm width) form as the thermal thaw landslide retreats, leading to the formation of a new back wall. Most plant roots within these cracks are broken, but some remain intact. As the slump continues to expand, the cracks increase both in scale and depth, causing the collapse of the original alpine meadow layer. In the third stage, cracks wider than 10 cm appear in the back wall and surrounding areas, and there are no interconnected roots. The cracks begin to creep downward, leading to the formation of a new slump. In the final stage, cracks with 30-120 cm width are developed in the slumped body, and the underlying soil is compressed by the weight of the upper alpine meadow layer, leading to the formation of mud ridges (Wang et al., 2024a). The plant roots only influence the cracking during the early and middle stages, during which the crack width remains within 10 cm and the roots prevent the original alpine meadow layer from collapsing. The development of these tensile cracks is closely aligned with the retreat and expansion of the thermal thaw slump.

3.2 Tensile tests of individual roots

3.2.1 Relationship between the root diameter and single root tensile properties

The relationships between the root diameter and tensile properties of individual roots (single root tensile force, tensile strength, tensile ratio, and tensile modulus) reportedly follow power functions (Schwarz et al., 2012; Zhu et al., 2014; Wang et al., 2024b). Therefore, a power function with the form of y=adb (where y represents the tensile properties of individual roots, d is the root diameter, and a and b are the fitting parameters) was employed to nonlinearly fit the relationships between the root diameter and individual root tensile properties (Fig. 4). The absolute Pearson correlation coefficient (r) of the relationship of root diameter with single root tensile force, single root tensile strength, and single root tensile modulus, exceed 0.60, indicating strong or significant correlations. Further analysis of the fitting relationships revealed that there is a positive power function relationship between the root diameter and single root tensile force (Fig. 4a), and there are negative power function relationships of root diameter with single root tensile strength and tensile modulus (Fig. 4b and d). Figure 4c shows that the power function relating root diameter and single root tensile ratio has a very low goodness of fit (R2=0.004), with the r value of only 0.06, indicating that there is no power function relationship between these two parameters. In addition, the scatterplot of root diameter and single root tensile ratio does not exhibit any definite trend, implying that there is no meaningful relationship between them.
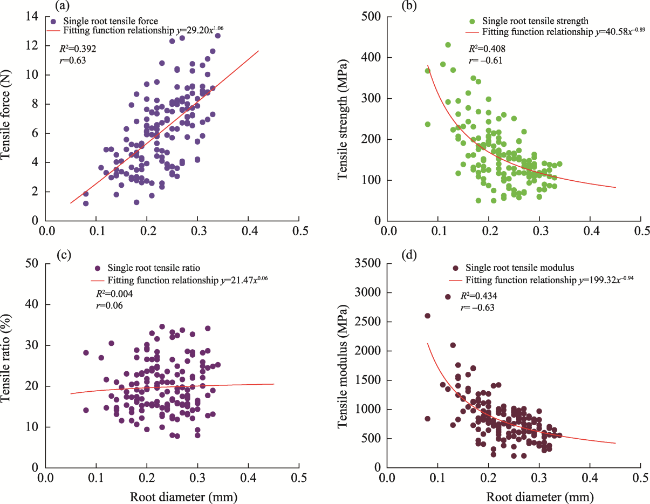
Fig. 4 Tensile test results of individual roots in the alpine meadow layer of the study area and their fitting relationships with root diameter. (a), root diameter versus single root tensile force; (b), root diameter versus single root tensile strength; (c), root diameter versus single root tensile ratio; (d), root diameter versus single root tensile modulus. R2 is the goodness of fit, and r is the Pearson correlation coefficient.

3.2.2 Frequency distribution of root properties

The statistics of root diameter and single root tensile properties were compiled, as shown in Table 1. A probability histogram was also plotted based on the root diameter and tensile properties of individual roots, as shown in Figure 5. The histogram of the single root tensile properties exhibits a bell-shaped distribution, with higher frequencies in the middle and lower frequencies at the ends. Normal, Weibull, and log-normal distributions were used to fit parameters including root diameter, single root tensile force, single root tensile strength, single root tensile ratio, and single root tensile modulus (Table 2). Due to the unimodal distribution of the data, the R2 values for the three distribution functions are relatively good, indicating that plant roots exhibit relatively stable statistical patterns.
Table 1 Test results of root diameter and single root tensile properties for the dominant plant species in the alpine meadow layer of the study area
Statistic Root diameter (mm) Singe root tensile force (N) Singe root tensile strength (MPa) Singe root tensile ratio (%) Singe root tensile modulus (MPa)
Minimum 0.08 1.19 49.90 7.79 201.88
Maximum 0.34 12.68 431.20 34.59 2928.35
Median 0.23 6.30 140.50 19.11 781.43
Average 0.23 6.19 158.19 19.74 841.85
Standard deviation 0.06 2.54 71.63 6.16 394.75
Coefficient of variation 24.46 40.96 45.28 31.18 46.89
Skew coefficient -0.28 0.25 1.19 0.45 1.94
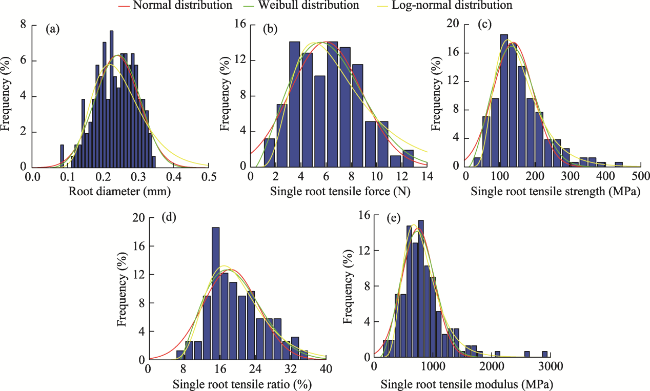
Fig. 5 Probability density histograms and fitting curves for root diameter and single root tensile properties of dominant plant species in the alpine meadow layer of the study area. (a), root diameter; (b), single root tensile force; (c), single root tensile strength; (d), single root tensile ratio; (e), single root tensile modulus.
Table 2 Fitting results of different distribution functions for root diameter and single root tensile properties of dominant plant species in the alpine meadow layer of the study area
Fitting
function
Fitting function parameter Root
diameter
Singe root
tensile force
Singe root
tensile strength
Singe root
tensile ratio
Singe root
tensile modulus
Normal distribution μ 0.24 5.97 138.28 18.36 746.83
σ 0.07 2.83 56.96 6.28 275.35
R2 0.813 0.858 0.932 0.663 0.940
Weibull distribution α 21.83 6.67 5.97 7.09 7.55
β 3.60 2.26 2.50 2.14 2.68
u 4.49 0.40 0.50 3.49 1.00
R2 0.809 0.875 0.943 0.705 0.93
Log-normal distribution μ 0.24 6.49 146.04 18.93 775.37
σ - 0.53 10.42 0.67 37.00
R2 0.742 0.859 0.965 0.787 0.960

Note: In the normal distribution and log-normal distribution, μ is the mean value and σ is the variance. In the Weibull distribution, α is the scale parameter, β is the shape parameter, and u is the position parameter. R2 is the goodness of fit. '-' means that the value is less than 0.01.

The statistics presented in Tables 1 and 2 indicated that the average root diameter is 0.23 mm, with a standard deviation of 0.06 mm, reflecting a slightly negatively skewed distribution (skewness coefficient of -0.28). The mean value of the fitted normal distribution is 0.24 mm, with a variance of 0.07 mm and a R2 value of 0.810 (Table 2), which is in good agreement with the actual statistics (Fig. 5a). The R2 for the single root tensile force of the Weibull distribution is the highest; and the R2 of the single root tensile strength, single root tensile ratio, and single root tensile modulus is highest for the log-normal distribution, with values of 0.97, 0.79, and 0.96, respectively. These results indicate that the normal distribution effectively describes the root diameter distribution pattern of the four dominant plant species in the alpine meadow layer.

3.3 Tensile force-displacement curves of the plant roots and their characteristics

In the root group tensile tests, the load-sharing mechanism of individual roots is uncertain. Specifically, when a root bundle is subjected to tensile forces, the stress experienced by each individual root may not be uniform (Mao et al., 2012). Consequently, in this study, we focused on analyzing the curve that depicts the relationship between the overall tensile force and the tensile displacement of the root group system to determine the maximum tensile force that the root group system can provide.
On the single root tensile stress-strain relationship curve, four stages can be identified: OA, AC, CH, and H′, where O represents the root begins to straighten and undergo elastic deformation, A represents the start of plastic deformation, C represents the yield point reached, H represents the root fracture, and H′ represents the root cortex fractures (Fig. 6). Section OA is primarily linear, adhering to Hooke's law, indicating that the root epidermis and stele are in the elastic deformation stage. Section AC transitions into an arc shape, exhibiting characteristics of plastic deformation. During this stage, the single root enters the yield stage, and the root system shifts into the elastic-plastic deformation phase. After section CH, the stress continues to increase with increasing strain, demonstrating strain-hardening behavior. Upon reaching the maximum stress point H, the root fracturing results in a sudden change in the stress. Existing research indicated that although the plant root material is considered a uniform fiber substance, the tensile properties of the root cortex and the stele differ (Shi et al., 2023). In this study, this distinction is illustrated in Figure 6, which presents tensile stress-strain relationship curve II. When the root cortex fractures before the stele, the root system does not fail immediately; instead, the tensile stress-strain relationship curve displays a small peak change at point H′. At this moment, the load is redistributed to the stele, which has a higher strength, allowing the system to continue stretching until reaching the maximum tensile force at point H. Consequently, the tensile stress at point H is typically chosen as the maximum tensile force of a single root when calculating the strength of root-reinforced soil.
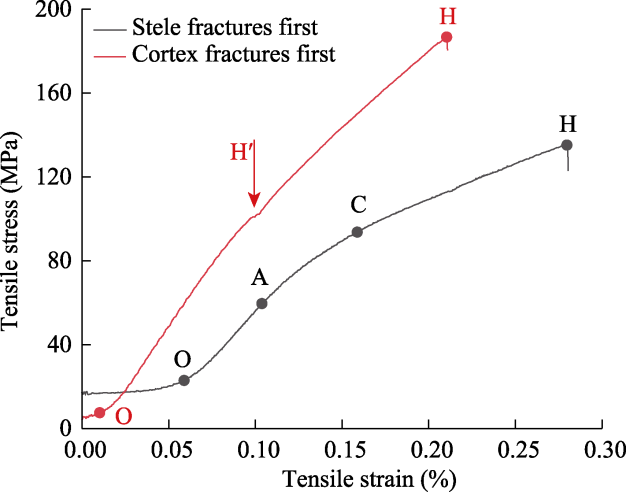
Fig. 6 Tensile stress-strain curves of individual roots from dominant plant species in the alpine meadow layer of the study area. O represents the root begins to straighten and undergo elastic deformation, A represents the start of plastic deformation, C represents the yield point reached, H represents the root fracture, and H′ represents the root cortex fractures. The vertical lines under point H represent the process of rapid stress reduction after root rupture.
Typical tensile force-displacement curves from the tensile tests on groups of 5 and 10 roots were selected to analyze the yield deformation and failure stages of the root groups (Fig. 7). During the root group tensile tests, the section from point O to point H1 (fracture of the first root in the root group) exhibits a circular or linear shape, and no distinct yield stage is observable. This occurs because, during the stretching of the root bundle, the tensile displacement needed for each individual root to reach its yield stage varies. Consequently, while some individual roots have yielded, others remain in the elastic deformation stage, masking the overall yield change of the root system. As a result, the tensile force-displacement curve lacks an obvious yield stage and exhibits strain hardening. Through further analysis of the relationship between tensile force and displacement at point H1 and beyond, it was found that when the weakest root in the root bundle reaches its load limit, the first peak (H1) is achieved, followed by the breaking of this root. The remaining roots then contribute to the sum of the tensile force, corresponding to point I1 (condition after the first root fracture in the root group). Since these remaining roots have not yet reached their maximum tensile forces, the tensile force continues to increase with further tensile displacement. This process continues until the next weakest root breaks, resulting in a new peak point H2 (fracture of the second root in the root group). This sequence is repeated until all of the roots in the group fail, generating a series of peak tensile forces throughout the testing process. According to the results of the single root tensile tests (Table 1), the average maximum tensile force of the single root tested is 6.19 N. By contrast, the maximum tensile force of a bundle of five roots measured during the root group tensile tests is represented by peak point H2, and the stress value is 13.70 N. For the group of 10 roots, the corresponding maximum tensile force of 25.70 N corresponds to point H3 (the fracture of the third root in the root group is also the moment when the group root experiences the maximum tensile force). This peak is significantly lower than the cumulative average maximum tensile force of individual roots. This indicates that when roots are grouped into bundles, their overall maximum tensile force is lower than the sum of the maximum tensile forces of individual roots. This discrepancy arises because the roots tend to break successively rather than simultaneously.
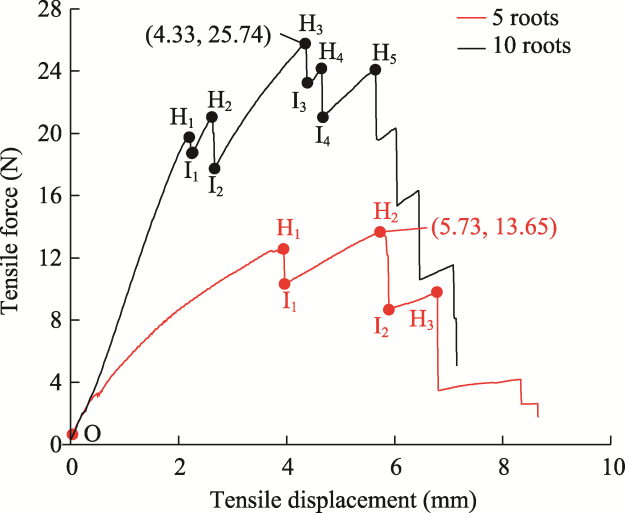
Fig. 7 Typical tensile force-displacement curves from the tensile tests on groups of 5 and 10 roots. Hi, fracture of the ith root in the root group; Ii, condition after the ith root fractures in the root group. The values in the parentheses indicate the coordinate of maximum tensile displacement and force of the root group.
As shown in Equation 4, evidently, the sum of the tensile forces of the individual roots that pass through the shear surface is divided by the shear surface area of the soil to determine the additional cohesion of the soil provided by the roots. Specifically, the sum of the tensile forces of all the individual roots crossing the shear surface is considered the maximum tensile force provided by the root bundle. By contrast, the curve of the relationship between the tensile force and displacement obtained from the root group tensile tests reveals that the root system does not exhibit simultaneous fracturing; rather, it breaks gradually (Fig. 7). As a result, when the root bundle is stretched, a series of peaks appear on the tensile force-displacement curve. These peaks correspond to the redistribution of the stress to the remaining intact roots following the failure of an individual root in the bundle.

3.4 Maximum tensile strength of root groups

3.4.1 Comparison and verification of test and model results

The results of the test tensile force values of root groups and the model calculated results are presented in Figure 8. The tensile force of the root group increases linearly as the number of roots in the group increases. However, the model calculated tensile force values are higher than the test values. The fitted results of the linear relationship between the tensile force from the root group tensile tests and the model calculated tensile force along with the number of roots are shown in Table 3. The tensile force calculated by the FBM-N is relatively close to the test tensile force value, and the model calculated result is 57.60% higher than the test value. The FBM-S achieves the second-best result, and the model calculated value is 79.00% higher than the test value. The FBM-D yields a result 140.42% higher than the test value. Finally, the WWM result is 162.60% higher than the test value.
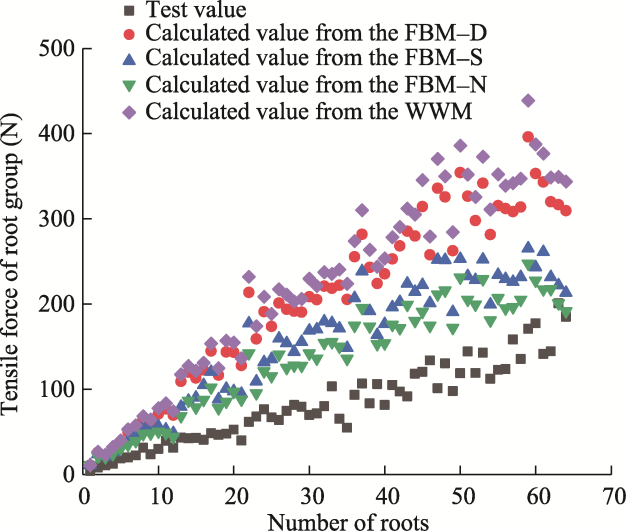
Fig. 8 Comparison between the test tensile force values of root groups and the model calculated tensile force values of root groups obtained from the WWM (Wu-Waldron Model) and three fracture modes in the FBM (Fiber Bundle Model). FBM-D, the tensile force on each single root is proportional to its diameter relative to the total sum of all the root diameters; FBM-S, the cross-sectional stress in the root bundle is uniform; FBM-N, each tensile strength test of individual roots experiences an equal load.
Table 3 Fitting results of the tensile force values of root groups from tests and three fracture modes in the FBM along with the number of roots
Fitting function relationship (y=mx) Tensile force test Three fracture modes in the FBM
FBM-D FBM-S FBM-N WWM
m 2.54 6.11 4.55 4.01 6.68
r 0.99 0.99 0.99 0.99 0.99
R2 0.98 0.98 0.97 0.98 0.98

Note: y is the tensile force; x is the number of roots; m is the fitting function parameter; r is the Person correlation coefficient. FBM-D, the tensile force on each single root is proportional to its diameter relative to the total sum of all the root diameters; FBM-S, the cross-sectional stress in the root bundle is uniform; FBM-N, each tensile strength test of individual roots experiences an equal load.

3.4.2 Correction of model results

It can be seen from Figure 8 that the tensile values calculated using the FBM are relatively superior to those obtained using the WWM when the empirical correction coefficient is not considered. However, both sets of model calculated results still have a certain degree of deviation from the test values.
Figure 9 illustrates the relationship between the root group tensile ratio and the number of roots of the four dominant plant species in the alpine meadow layer. Evidently, the root group tensile ratio decreases as the number of roots increases and gradually converges to a specific value of 15.50% during the root tensile ratio test. After calculating the proportion of the roots with a tensile ratio lower than the critical threshold of 15.50%, this proportion was substituted into Equation 11, yielding the corrected results that account for the tensile displacement limitations. Figure 5d shows that the probability distribution of the single root tensile ratio follows a log-normal distribution. Therefore, in the calculation using Equation 11, the cumulative probability density function of the root tensile ratio was selected as the log-normal distribution. The calculation formula is as follows:
F ( α ) = α 0 1 2 π σ ε e ln ε μ 2 2 σ 2 d ε ,
where α denotes the critical tensile ratio based on the results from the single root tensile test; σ is the variance; μ is the mean value; and ε is the possible tensile ratio of the root group. The variance and mean values are presented in Table 2.
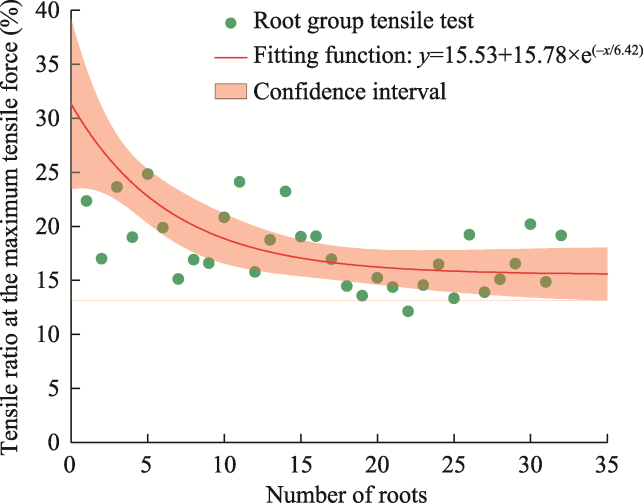
Fig. 9 Relationship between the root group tensile ratio at the maximum tensile force and the number of roots in the root group tensile tests. For the fitted equation, y is the root group tensile ratio, and x is the number of roots.
Figure 10 presents the cumulative distribution function of the single root tensile ratio. By plugging the critical tensile ratio of 15.50% into this cumulative function, F(α) was found to be 0.28. That is, 28.00% of the roots in the single root tensile tests have root tensile ratios lower than the critical tensile ratio. Thus, F(α) of 0.28 was input into Equation 11 to obtain the maximum tensile force results (Fig. 11) and the linear fitting results (Table 4) for each hypothesis of the modified FBM.
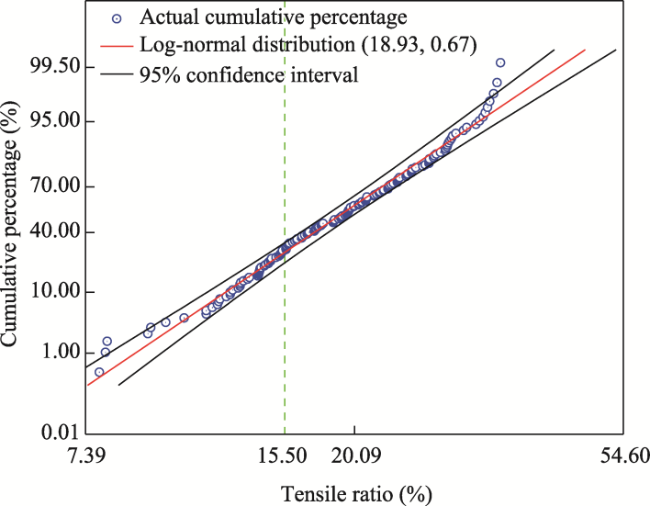
Fig. 10 Cumulative curve fitting of log-normal distribution for single root tensile ratio
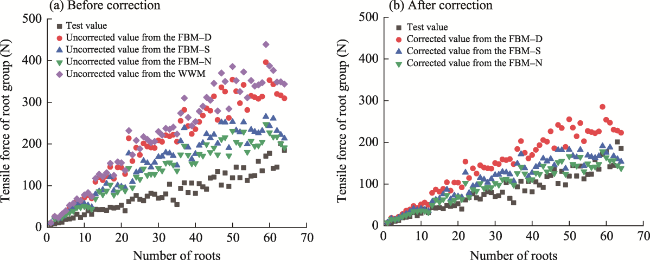
Fig. 11 Theoretical tensile force values calculated from the FBM considering tensile displacement correction. (a), before correction; (b), after correction.
Table 4 Fitting results of the tensile force values of root groups from tests and three fracture modes in the modified FBM along with the number of roots
Fitting function relationship (y=mx) Tensile force test Three fracture modes in the modified FBM
FBM-D FBM-S FBM-N
m 2.54 4.40 3.27 2.88
r 0.99 0.99 0.99 0.99
R2 0.98 0.98 0.97 0.98
The maximum tensile force of the root group after correction is still higher than the test value. The theoretical values calculated using the FBM-D, FBM-S, and FBM-N deviate from the test tensile forces of the root group by 73.10%, 28.91%, and 13.47%, respectively. Compared with the pre-corrected FBM results, the accuracy is significantly improved. The FBM-S and FBM-N results are all less than 30.00% under the assumption of the three root fracture sequences in the FBM by comparing the test values. These results demonstrate that both models (FBM-S and FBM-N) are highly accurate and are applicable in calculating the additional cohesion of the soil provided by the roots of the dominant plant species in the alpine meadow layer in the study area.

3.5 Evaluation of additional cohesion of plant roots

As shown in Figure 8 and Table 3, the tensile results from the tests and models exhibit a significant linear relationship with the number of roots (r>0.80). Therefore, the empirical correction coefficient for the WWM can be determined from the ratio of the actual root group tensile test value to the model calculated value using the WWM. In this way, the determined correction coefficient primarily serves to correct the error arising from the assumption of simultaneous root failure.
The distribution of the individual roots follows a normal distribution N(0.24, 0.07) (Fig. 12), with R2 of 0.810. When the root sample size is expanded to 6045, the root diameter follows a normal distribution N(0.24, 0.08), with R2 of 0.970. This indicates that the normal distribution can fully describe the root system in the alpine meadow layer, which helps simplify the process of calculating the cohesive force of the roots. Based on this finding, the statistical root diameter distribution can be used as a proxy for the actual root diameter distribution. Consequently, we found that the root diameter distribution satisfies the following equation:
i N = d i 1 2 π σ e ( t μ ) 2 2 σ 2 d t ,
where μ and σ represent the mean and standard deviation of the root diameter distribution, respectively; di is the root diameter of the ith root; N is the number of roots passing through the shear plane, which is derived from field statistics; and t is the possible root diameter.
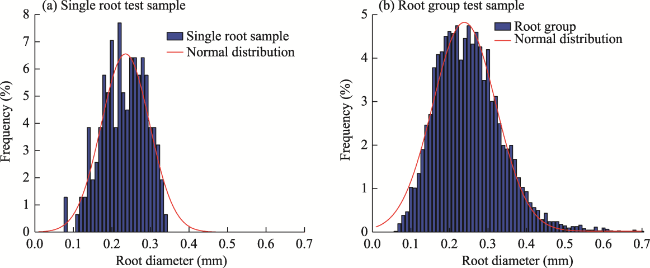
Fig. 12 Statistical comparison of root diameter frequency distributions for single root tensile tests (a) and root group tensile tests (b)
The cross-sectional area of the alpine meadow layer and the number of roots passing through the shear plane in the study area, which were obtained through field surveys (Zhang et al., 2023), were combined with the test results to calculate the additional cohesion of the soil provided by the plant roots in the alpine meadow layer. The results of these calculations are presented in Table 5.
Table 5 Calculated results of the additional cohesion of the soil provided by the plant roots
A (cm2) Number of roots passing through the shear plane Theoretical additional cohesion calculated by the model (kPa)
WWM before correction WWM after correction FBM-S after correction FBM-N after correction
48 81 130.84 41.43 65.38 55.78
86 139.02 44.02 69.40 59.22
88 142.29 45.06 70.99 60.61
76 122.66 38.84 61.43 52.34
144 176 95.43 30.22 47.02 40.40
165 89.43 28.32 44.11 37.87
151 81.80 25.90 40.39 34.67
172 93.25 29.53 45.96 39.48

Note: The empirical correction parameter k′ in the model is 0.38, calculated by dividing the WWM's overestimation ratio.

The additional cohesion of the soil provided by the plant roots calculated using the corrected WWM ranges from 25.90 to 45.06 kPa. In comparison, the additional cohesion calculated using the FBM-S ranges from 40.39 to 70.99 kPa. The FBM-N yields a range of 34.69-60.61 kPa. In summary, the additional cohesion of the soil provided by the plant roots, as calculated using the three models (WWM, FBM-S, and FBM-N), is generally high. This indicates that the roots of the dominant plant species play a significant role in enhancing the shear strength of the original meadow soil and improving its structural stability.

4 Discussion

4.1 Correlation between tensile ratio and root diameter of individual roots

Numerous studies have explored the relationships of root diameter with tensile force and tensile ratio via single root tensile tests and have often fitted them to a power function (Schwarz et al., 2013; Giadrossich et al., 2017; Chen et al., 2022; Rossi et al., 2022). Consistent with these findings, the root tensile force, tensile strength, and root diameter of the four dominant plant species in the alpine meadow layer in our study area also follow a power function relationship (Fig. 4a and b). However, the R2 of the power function between the root diameter and tensile ratio is only 0.004, and the r value is only 0.06, indicating that there is virtually no correlation between the root diameter and tensile ratio (Fig. 4c). This lack of correlation may be due to the inherent variability of the root system properties, such as the tensile strength and tensile ratio, which exhibit discrete distributions due to the natural variability of the root systems (Fu et al., 2021). Another potential reason is that the roots of different plant species were not differentiated from each other in the tests, which may result in the weak correlation between the root diameter and tensile ratio.
The primary factor influencing the growth of the plant species in the alpine meadow is climate change (Niu et al., 2019a; Zhang et al., 2019). Statistical analysis of the root diameters reveals that the dominant plant species exhibit a stable distribution in the alpine meadow layer of the permafrost region. Consequently, the root diameter probability density function derived in this study reflects the growth characteristics of the dominant plant species to some extent. The FBM was used to compute the additional cohesion of the soil provided by the plant roots based on the root diameter distribution and to determine the fracturing order of the roots based on various root-sharing force assumptions, followed by cohesion calculations (Hao et al., 2023a). The frequency statistics of the root diameter, tensile force, tensile strength, and tensile ratio simplify the calculation formulas, yielding more accurate theoretical results. It is crucial to select an appropriate model function in statistical analysis as it directly impacts the accuracy and reliability of the calculated results (Su et al., 2001; Wu, 2015). For single root properties such as diameter, tensile strength, and tensile ratio, in this study, we referred to prior research on natural material fitting functions for rocks and soils (Niu et al., 2019a; Fu and Li, 2020; Fu et al., 2021), and chose three density distribution functions (normal, Weibull, and log-normal) to analyze the root diameter and tensile property distributions. For instance, Fu et al. (2021) concluded that root diameter follows a normal distribution, while root tensile strength and tensile ratio follow log-normal and Weibull distributions, which are consistent with the results of this study, even though the parameters were calculated using different methods.

4.2 Determination of empirical correction parameters for the WWM and correction of the FBM considering the tensile displacement limitation

Of the four stages of the mechanical behavior of plant roots identified on the single root tensile stress-strain relationship curve (Fig. 6), the peak tensile force marks the root fracturing point, which aligns with the deformation and failure stage observed in the tensile tests conducted on Caragana korshinskii (6-14 years old) in the loess region of the Xining Basin, China (Shi, 2023). The WWM assumes that when the root-soil composite is subjected to stress, the roots passing through the shear surface break simultaneously (Fu et al., 2014). According to the tensile force-displacement curve for the root group tensile test (Fig. 7), the mechanical behavior of the root group fracturing does not conform to the assumptions of the WWM. The test results also show that there is a positive linear correlation between the maximum tensile force and root diameter, indicating that an empirical correction factor is needed to adjust the calculation results of the WWM. This factor can be selected using several methods, typically based on the shear tests that account for factors such as root fracture sequence, shear surface angle, and root-soil friction (Mao et al., 2012; Wang et al., 2015; Ji et al., 2017; Hao et al., 2023b; Gong et al., 2024). In this study, the empirical correction factor is derived from the root group tensile test results, which address the calculation errors arising from differences in the root fracturing behavior, thereby improving the accuracy of the theoretical model predictions.
Previous research on root fracturing in the FBM has mainly focused on two factors: the mechanical properties of the roots and the tensile displacement limits (Mao et al., 2012). Based on these properties, several calculation methods for the FBM have been proposed (Pollen and Simon, 2005; Bischetti et al., 2009; Mickovski et al., 2009; Mao et al., 2012; Hao et al., 2023a). Schwarz et al. (2012) introduced displacement constraints in the FBM by applying continuous displacement to a bundle of several parallel roots, which led to root fracturing. While this approach does not account for the maximum tensile strength of the roots, it serves as a valuable supplement to the FBM calculations (Hao et al., 2023a). In this study, Equations 7-9 are derived from the maximum tensile failure of the root system (Mao et al., 2012). Building upon this, we further incorporated the tensile displacement limitations when deriving Equation 10 to refine the results of the FBM. Consequently, the additional cohesion of the soil provided by the plant roots, as calculated by the FBM, considers both the maximum tensile force and the tensile displacement limits of the root system.

4.3 Differences between model calculation results and root group test results

The main reason for the bias introduced by the WWM is that the model assumes that root breakage occurs simultaneously and that the maximum tensile strength of each root is accumulated, which does not align with the actual root breakage behavior. In reality, root breakage does not occur simultaneously. As a result, the value calculated using the WWM exceeds the test value by 162.60%. It should be noted that similar findings have been reported in related studies (Zhu et al., 2014; Ji et al., 2017; Mao et al., 2023). For example, Zhu et al. (2014) conducted direct shear tests on root-soil composite samples containing six common plant species in the Jinyun Mountain area of Chongqing, China and found that their experimental results deviated by 90.00% compared with the values obtained using the WWM.
The calculation of the FBM is based on the assumption that the roots break at the ultimate tensile stress, which requires that there is a linear relationship between the root tensile ratio and tensile strength without considering the discreteness of tensile ratios. Specifically, when Equations 7-9 for the FBM were used to conduct the calculations, some of the roots that did not break reached the ultimate tensile ratio based on the tensile strength.
To correct this problem, we applied a tensile ratio correction according to the single root tensile test results and used Equations 11 and 13. After this correction, the results of the FBM-N, FBM-S, and FBM-D exceeded the test value by 13.47%, 28.91%, and 73.10%, respectively. The deviation in the FBM-N and FBM-S is mainly due to the fact that, although we accounted for root breakage at the ultimate stress and used function fitting based on the single root tensile tests (which assumes that there is a significant functional relationship between the root tensile strength and root diameter), this method partially masked some of the root tensile data, leading to deviation from the test results. In addition, in the correction process of the FBM (Section 3.4.2), although the tensile ratio correction was considered and the tensile ratios corresponding to the maximum tensile strength of the root group were fitted, a lower boundary value near the limit was applied. However, since the root group tensile tests only included 64 sets, the tensile ratio correction value used was smaller than the actual test value, resulting in an overestimated correction result. It should be noted that the above analysis is an exploration of the potential reasons for the deviation based on the model calculated data, and it may not cover all of the influencing factors.

5 Conclusions and recommendations

To address the ecological slope stabilization needs for frequent shallow landslides in the permafrost regions of the Qinghai-Xizang Plateau, this study investigated the shear-strengthening mechanisms of roots from dominant alpine meadow species through root tensile tests and comparative analyses of reinforcement models (WWM, FBM-S, and FBM-N), aiming to quantify root contributions to soil stability. The main conclusions of this study are summarized as follows.
The root group displacement-force curve and tensile tests indicated that the root fracturing behavior assumed in the WWM is inconsistent with actual observations, with the calculated additional cohesion of the soil provided by the plant roots being higher than the actual test tensile value. The sequence of root fracturing should be reasonably determined based on the assumptions of the FBM-S and FBM-N, which are more suitable for calculating the cohesion of the roots from the dominant plant species in the alpine meadow layer. In the permafrost regions on the Qinghai-Xizang Plateau, the root systems of herbaceous plant species in the alpine meadow layer show a stable distribution, with root diameters following a normal distribution. Model calculations reveal that the roots of dominant plant species can provide substantial additional cohesion, significantly enhancing the soil's shear strength and improving the stability of the soil structure.
Therefore, all construction activities in this region should prioritize the protection of native meadows to prevent secondary thaw-induced disasters. For damaged areas, ecological restoration projects should be implemented, with a focus on selecting dominant herbaceous plant species that are suitable for growth in the region's arid alpine environment and possess well-developed root systems. In addition, the selected species should provide significant additional cohesion to the soil, thereby improving the strength of the soil in plant growth zones and enhancing the shallow stability of the slopes.

Conflict of interest

The authors declare that they have no known competing financial interests or personal relationships that could have appeared to influence the work reported in this paper.

Acknowledgements

This work was supported by the Qinghai Science and Technology Department Project (2025-QY-225), the National Natural Science Foundation of China (42267024), and the Second Comprehensive Scientific Investigation and Research Project of the Qinghai–Xizang Plateau (2019QZKK0905). We thank all the anonymous reviewers and editors for providing helpful comments for this manuscript.

Author contributions

Conceptualization: HE Dequan, HU Xiasong; Methodology: HE Dequan, LU Haijing; Field test guidance: WANG Chen, LIU Changyi; Indoor test guidance: XING Guangyan, LIU Changyi, ZHAO Jimei; Indoor tests and investigation: HE Dequan, ZHAO Yingxiao, LI Shuaifei, DENG Taiguo; Writing - original draft preparation: HE Dequan; Writing - review and editing: HU Xiasong, LU Haijing. All authors approved the manuscript.
[1]
Barry K R, Hill T C, Moore K A, et al. 2023. Persistence and potential atmospheric ramifications of ice-nucleating particles released from thawing permafrost. Environmental Science & Technology, 57(9): 3505-3515.

[2]
Bischetti G B, Chiaradia E A, Epis T, et al. 2009. Root cohesion of forest species in the Italian Alps. Plant and Soil, 324: 71-89.

[3]
Chen Y, Tang H, He B H, et al. 2022. Root tensile strength of terrace hedgerow plants in the Karst trough valleys of SW China: Relation with root morphology and fiber content. International Soil and Water Conservation Research, 10(4): 677-686.

[4]
Fu J T, Li G Y, Hu X T, et al. 2014. Research status and development tendency of vegetation effects to soil reinforcement and slope stabilization. Journal of Engineering Geology, 22(6): 1135-1146. (in Chinese)

[5]
Fu J T, Li X K. 2020. Statistical analysis of root mechanical properties of Elymus nutans. Mountain Research, 38(6): 894-903. (in Chinese)

[6]
Fu J T, Li X K, Liu C Y, et al. 2021. Impact of gauge length on the tensile mechanical indices of roots for Elymus nutans based on statistical theory. Chinese Journal of Rock Mechanics and Engineering, 40(S2): 3399-3413. (in Chinese)

[7]
Gao Z Y, Niu F J, Lin Z J, et al. 2018. Evaluation of thermokarst lake water balance in the Qinghai-Tibet Plateau via isotope tracers. Science of the Total Environment, 636: 1-11.

[8]
Giadrossich F, Schwarz M, Cohen D, et al. 2017. Methods to measure the mechanical behaviour of tree roots: A review. Ecological Engineering, 109: 256-271.

[9]
Gong C G, Ni D Z, Liu Y N, et al. 2024. Herbaceous vegetation in slope stabilization: A comparative review of mechanisms, advantages, and practical applications. Sustainability, 16(17): 7620, doi: 10.3390/su16177620.

[10]
Hao G L, Wang L G, Liu X F. 2023a. Methods for studying the effect of plant roots on soil mechanical reinforcement: A review. Journal of Soil Science and Plant Nutrition, 23(3): 2893-2912.

[11]
Hao G L, Wang L G, Liu X F, et al. 2023b. Geometric distribution characteristics and mechanical reinforcement effect of herbaceous plant roots at different growth periods. Soil and Tillage Research, 229: 105682, doi: 10.1016/j.still.2023.105682.

[12]
Hu X S, Li G R, Zhu H L, et al. 2009. Research on interaction between vegetation root and soil for slope protection and its mechanical effect in cold and arid environments. Chinese Journal of Rock Mechanics and Engineering, 28(3): 613-620. (in Chinese)

[13]
Ji J N, Tian J, Qu W B. 2017. Determination of correction coefficients of Wu's Model of root cohesion based on successive fracture process. Scientia Silvae Sinicae, 53(11): 170-178. (in Chinese)

[14]
Ji J N, Mao Z, Qu W B, et al. 2020. Energy-based fibre bundle model algorithms to predict soil reinforcement by roots. Plant and Soil, 446: 307-329.

[15]
Lann T S, Bao H, Lan H X, et al. 2024. Hydro-mechanical effects of vegetation on slope stability: A review. Science of the Total Environment, 926: 171691, doi: 10.1016/j.scitotenv.2024.171691.

[16]
Leung F T, Yan W M, Hau B C, et al. 2015. Root systems of native shrubs and trees in Hong Kong and their effects on enhancing slope stability. CATENA, 125: 102-110.

[17]
Li P C, Xiao X P, Wu L Z, et al. 2022. Study on the shear strength of root-soil composite and root reinforcement mechanism. Forests, 13(6): 898, doi: 10.3390/f13060898.

[18]
Lin Y Z, Jian W B, Zhu Z T, et al. 2024. Study on the mechanical properties of roots and friction characteristics of the root-soil interface of two tree species in the coastal region of Southeastern China. Forests, 15(8): 1285, doi: 10.3390/f15081285.

[19]
Luo J, Niu F J, Lin Z J, et al. 2014. Development of thawing hazards and thermal influence on permafrost along Qinghai-Tibet engineering corridor. Journal of Engineering Geology, 22(2): 326-333. (in Chinese)

[20]
Luo J, Niu F J, Lin Z J, et al. 2019. Recent acceleration of thaw slumping in permafrost terrain of Qinghai-Tibet Plateau: An example from the Beiluhe region. Geomorphology, 341: 79-85.

[21]
Luo L H, Ma W, Zhuang Y L, et al. 2018. The impacts of climate change and human activities on alpine vegetation and permafrost in the Qinghai-Tibet engineering corridor. Ecological Indicators, 93: 24-35.

[22]
Mao Z, Saint-Andre L, Genet M, et al. 2012. Engineering ecological protection against landslides in diverse mountain forests: choosing cohesion models. Ecological Engineering, 45: 55-69.

[23]
Mao Z, Wang Y, McCormack M L, et al. 2018. Mechanical traits of fine roots as a function of topology and anatomy. Annals of Botany, 122(7): 1103-1116.

[24]
Mao Z J, Bi Y L, Geng M M, et al. 2023. Pull-out characteristics of herbaceous roots of alfalfa on the loess in different growth stages and their impacts on slope stability. Soil and Tillage Research, 225: 105542, doi: 10.1016/j.still.2022.105542.

[25]
Meijer G J. 2021. A generic form of fibre bundle models for root reinforcement of soil. Plant and Soil, 468: 45-65.

[26]
Mickovski S B, Hallett P D, Bransby M F, et al. 2009. Mechanical reinforcement of soil by willow roots: impacts of root properties and root failure mechanism. Soil Science Society of America Journal, 73(4): 1276-1285.

[27]
Niu F J, Lin Z J, Lu J H, et al. 2015. Assessment of terrain susceptibility to thermokarst lake development along the Qinghai-Tibet engineering corridor, China. Environmental Earth Sciences, 73: 5631-5642.

[28]
Niu F J, Gao Z Y, Lin Z J, et al. 2019a. Vegetation influence on the soil hydrological regime in permafrost regions of the Qinghai-Tibet Plateau, China. Geoderma, 354: 113892, doi: 10.1016/j.geoderma.2019.113892.

[29]
Niu Y J, Yang S W, Zhou J W, et al. 2019b. Vegetation distribution along mountain environmental gradient predicts shifts in plant community response to climate change in alpine meadow on the Tibetan Plateau. Science of the Total Environment, 650: 505-514.

[30]
Pollen N, Simon A. 2005. Estimating the mechanical effects of riparian vegetation on stream bank stability using a fiber bundle model. Water Resources Research, 41(7): W07025, doi: 10.1029/2004WR003801.

[31]
Rossi R, Picuno P, Fagnano M, et al. 2022. Soil reinforcement potential of cultivated cardoon (Cynara cardunculus L.): First data of root tensile strength and density. CATENA, 211: 106016, doi: 10.1016/j.catena.2022.106016.

[32]
Schwarz M, Cohen D, Or D. 2012. Spatial characterization of root reinforcement at stand scale: theory and case study. Geomorphology, 171-172: 190-200.

[33]
Schwarz M, Giadrossich F, Cohen D. 2013. Modeling root reinforcement using a root-failure Weibull survival function. Hydrology and Earth System Sciences, 17(11): 4367-4377.

[34]
Shi C, Liang S, Liu Y B, et al. 2023. Research on tensile resistance characteristics of single root of Caragana korshinskii Kom. in loess region of northeastern Qinghai-Tibet Plateau. Research of Soil and Water Conservation, 30(5): 184-192. (in Chinese)

[35]
St. Pierre K A, Zolkos S, Shakil S, et al. 2018. Unprecedented increases in total and methyl mercury concentrations downstream of retrogressive thaw slumps in the western Canadian Arctic. Environmental Science & Technology, 52(24): 14099-14109.

[36]
Su Y H, He M C, Sun X M. 2001. Approach on asymptotic approximations of polynomials for probability density function of geotechnics random parameters. Chinese Journal of Geotechnical Engineering, 23(1): 117-119. (in Chinese)

[37]
Sun D Z, Jiang F Y, Wu H H, et al. 2023. Root location and root diameter estimation of trees based on deep learning and ground-penetrating radar. Agronomy, 13(2): 344, doi: 10.3390/agronomy13020344.

[38]
Waldron L J. 1977. The shear resistance of root-permeated homogeneous and stratified soil. Soil Science Society of America Journal, 41(5): 843-849.

[39]
Wang C, Hu X S, Lu H J, et al. 2024a. Study on shear characteristics of herbs plant root-soil composite system in Beiluhe permafrost regions under freeze-thaw cycles, Qinghai-Tibet Highway, China. Sustainability, 16(7): 2907, doi: 10.3390/su16072907.

[40]
Wang C, Hu X S, Lu H J, et al. 2024b. Study on the mechanical effect of vegetation protection of thaw slumping slope in permafrost area of Beiluhe region along the Qinghai-Tibet highway. Journal of Engineering Geology, 32(3): 1057-1068. (in Chinese)

[41]
Wang X Q, Zhou H L, Tong J H. 2024c. Shear characteristics of root-matrix composites under various interface friction and moisture content conditions. Rhizosphere, 31: 100944, doi: 10.1016/j.rhisph.2024.100944.

[42]
Wang Y, Zhao T Y, Cao Z J. 2015. Site-specific probability distribution of geotechnical properties. Computers and Geotechnics, 70: 159-168.

[43]
Wu Q B, Zhou S Y, Ma W, et al. 2007. Qinghai-Xizang railroad construction in permafrost regions. Journal of Cold Regions Engineering, 21(2): 60-67.

[44]
Wu T H, McKinnell III W P, Swanston D N. 1979. Strength of tree roots and landslides on Prince of Wales Island, Alaska. Canadian Geotechnical Journal, 16(1): 19-33.

[45]
Wu X Z. 2015. Modelling dependence structures of soil shear strength data with bivariate copulas and applications to geotechnical reliability analysis. Soils and Foundations, 55(5): 1243-1258.

[46]
Xia Z X, Huang L C, Fan C Y, et al. 2022. Retrogressive thaw slumps along the Qinghai-Tibet Engineering Corridor: A comprehensive inventory and their distribution characteristics. Earth System Science Data Discussions, 14(9): 3875-3887.

[47]
Yang M, Nelson F E, Shiklomanov N I, et al. 2010. Permafrost degradation and its environmental effects on the Tibetan Plateau: A review of recent research. Earth-Science Reviews, 103(1-2): 31-44.

[48]
Yin G A, Niu F J, Lin Z J, et al. 2017. Effects of local factors and climate on permafrost conditions and distribution in Beiluhe basin, Qinghai-Tibet Plateau, China. Science of the Total Environment, 581-582: 472-485.

[49]
Zhang C, Zhang D W, Deng X G, et al. 2019. Various adaptations of meadow forage grasses in response to temperature changes on the Qinghai-Tibet Plateau, China. Plant Growth Regulation, 88: 181-193.

[50]
Zhang P H, Lu H J, Hu X S, et al. 2023. Mechanical effect of plant roots in alpine meadow along Wudaoliang-Tuotuo River section of Qinghai-Tibet highway. Acta Agrestia Sinica, 31(9): 2805-2813. (in Chinese)

[51]
Zhang X F, Zhang H, Wang C, et al. 2020. Active layer thickness retrieval over the Qinghai-Tibet Plateau using Sentinel-1 multitemporal InSAR monitored Permafrost subsidence and temporal-spatial multilayer soil moisture data. IEEE Access, 8: 84336-84351.

[52]
Zhou M, Shuai F, Chen L B, et al. 2022. Impact of Dicranopteris linearis roots on the shear strength of different soil layers in collapsing wall of Benggang. European Journal of Soil Science, 73(6): e13317, doi: 10.1111/ejss.13317.

[53]
Zhou W T, Ma T, Yin X F, et al. 2023. Dramatic carbon loss in a permafrost thaw slump in the Tibetan Plateau is dominated by the loss of microbial necromass carbon. Environmental Science & Technology, 57(17): 6910-6921.

[54]
Zhou Y Y, Chen J P, Wang X M. 2012. Progress of study on soil reinforcement mechanisms by root and its expectation. Ecology and Environment Sciences, 21(6): 1171-1177. (in Chinese)

[55]
Zhu J Q, Wang Y Q, Wang Y J, et al. 2014. Analysis of root system enhancing shear strength based on experiment and model. Rock and Soil Mechanics, 299(2): 449-458. (in Chinese)

[56]
Zhu J Q, Mao Z, Wang Y J, et al. 2022. Soil moisture and hysteresis affect both magnitude and efficiency of root reinforcement. CATENA, 219: 106574, doi: 10.1016/j.catena.2022.106574.

文章导航

/