• WANG Qingxue 1, 2 ,
  • MA Yonggang , 2, 3, 4, 5, * ,
  • XU Zhonglin 1, 2, 4 ,
  • LI Junli 6, 7, 8
展开

收稿日期: 2024-11-27

  修回日期: 2025-03-12

  录用日期: 2025-03-27

  网络出版日期: 2025-08-13

Accuracy assessment of cloud removal methods for Moderate-resolution Imaging Spectroradiometer (MODIS) snow data in the Tianshan Mountains, China

  • WANG Qingxue 1, 2 ,
  • MA Yonggang , 2, 3, 4, 5, * ,
  • XU Zhonglin 1, 2, 4 ,
  • LI Junli 6, 7, 8
Expand
  • 1College of Ecology and Environment, Xinjiang University, Urumqi 830046, China
  • 2Xinjiang Key Laboratory of Oasis Ecology, Xinjiang University, Urumqi 830046, China
  • 3College of Geography and Remote Sensing Sciences, Xinjiang University, Urumqi 830046, China
  • 4Xinjiang Jinghe Observation and Research Station of Temperate Desert Ecosystem, Ministry of Education, Urumqi 830046, China
  • 5Key Laboratory of Oasis Ecology of Education Ministry, Urumqi 830046, China
  • 6Key Laboratory of Ecological Safety and Sustainable Development in Arid Lands, Xinjiang Institute of Ecology and Geography, Chinese Academy of Sciences, Urumqi 830011, China
  • 7University of Chinese Academy of Sciences, Beijing 100049, China
  • 8Key Laboratory of GIS & RS Application, Xinjiang Uygur Autonomous Region, Urumqi 830011, China
*MA Yonggang (E-mail: )

Received date: 2024-11-27

  Revised date: 2025-03-12

  Accepted date: 2025-03-27

  Online published: 2025-08-13

本文引用格式

WANG Qingxue , MA Yonggang , XU Zhonglin , LI Junli . [J]. Journal of Arid Land, 2025 , 17(4) : 457 -480 . DOI: 10.1007/s40333-025-0098-3

Abstract

Snow cover plays a critical role in global climate regulation and hydrological processes. Accurate monitoring is essential for understanding snow distribution patterns, managing water resources, and assessing the impacts of climate change. Remote sensing has become a vital tool for snow monitoring, with the widely used Moderate-resolution Imaging Spectroradiometer (MODIS) snow products from the Terra and Aqua satellites. However, cloud cover often interferes with snow detection, making cloud removal techniques crucial for reliable snow product generation. This study evaluated the accuracy of four MODIS snow cover datasets generated through different cloud removal algorithms. Using real-time field camera observations from four stations in the Tianshan Mountains, China, this study assessed the performance of these datasets during three distinct snow periods: the snow accumulation period (September-November), snowmelt period (March-June), and stable snow period (December-February in the following year). The findings showed that cloud-free snow products generated using the Hidden Markov Random Field (HMRF) algorithm consistently outperformed the others, particularly under cloud cover, while cloud-free snow products using near-day synthesis and the spatiotemporal adaptive fusion method with error correction (STAR) demonstrated varying performance depending on terrain complexity and cloud conditions. This study highlighted the importance of considering terrain features, land cover types, and snow dynamics when selecting cloud removal methods, particularly in areas with rapid snow accumulation and melting. The results suggested that future research should focus on improving cloud removal algorithms through the integration of machine learning, multi-source data fusion, and advanced remote sensing technologies. By expanding validation efforts and refining cloud removal strategies, more accurate and reliable snow products can be developed, contributing to enhanced snow monitoring and better management of water resources in alpine and arid areas.

1 Introduction

Snow cover is a critical natural resource and an essential variable in climate studies. It has long been a central focus in global climate change research and Earth surface process studies. The Moderate-resolution Imaging Spectrometer (MODIS), mounted on the Terra and Aqua satellites, provides high-frequency and high-resolution data. Its powerful data acquisition capabilities make it an essential source for studying global and regional snow cover dynamics (Li et al., 2019; Zhang et al., 2022b). Nevertheless, the utility of MODIS snow data is constrained by inherent limitations, chiefly cloud coverage, which persistently interferes with snow observations. Studies indicate that the global average frequency of completely cloud-free sky coverage is only 20.70% (Eastman et al., 2021). Clouds and shadows complicate the accurate retrieval of ground information, leading to errors in snow spectral data extraction and presenting significant challenges in snow data analysis.
In recent years, a variety of algorithms have been developed to enhance MODIS cloud-free snow datasets through time-series analysis, spatial feature extraction, and multi-source data fusion, each tailored to specific regional conditions and snow characteristics (Zhang et al., 2016; Liu et al., 2017). Time-series approaches include maximum-value compositing from Terra and Aqua observations (Parajka and Blöschl, 2008), near-day synthesis methods (Dietz et al., 2013) and multi-day combination techniques (Parajka and Blöschl, 2008), which improve temporal continuity. Spatial methods exploit the spatial autocorrelation of snow cover to interpolate cloud-contaminated pixels based on surrounding clear-sky observations (Tong et al., 2009a, b). More advanced spatiotemporal strategies, such as those on the basis of the spatiotemporal data cube, have also been proposed to more effectively eliminate cloud contamination (Chen et al., 2020). To reduce elevation-induced misclassification, several studies have combined snow-elevation models with snowline extraction techniques (Parajka et al., 2010; Thirel et al., 2011; Burgos et al., 2013) or applied altitude-based gradient methods (Gafurov and Bárdossy, 2009; Gurung et al., 2011; Huang et al., 2012). In certain regions, classification techniques on the basis of distinguishing "perennial snow" from "snow-free land" have been employed to improve snow detection accuracy (Painter et al., 2012; Qiu et al., 2017). Furthermore, multi-source fusion methods—integrating optical, microwave, and ground-based observations—have shown promise in improving both the spatial completeness and accuracy of cloud removal (Liang et al., 2008; Wang and Che, 2012; Bergeron et al., 2014; Deng et al., 2015; Wang et al., 2016; Yu et al., 2016).
Traditional methods for cloud removal have evolved from basic interpolation to more advanced reconstruction algorithms. Early efforts primarily relied on simple interpolation techniques, such as cubic spline interpolation (Tang et al., 2013, 2017, 2022; Li et al., 2020). These methods have since evolved into more sophisticated approaches, such as image reconstruction algorithms utilizing the variational interpolation theorem (Xia et al., 2012), which enable the automated generation of daily cloud-free MODIS snow data. Recent advances have integrated temporal interpolation and spatiotemporal weighting with piecewise cubic Hermite interpolation to effectively fill data gaps in Normalized Difference Snow Index (NDSI) (Deng et al., 2024; Pan et al., 2024). Probabilistic modeling techniques, such as the Hidden Markov Random Field (HMRF) model, have also been employed to improve cloud removal accuracy by capturing the spatial and temporal continuity of snow cover (Huang et al., 2022).
In the current era of rapid advances in artificial intelligence, machine learning-based cloud removal algorithms have demonstrated remarkable potential for enhancing the accuracy and continuity of MODIS snow cover products. Chen et al. (2014) developed rule-based classification models incorporating multiple features—such as terrain, time, and cloud conditions—to further refine snow detection under cloud cover. Ensemble learning approaches, including extreme gradient boosting (Tian, 2023) and random forests (Liu et al., 2020), utilize decision tree frameworks to enhance predictive performance, particularly in complex terrain. The support vector machine has also been applied to classify snow-covered and snow-free areas with improved reliability (Qu and Ding, 2013). In parallel, deep learning techniques have gained attraction due to their powerful feature extraction capabilities. Convolutional neural networks have been used to automatically learn spatial features from satellite imagery (Xing et al., 2022; Zhang et al., 2022a), while recurrent neural networks, particularly their long short-term memory variants, are increasingly applied for time-series prediction of snow cover beneath clouds (Haq et al., 2022; Hou et al., 2022). These models exploit the temporal dependencies inherent in MODIS data, offering improved performance in dynamic snow environments.
The above-mentioned cloud removal methods depend on the temporal continuity of data and the stability of snow distribution and have limited adaptability to complex terrains. Therefore, understanding the reasons for the errors generated by various cloud removal algorithms during the cloud removal process can improve the accuracy of cloud removal methods and enhance the availability of cloud-free datasets.
In this study, we employed four publicly available daily cloud-free snow cover datasets—each generated from MODIS data using different cloud removal techniques—and validated their performance using time-matched images from four real-time cameras installed by our research team in the remote and uninhabited areas of the Tianshan Mountains, Xinjiang Uygur Autonomous Region (hereafter referred to as Xinjiang), China. Our objectives are to (1) evaluate the accuracy of these cloud-free products under both clear-sky and cloudy conditions; (2) assess their strengths and limitations across various environmental settings; and (3) analyze their performance in relation to terrain complexity and land cover heterogeneity. The findings of this study not only provide critical insights for improving cloud removal techniques in mountainous environments but also contribute to more accurate snow monitoring and enhance water resource management in alpine areas.

2 Study area and methods

2.1 Study area

The Tianshan Mountains, located in the central part of Xinjiang, form one of the most prominent mountain systems in Central Asia and act as a significant climatic and ecological divide. Stretching in an east-west orientation, the range of Tianshan Mountains is characterized by its complex topography, including high peaks, deep valleys, and extensive foothill zones (Hu, 2004). Under this geographical pattern, the climate of mountains and basins is quite different. A comprehensive analysis of the geographical characteristics of the Tianshan Mountains in central Xinjiang reveals fluctuating terrain, especially the complex arrangement of mountains and basins, posing challenges to snow cover research. The distribution of snow is intimately tied to terrain conditions, vegetation coverage, and climate changes; meanwhile, the undulating terrain significantly impacts the snow melting process. Thus, it is important to understand the accuracy of MODIS snow products in central Xinjiang.
Four real-time cameras were established in the uninhabited mid-to-high altitude areas of the Tianshan Mountains, central Xinjiang, China (Fig. 1; Table 1). The monitoring began in September 2016, with photography sessions primarily conducted between 09:00 and 16:00 (LST). The stations—Luotuobozi, Shuidian, Shenglidaoban, and Chahanwusu—were strategically located in sparsely populated or uninhabited mid- to high-altitude mountainous areas, minimizing the influence of human activity and enabling observation of natural snow and vegetation dynamics. These sites span a range of elevation zones from subalpine to alpine conditions, and encompass varied terrain types including grassland and barren or sparsely vegetated land. These real-time cameras provide essential data support for studying the natural environment and plant phenology in high-altitude uninhabited areas.
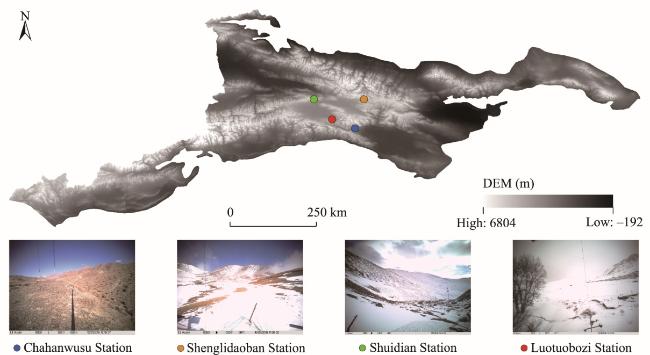
Fig. 1 Schematic diagram of the study area and locations of four real-time cameras observation stations. DEM, digital elevation model.
Table 1 Background information about the each real-time camera station
Station Geographic
coordinate
Elevation (m) Elevation type Monitoring period
(yyyy-mm-dd)
Surface
Luotuobozi Station 42°36′12′′N, 84°39′11′′E 2395.19 Mid- to high-altitude 2016-09-06-
2020-07-01
Grassland
Shuidian
Station
43°06′38′′N, 83°58′45′′E 2955.58 Mid- to high-altitude 2016-09-06-
2020-07-01
Grassland
Shenglidaoban Station 43°08′39′′N, 85°45′53′′E 3317.75 High-altitude 2016-09-06-
2018-05-05
Grassland
Chahanwusu Station 42°22′48′′N, 85°28′07′′E 1962.19 Mid- to high-altitude 2016-09-06-
2020-07-01
Barren or sparsely vegetated land

2.2 Datasets

2.2.1 Daily snow cover MODIS products

Four daily MODIS snow cover datasets were selected for accuracy assessment in this study. These datasets were derived using different cloud-removal algorithms on the basis of MODIS Terra and Aqua observations.
Dataset 1: MODIS/Terra CGF Snow Cover Daily L3 Global 500 m SIN Grid (MOD10A1F). This global Level-3 dataset provides a daily composite of snow cover and albedo derived from the MOD10A1 dataset. In this dataset, observation points covered by clouds in the current day's snow cover data are replaced with cloud-free points from the previous day. The snow cover variable CGF_NDSI_Snow_Cover ranges from 1 to 100, indicating the presence of snow, while 0 denotes no available snow information. To ensure consistency with the real-time camera observations, we extracted data covering the period from 6 September 2016 to 1 July 2020.
Dataset 2: Chinese MODIS Daily Cloudless 500 m Snow Cover Area Product Dataset, is provided by the National Cryosphere Desert Data Center (NCDC). This dataset is generated using a multi-index combined snow discrimination algorithm adapted for different land cover types. It utilizes MODIS surface reflectance products (MOD09GA and MYD09GA) and combines Terra and Aqua observations for initial cloud removal. Cloud gaps are subsequently filled using a Hidden Markov Random Field (HMRF) model, and microwave-derived snow depth products are integrated to further enhance spatial completeness (Hao et al., 2022). The dataset values include: 0 for land, 1 for satellite-detected snow, 2 for interpolated snow from cloud removal, and 3 for snow estimated from snow depth. In this study, values of 1, 2, and 3 were considered as snow cover. To ensure consistency with the real-time camera observations, we extracted data covering the period from 6 September 2016 to 1 July 2020.
Dataset 3: China's Cloud-Free MODIS NDSI Dataset (2001-2020), provided by NCDC, is generated from MOD10A1 and MYD10A1 using the Spatiotemporal Adaptive Fusion method with Error Correction (STAR) method, which integrates Spatiotemporal Adaptive Fusion (STAF) with Error Correction (EC) to eliminate clouds while preserving spatial heterogeneity in snow cover (Jing et al., 2022). The data values from 1 to 100 represent snow presence, while 0 indicates no snow information. To ensure consistency with the real-time camera observations, we extracted data covering the period from 6 September 2016 to 1 July 2020.
Dataset 4: Daily Snow Cover Extent Dataset over High Asia (2002-2018). This dataset is developed using MOD10A1 and MYD10A1 as source data and is tailored for high-altitude areas across Asia. A stepwise cloud-removal approach is employed, including a combination of MODIS Terra-Aqua observations, a 3-d consecutive composite, short-term minimum snow cover approach, an adjacent-pixel method, and an 8-d maximum land cover mask (NCDC, 2021). This process generates a daily low-cloud snow cover dataset for high-altitude areas in Asia. Snow values from 1 to 100 indicate the snow presence, 225 indicates snow-free information, and 250 indicates cloud cover. In this study, we extracted data covering the period from 6 September 2016 to 5 May 2018.

2.2.2 Classification of clear-sky and cloudy conditions

To evaluate the performance of different cloud-removal algorithms, it was essential to distinguish between clear-sky and cloudy conditions during the study period. This classification allowed for a stratified accuracy assessment of the four cloud-free MODIS snow cover products under distinct atmospheric conditions. We used the MODIS/Terra Snow Cover Daily L3 Global 500 m SIN Grid, Version 6.1 (MOD10A1) dataset to classify each observation day as either clear-sky or cloudy. In MOD10A1, pixels with values ranging from 0 to 100 represent valid snow cover information under clear-sky conditions, while a pixel value of 250 indicates cloud contamination. A day was classified as clear-sky if more than 90.00% of the pixels within a selected validation area (matching the real-time camera field of view) were marked as snow or land (i.e., values 0-100). Conversely, a day was classified as cloudy if more than 50.00% of the pixels in that area were flagged as cloudy (i.e., value 250).

2.2.3 Real-time camera observation data

Between 6 September 2016 and 1 July 2020, our research group established four outdoor camera observation points in the Tianshan Mountains, central Xinjiang (Fig. 1; Table 1). Among these, Shenglidaoban Station (3317.75 m) is located in a high-altitude area, while Luotuobozi (2395.19 m), Shuidian (2955.58 m), and Chahanwusu (1962.19 m) stations are situated in mid- to high-altitudes areas. Images were manually interpreted to determine the presence or absence of snow cover. To ensure reliability, we only selected images taken between 12:00 and 13:00 (LST). Days with ambiguous visibility due to cloud obstruction or low illumination were excluded from the analysis. For validation purposes, each camera's field of view was spatially aligned with the footprint of the corresponding MODIS pixels. The interpreted snow presence from field imagery served as the ground truth for assessing the accuracy of the four MODIS snow cover datasets under both clear-sky and cloudy conditions.

2.3 Data analysis

To quantitatively evaluate the accuracy of the four MODIS snow cover datasets, this study extracted snow cover information from all MODIS datasets using the Environment for Visualizing Images (ENVI) v.5.2 (Exelis Visual Information Solutions, Boulder, USA) and ArcGIS v.10.2 (Environmental Systems Research Institute Inc. (ESRI), Redlands, USA). The extracted data were converted into binary format (snow and snow-free) using Python and used to generate snow cover time series. Binary snow cover information from real-time camera images was obtained through manual visual interpretation for further analysis.
To systematically evaluate the effectiveness of the cloud removal methods, we used a combination of confusion matrices (Table 2) and statistical accuracy metrics. As shown in Equations 1-6, we utilized accuracy, precision, recall, overestimation error (OE), underestimation error (UE), and f (the harmonic mean of accuracy and recall) to evaluate the performance of cloud removal and snow cover detection methods.
Table 2 Confusion matrix for precision validation
MODIS product
Snow Snow-free
Observation Snow TP FN
Snow-free FP TN

Note: TP, true positive; FN, false negative; FP, false positive; TN, true negative.

Accuracy= TP+TN TP+FN+FP+TN ,
Precision= TP TP+FP ,
Recall= TP TP+FN ,
f = 2TP 2TP+FN+FP ,
OE= FP FP+TN ,
UE= FN TP+FN ,
where TP represents that the true value of the pixel contains snow and the data processed by the cloud removal method contains snow; FN represents that the true value of the pixel contains snow and the data processed by the cloud removal method has no snow; FP represents that the true value of the pixel is snow-free and the data processed by the cloud removal method has snow; TN represents that the true value of the pixel is snow-free and the data processed by the cloud removal method is snow-free; Accuracy is the proportion of correctly classified observations (both snow and snow-free) relative to the total observations; Precision is the proportion of correctly classified snow observations relative to the total number of predicted snow observations; Recall is the proportion of correctly predicted snow observations relative to the total number of actual snow observations; f is the harmonic means of accuracy and recall, with values between 0 and 1, and a higher value indicating better performance of the snow classification algorithm; OE is the probability of erroneously predicting snow based on the total number of actual non-snow observations; and UE is the probability of missing actual snow presence based on the total number of actual snow observations.

3 Results

3.1 Accuracy of cloud-free snow cover datasets under different periods

The accuracy of the four cloud-free MODIS snow cover datasets was evaluated under various temporal conditions, including the snow accumulation period (September-November), snowmelt period (March-June), and stable snow period (December-February of the following year).

3.1.1 Snow cover accuracy over the full year

The comprehensive evaluation of the cloud-free snow dataset is detailed in Table S1, which presents the accuracy metrics for daily snow data generated by the four MODIS snow datasets across all time periods. Dataset 1 exhibited high accuracy (0.948) and precision (0.996) at Luotuobozi Station, although a certain proportion of snow was missed, resulting in a UE of 0.098 under clear-sky conditions. At Shenglidaoban Station, the accuracy of snow information under cloudy conditions was actually higher than that under clear-sky conditions. Dataset 2 demonstrated a balanced overall performance, achieving particularly high accuracy (0.941) and precision (0.990) at Shenglidaoban Station, indicating its stronger snow recognition ability under cloudy conditions. Dataset 3 showed a high accuracy (0.927) at Shenglidaoban Station, but its performance was generally lower compared with other datasets. Dataset 4 had lower accuracy compared with the other snow datasets, showing relatively poor performance in both accuracy and recall.
Table S1 Accuracy assessment of the four cloud removal methods
Station Dataset Type TP FN FP TN Accuracy Precision Recall f OE UE
Luotuobozi Station Dataset 1 Clear-sky 269 29 1 382 0.948 0.996 0.902 0.947 0.004 0.098
Cloudy 366 54 6 288 0.907 0.984 0.874 0.925 0.028 0.126
All sky 635 83 7 670 0.926 0.989 0.885 0.934 0.014 0.115
Dataset 2 Clear-sky 274 24 2 381 0.955 0.993 0.919 0.955 0.007 0.081
Cloudy 372 48 11 283 0.909 0.971 0.888 0.928 0.051 0.112
All sky 646 72 13 664 0.930 0.980 0.901 0.939 0.026 0.099
Dataset 3 Clear-sky 270 28 5 378 0.942 0.982 0.906 0.942 0.018 0.094
Cloudy 379 41 20 274 0.906 0.950 0.905 0.927 0.092 0.095
All sky 649 69 25 652 0.923 0.963 0.905 0.933 0.051 0.095
Dataset 4 Clear-sky 87 21 4 153 0.888 0.956 0.798 0.870 0.033 0.202
Cloudy 97 31 2 115 0.852 0.980 0.764 0.858 0.022 0.236
All sky 184 52 6 268 0.871 0.968 0.780 0.864 0.028 0.220
Shuidian Station Dataset 1 Clear-sky 257 58 4 136 0.864 0.985 0.816 0.892 0.029 0.184
Cloudy 482 93 9 169 0.865 0.982 0.838 0.904 0.051 0.162
All sky 739 151 13 305 0.864 0.983 0.830 0.900 0.041 0.170
Dataset 2 Clear-sky 271 44 6 134 0.890 0.978 0.860 0.916 0.043 0.140
Cloudy 536 39 13 165 0.931 0.976 0.932 0.954 0.073 0.068
All sky 807 83 19 299 0.916 0.977 0.907 0.941 0.060 0.093
Dataset 3 Clear-sky 262 53 13 127 0.855 0.953 0.832 0.888 0.093 0.168
Cloudy 477 98 28 150 0.833 0.945 0.830 0.883 0.157 0.170
All sky 739 151 41 277 0.841 0.947 0.830 0.885 0.129 0.170
Dataset 4 Clear-sky 100 32 0 54 0.828 1.000 0.758 0.862 0.000 0.242
Cloudy 121 23 2 46 0.870 0.984 0.840 0.906 0.042 0.160
All sky 221 55 2 100 0.849 0.991 0.801 0.886 0.020 0.199
Shenglidaoban Station Dataset 1 Clear-sky 95 22 0 103 0.882 1.000 0.812 0.896 0.000 0.188
Cloudy 291 17 0 79 0.953 1.000 0.945 0.972 0.000 0.055
All sky 386 39 0 182 0.928 1.000 0.908 0.952 0.000 0.092
Dataset 2 Clear-sky 97 20 0 103 0.893 1.000 0.829 0.907 0.000 0.171
Cloudy 300 8 4 75 0.966 0.987 0.974 0.980 0.080 0.026
All sky 397 28 4 178 0.941 0.990 0.934 0.961 0.033 0.066
Dataset 3 Clear-sky 94 23 0 103 0.877 1.000 0.803 0.891 0.000 0.197
Cloudy 297 11 6 73 0.953 0.980 0.964 0.972 0.120 0.036
All sky 391 34 6 176 0.927 0.985 0.920 0.951 0.050 0.080
Dataset 4 Clear-sky 85 22 0 98 0.878 1.000 0.802 0.890 0.000 0.198
Cloudy 218 14 0 77 0.954 1.000 0.944 0.971 0.000 0.056
All sky 303 36 0 175 0.925 1.000 0.899 0.947 0.000 0.101
Chahanwusu Station Dataset 1 Clear-sky 17 1 7 813 0.990 0.739 0.944 0.829 0.009 0.056
Cloudy 28 16 22 490 0.926 0.583 0.636 0.609 0.045 0.364
All sky 45 17 29 1303 0.964 0.634 0.726 0.677 0.023 0.274
Chahanwusu Station Dataset 2 Clear-sky 13 5 5 815 0.990 0.722 0.722 0.722 0.005 0.278
Cloudy 35 9 28 484 0.924 0.556 0.795 0.654 0.063 0.205
All sky 48 14 33 1299 0.968 0.593 0.774 0.671 0.024 0.226
Dataset 3 Clear-sky 14 4 9 811 0.987 0.609 0.778 0.683 0.009 0.222
Cloudy 27 17 18 494 0.928 0.600 0.614 0.607 0.041 0.386
All sky 41 21 27 1305 0.967 0.603 0.661 0.631 0.019 0.339
Dataset 4 Clear-sky 4 3 2 363 0.986 0.667 0.571 0.615 0.006 0.429
Cloudy 3 13 1 218 0.934 0.600 0.188 0.286 0.010 0.813
All sky 7 16 3 581 0.965 0.636 0.304 0.412 0.007 0.696

Note: TP, true positive; FN, false negative; FP, false positive; TN, true negative; f, harmonic mean of accuracy and recall; OE, overestimation error; UE, underestimation error.

3.1.2 Accuracy during the snow accumulation period

During the snow accumulation period (details of which are presented in Table S2), Dataset 1 displayed high accuracy and precision at Luotuobozi and Shenglidaoban stations. Dataset 2 exhibited similar performance to Dataset 1 at Luotuobozi Station. Dataset 3 had lower precision (0.897) and recall (0.839) at Luotuobozi Station. Dataset 4 displayed low values for both accuracy and recall.
Table S2 Accuracy assessment of the four cloud removal methods during the snow accumulation period (September-November)
Station Dataset Type TP FN FP TN Accuracy Precision Recall f OE UE
Luotuobozi Station Dataset 1 Clear-sky 61 13 1 136 0.934 0.984 0.824 0.897 0.007 0.176
Cloudy 59 16 3 70 0.872 0.952 0.787 0.861 0.041 0.213
All sky 120 29 4 206 0.908 0.968 0.805 0.879 0.019 0.195
Dataset 2 Clear-sky 64 10 1 136 0.948 0.985 0.865 0.921 0.007 0.135
Cloudy 63 12 6 67 0.878 0.913 0.840 0.875 0.082 0.160
All sky 127 22 7 203 0.919 0.948 0.852 0.898 0.033 0.148
Dataset 3 Clear-sky 61 13 4 133 0.919 0.938 0.824 0.878 0.029 0.176
Cloudy 64 11 9 64 0.865 0.877 0.853 0.865 0.123 0.147
All sky 125 24 13 197 0.897 0.906 0.839 0.871 0.062 0.161
Dataset 4 Clear-sky 18 9 1 64 0.891 0.947 0.667 0.783 0.015 0.333
Cloudy 14 6 2 30 0.846 0.875 0.700 0.778 0.063 0.300
All sky 32 15 3 94 0.875 0.914 0.681 0.780 0.031 0.319
Shuidian Station Dataset 1 Clear-sky 58 25 3 86 0.837 0.951 0.699 0.806 0.034 0.301
Cloudy 87 41 7 52 0.743 0.926 0.680 0.784 0.119 0.320
All sky 145 66 10 138 0.788 0.935 0.687 0.792 0.068 0.313
Dataset 2 Clear-sky 61 22 5 84 0.843 0.924 0.735 0.819 0.056 0.265
Cloudy 111 17 5 54 0.882 0.957 0.867 0.910 0.085 0.133
All sky 172 39 10 138 0.864 0.945 0.815 0.875 0.068 0.185
Dataset 3 Clear-sky 59 24 10 79 0.802 0.855 0.711 0.776 0.112 0.289
Cloudy 97 31 15 44 0.754 0.866 0.758 0.808 0.254 0.242
All sky 156 55 25 123 0.777 0.862 0.739 0.796 0.169 0.261
Dataset 4 Clear-sky 27 17 0 38 0.793 1.000 0.614 0.761 0.000 0.386
Cloudy 20 1 0 1 0.955 1.000 0.952 0.976 0.000 0.048
All sky 47 18 0 39 0.827 1.000 0.723 0.839 0.000 0.277
Shenglidaoban Station Dataset 1 Clear-sky 29 3 0 53 0.965 1.000 0.906 0.951 0.000 0.094
Cloudy 57 5 0 30 0.946 1.000 0.919 0.958 0.000 0.081
All sky 86 8 0 83 0.955 1.000 0.915 0.956 0.000 0.085
Shenglidaoban Station Dataset 2 Clear-sky 30 2 0 53 0.976 1.000 0.938 0.968 0.000 0.063
Cloudy 60 2 3 27 0.946 0.952 0.968 0.960 0.100 0.032
All sky 90 4 3 80 0.960 0.968 0.957 0.963 0.036 0.043
Dataset 3 Clear-sky 29 3 0 53 0.965 1.000 0.906 0.951 0.000 0.094
Cloudy 60 2 4 26 0.935 0.938 0.968 0.952 0.133 0.032
All sky 89 5 4 79 0.949 0.957 0.947 0.952 0.048 0.053
Dataset 4 Clear-sky 26 3 0 51 0.963 1.000 0.897 0.945 0.000 0.103
Cloudy 53 3 0 29 0.965 1.000 0.946 0.972 0.000 0.054
All sky 79 6 0 80 0.964 1.000 0.929 0.963 0.000 0.071
Chahanwusu Station Dataset 1 Clear-sky 4 0 0 251 1.000 1.000 1.000 1.000 0.000 0.000
Cloudy 6 7 3 88 0.904 0.667 0.462 0.545 0.033 0.538
All sky 10 7 3 339 0.972 0.769 0.588 0.667 0.009 0.412
Dataset 2 Clear-sky 3 1 0 502 0.998 1.000 0.750 0.857 0.000 0.250
Cloudy 8 5 4 87 0.913 0.667 0.615 0.640 0.044 0.385
All sky 11 6 4 589 0.984 0.733 0.647 0.688 0.007 0.353
Dataset 3 Clear-sky 4 0 3 499 0.994 0.571 1.000 0.727 0.006 0.000
Cloudy 5 8 7 84 0.856 0.417 0.385 0.400 0.077 0.615
All sky 9 8 10 583 0.970 0.474 0.529 0.500 0.017 0.471
Dataset 4 Clear-sky 0 1 1 122 0.984 0.000 0.000 0.000 0.008 1.000
Cloudy 1 7 1 35 0.818 0.500 0.125 0.200 0.028 0.875
All sky 1 8 2 157 0.940 0.333 0.111 0.167 0.013 0.889
When there are persistent cloud cover and unstable snow cover, snow cover under clear-sky conditions is easier to predict and has higher accuracy. However, when there is long-term cloud cover, it is difficult to completely remove clouds and the accuracy decreases. Dataset 2 performed best under these conditions, with higher accuracy compared with the other datasets. During the snow accumulation period, delays in reconstructing snow cover under cloud conditions contributed to a higher UE. This feature is particularly important for identifying snow coverage. Datasets 2 and 3 showed lower UE during the snow accumulation period, making them more effective for reconstructing snow accumulation data.

3.1.3 Accuracy during the snowmelt period

Table S3 presents the confusion matrix results for snow cover over the snowmelt period (March-June). Dataset 1 displayed balanced accuracy and precision at Luotuobozi and Shuidian stations. Dataset 2 exhibited good performance at all stations. At Chahanwusu Station, the OE of Dataset 2 (0.016) was higher compared with the other datasets. Dataset 2 had higher accuracy and lower UE compared with the other datasets under cloud coverage. Dataset 4 had low recall at Luotuobozi Station (0.606). At Shenglidaoban Station, the overall accuracy was 1.000; however, the recall was low and the UE was 0.250, indicating that Dataset 4 did not overestimate snow but failed to detect snow when it was present. This may be because patchy snow cover during the snowmelt period was not captured by the MOD10A1-based remote sensing data used in Dataset 4.
Table S3 Accuracy assessment of the four cloud removal methods during the snowmelt period (March-June)
Station Dataset Type TP FN FP TN Accuracy Precision Recall f OE UE
Luotuobozi Station Dataset 1 Clear-sky 47 15 0 138 0.925 1.000 0.758 0.862 0.000 0.242
Cloudy 112 32 3 141 0.878 0.974 0.778 0.865 0.021 0.222
All sky 159 47 3 279 0.898 0.981 0.772 0.864 0.011 0.228
Dataset 2 Clear-sky 49 13 1 137 0.930 0.980 0.790 0.875 0.007 0.210
Cloudy 120 24 5 139 0.899 0.960 0.833 0.892 0.035 0.167
All sky 169 37 6 276 0.912 0.966 0.820 0.887 0.021 0.180
Dataset 3 Clear-sky 50 12 1 137 0.935 0.980 0.806 0.885 0.007 0.194
Cloudy 120 24 11 133 0.878 0.916 0.833 0.873 0.076 0.167
All sky 170 36 12 270 0.902 0.934 0.825 0.876 0.043 0.175
Dataset 4 Clear-sky 13 11 3 56 0.831 0.813 0.542 0.650 0.051 0.458
Cloudy 30 17 0 56 0.835 1.000 0.638 0.779 0.000 0.362
All sky 43 28 3 112 0.833 0.935 0.606 0.735 0.026 0.394
Shuidian Station Dataset 1 Clear-sky 57 33 1 50 0.759 0.983 0.633 0.770 0.020 0.367
Cloudy 176 52 2 117 0.844 0.989 0.772 0.867 0.017 0.228
All sky 233 85 3 167 0.820 0.987 0.733 0.841 0.018 0.267
Dataset 2 Clear-sky 68 22 1 50 0.837 0.986 0.756 0.855 0.020 0.244
Cloudy 206 22 8 111 0.914 0.963 0.904 0.932 0.067 0.096
All sky 274 44 9 161 0.891 0.968 0.862 0.912 0.053 0.138
Shuidian Station Dataset 3 Clear-sky 61 29 3 48 0.773 0.953 0.678 0.792 0.059 0.322
Cloudy 162 66 13 106 0.772 0.926 0.711 0.804 0.109 0.289
All sky 223 95 16 154 0.773 0.933 0.701 0.801 0.094 0.299
Dataset 4 Clear-sky 25 15 0 16 0.732 1.000 0.625 0.769 0.000 0.375
Cloudy 27 22 2 45 0.750 0.931 0.551 0.692 0.043 0.449
All sky 52 37 2 61 0.743 0.963 0.584 0.727 0.032 0.416
Shenglidaoban Station Dataset 1 Clear-sky 33 19 0 17 0.725 1.000 0.635 0.776 0.000 0.365
Cloudy 87 12 0 20 0.899 1.000 0.879 0.935 0.000 0.121
All sky 120 31 0 37 0.835 1.000 0.795 0.886 0.000 0.205
Dataset 2 Clear-sky 34 18 0 17 0.739 1.000 0.654 0.791 0.000 0.346
Cloudy 93 6 1 19 0.941 0.989 0.939 0.964 0.050 0.061
All sky 127 24 1 36 0.867 0.992 0.841 0.910 0.027 0.159
Dataset 3 Clear-sky 32 20 0 17 0.710 1.000 0.615 0.762 0.000 0.385
Cloudy 90 9 2 18 0.908 0.978 0.909 0.942 0.100 0.091
All sky 122 29 2 35 0.835 0.984 0.808 0.887 0.054 0.192
Dataset 4 Clear-sky 28 18 0 15 0.705 1.000 0.609 0.757 0.000 0.391
Cloudy 56 10 0 20 0.884 1.000 0.848 0.918 0.000 0.152
All sky 84 28 0 35 0.810 1.000 0.750 0.857 0.000 0.250
Chahanwusu Station Dataset 1 Clear-sky 0 0 1 279 0.996 0.000 0.000 0.000 0.004 -
Cloudy 0 0 1 207 0.995 0.000 0.000 0.000 0.005 -
All sky 0 0 2 486 0.996 0.000 0.000 0.000 0.004 -
Dataset 2 Clear-sky 0 0 1 279 0.996 0.000 0.000 0.000 0.004 -
Cloudy 0 0 7 201 0.966 0.000 0.000 0.000 0.034 -
All sky 0 0 8 480 0.984 0.000 0.000 0.000 0.016 -
Dataset 3 Clear-sky 0 0 0 280 1.000 0.000 0.000 0.000 0.000 -
Cloudy 0 0 1 207 0.995 0.000 0.000 0.000 0.005 -
All sky 0 0 1 487 0.998 0.000 0.000 0.000 0.002 -
Dataset 4 Clear-sky 0 0 1 133 0.993 0.000 0.000 0.000 0.007 -
Cloudy 0 0 1 102 0.990 0.000 0.000 0.000 0.010 -
All sky 0 0 2 235 0.992 0.000 0.000 0.000 0.008 -

Note: During the snowmelt period, there were almost no snow data, and TP and FN were 0 at Chahanwusu Station. ''-'' indicates no value.

The datasets showed the snowmelt period appeared earlier than it actually occurred in capturing the snowmelt process. Dataset 2 outperformed other datasets under cloudy conditions, with higher accuracy and lower UE.

3.1.4 Accuracy during stable snow period

The confusion matrix results for the stable snow period (December-February of the following year) are presented in Table S4. Accuracy was relatively high, with the Luotuobozi, Shuidian, and Shenglidaoban stations exhibiting high accuracy and low UE. In contrast, at Chahanwusu Station, where land cover and terrain result in unstable snow conditions, all four datasets showed lower accuracy with missed snow detections. These results indicated that the four datasets have limitations in capturing short-term snow cover, warranting further improvement.
Table S4 Accuracy assessment of the four cloud removal methods during the stable snow period (December-February of the following year)
Station Dataset Type TP FN FP TN Accuracy Precision Recall f OE UE
Luotuobozi Station Dataset 1 Clear-sky 160 1 0 0 0.994 1.000 0.994 0.997 - 0.006
Cloudy 195 5 0 0 0.975 1.000 0.975 0.987 - 0.025
All sky 355 6 0 0 0.983 1.000 0.983 0.992 - 0.017
Dataset 2 Clear-sky 160 1 0 0 0.994 1.000 0.994 0.997 - 0.006
Cloudy 189 11 0 0 0.945 1.000 0.945 0.972 - 0.055
All sky 349 12 0 0 0.967 1.000 0.967 0.983 - 0.033
Luotuobozi Station Dataset 3 Clear-sky 158 3 0 0 0.981 1.000 0.981 0.991 - 0.019
Cloudy 195 5 0 0 0.975 1.000 0.975 0.987 - 0.025
All sky 353 8 0 0 0.978 1.000 0.978 0.989 - 0.022
Dataset 4 Clear-sky 56 1 0 0 0.982 1.000 0.982 0.991 - 0.018
Cloudy 53 8 0 0 0.869 1.000 0.869 0.930 - 0.131
All sky 109 9 0 0 0.924 1.000 0.924 0.960 - 0.076
Shuidian Station Dataset 1 Clear-sky 142 0 0 0 1.000 1.000 1.000 1.000 - 0.000
Cloudy 219 0 0 0 1.000 1.000 1.000 1.000 - 0.000
All sky 361 0 0 0 1.000 1.000 1.000 1.000 - 0.000
Dataset 2 Clear-sky 142 0 0 0 1.000 1.000 1.000 1.000 - 0.000
Cloudy 219 0 0 0 1.000 1.000 1.000 1.000 - 0.000
All sky 361 0 0 0 1.000 1.000 1.000 1.000 - 0.000
Dataset 3 Clear-sky 142 0 0 0 1.000 1.000 1.000 1.000 - 0.000
Cloudy 218 1 0 0 0.995 1.000 0.995 0.998 - 0.005
All sky 360 1 0 0 0.997 1.000 0.997 0.999 - 0.003
Dataset 4 Clear-sky 48 0 0 0 1.000 1.000 1.000 1.000 - 0.000
Cloudy 74 0 0 0 1.000 1.000 1.000 1.000 - 0.000
All sky 122 0 0 0 1.000 1.000 1.000 1.000 - 0.000
Shenglidaoban Station Dataset 1 Clear-sky 33 0 0 0 1.000 1.000 1.000 1.000 - 0.000
Cloudy 147 0 0 0 1.000 1.000 1.000 1.000 - 0.000
All sky 180 0 0 0 1.000 1.000 1.000 1.000 - 0.000
Dataset 2 Clear-sky 33 0 0 0 1.000 1.000 1.000 1.000 - 0.000
Cloudy 147 0 0 0 1.000 1.000 1.000 1.000 - 0.000
All sky 180 0 0 0 1.000 1.000 1.000 1.000 - 0.000
Dataset 3 Clear-sky 33 0 0 0 1.000 1.000 1.000 1.000 - 0.000
Cloudy 147 0 0 0 1.000 1.000 1.000 1.000 - 0.000
All sky 180 0 0 0 1.000 1.000 1.000 1.000 - 0.000
Dataset 4 Clear-sky 31 0 0 0 1.000 1.000 0.939 0.969 - 0.061
Cloudy 109 0 0 0 1.000 1.000 0.741 0.852 - 0.259
All sky 140 0 0 0 1.000 1.000 0.778 0.875 - 0.222
Chahanwusu Station Dataset 1 Clear-sky 13 1 5 168 0.968 0.722 0.929 0.813 0.029 0.071
Cloudy 22 9 16 127 0.856 0.579 0.710 0.638 0.112 0.290
All sky 35 10 21 295 0.914 0.625 0.778 0.693 0.066 0.222
Dataset 2 Clear-sky 10 4 4 169 0.957 0.714 0.714 0.714 0.023 0.286
Cloudy 27 4 17 126 0.879 0.614 0.871 0.720 0.119 0.129
All sky 37 8 21 295 0.920 0.638 0.822 0.718 0.066 0.178
Dataset 3 Clear-sky 10 4 6 167 0.947 0.625 0.714 0.667 0.035 0.286
Cloudy 22 9 10 133 0.891 0.688 0.710 0.698 0.070 0.290
All sky 32 13 16 300 0.920 0.667 0.711 0.688 0.051 0.289
Dataset 4 Clear-sky 4 2 0 84 0.978 1.000 0.667 0.800 0.000 0.333
Cloudy 2 6 0 71 0.924 1.000 0.250 0.400 0.000 0.750
All sky 6 8 0 155 0.953 1.000 0.429 0.600 0.000 0.571

Note: During the snow stable period, there were almost no snow-free data, and FP and TN were 0 at Luotuobozi, Shenglidaoban, and Shuidian stations. ''-'' indicates no value.

Notably, at Shuidian and Shenglidaoban stations, the accuracy of snow detection was higher under cloud cover than under clear-sky conditions during the snow fluctuation periods (i.e., the snow accumulation and snowmelt periods). The FN, where real-time camera observations detected snow but the dataset did not, was higher under clear-sky conditions. This discrepancy could be attributed to the presence of snow patches and light snow cover at these stations, where MOD10A1, used in Datasets 1, 3, and 4, failed to recognize the snow. In Dataset 2, the exclusion of some snow information may result either from the source data's inability to detect snow or from overly high snow classification thresholds during the cloud removal process.
Overall, Dataset 2 demonstrated superior snow recognition ability under cloud cover, while Dataset 4 showed notable limitations. There were no significant differences between Dataset 1 and Dataset 3. During the snow accumulation period, Dataset 2 consistently outperformed the other datasets with higher accuracy and lower UE. Similar trends were observed during the snowmelt period, where Dataset 2 maintained higher accuracy and lower UE. During the stable snow period, Datasets 1, 2, and 3 all performed well, showing consistent results.

3.2 Snow cover dataset time series at real-time camera stations

At Luotuobozi Station, real-time camera observations revealed snow onset dates between late October and early November. However, due to cloud contamination, all four datasets failed to detect snow in early November 2016, resulting in a delayed snow onset (Fig. 2a). On 1 December, 2017, persistent cloud cover in the MOD10A1 data prevented all datasets from detecting snow, resulting in a delay in snow detection. Snowmelt was observed from late May to early June in both real-time camera images and the datasets, though slight discrepancies in the timing of snowmelt were observed between the camera data and the dataset predictions.
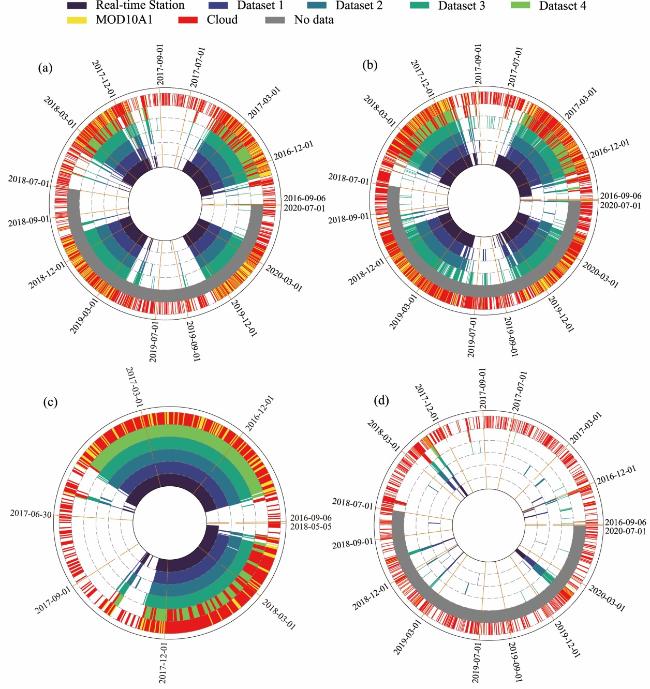
Fig. 2 Time series of snow data at Luotuobozi (a), Shuidian (b), Shenglidaoban (c), and Chahanwusu (d) stations located in the Tianshan Mountains, central Xinjiang. The white areas represent snow-free.
At Shuidian Station, real-time camera observations showed snow onset dates between late September and early October (Fig. 2b). In early October 2016, Dataset 1 failed to detect snow due to cloud contamination, suggesting a delay in its cloud removal algorithm. Although datasets 2, 3, and 4 successfully detected snow onset dates in early October 2016, long-term cloud cover resulted in intermittent snow-free periods, indicating challenges with extended cloudy conditions. Real-time camera observations recorded snowmelt at Shuidian Station in early June, whereas all datasets exhibited an earlier onset of snowmelt during June in both 2016 and 2017, revealing discrepancies between the real-time observations and dataset predictions.
At Shenglidaoban Station, real-time camera observations recorded snow onset dates from late September to early October, which largely aligned with the dataset timings (Fig. 2c). However, during the stable snow period from November 2017 to May 2018, Dataset 4 exhibited intermittent gaps in snow detection due to incomplete cloud removal. Despite these gaps, snowmelt onset was recorded from mid-May in the datasets, though discrepancies suggested that Dataset 4 struggled with cloud contamination during the stable snow period, limiting its accuracy.
At Chahanwusu Station, real-time cameras indicated a short snow duration with rapid melting (Fig. 2d). However, datasets 2 and 3 suggested a longer snow cover period compared with the real-time camera data. This discrepancy highlighted the difficulty of accurately capturing short snow events in areas with rapid snowmelt and limited snow cover duration. The differences between the real-time camera data and the datasets underlined the challenges in reconstructing snow cover dynamics in regions with variable snow conditions.

3.3 Difference analysis between snow datasets and real-time camera observations

3.3.1 Snow accumulation period

During the snow accumulation period, different cloud removal methods exhibited varying accuracies at different stations. Since snow cover was continuously increasing, a high recall was usually expected, requiring greater accuracy to capture changes during the fluctuating snow accumulation period. Figure 3 illustrates the complex terrain surrounding the Luotuobozi Real-time Camera Station. The station is located in a valley between two mountains, a gently sloping area at the foothill of the Southern Mountain. Between 12:22:33 and 12:50:06 (LST) on 5 November 2017, the real-time camera captured patchy snow cover on the ground, while none of the four datasets detected any snow presence. Figure 4 shows that each dataset exhibited varying snow cover boundaries, with some having broader and more ambiguous coverage. Dataset 1 replaced cloud-covered points with cloud-free data from the previous day, leading to missed snow detection in areas with short-term snow accumulation. Dataset 2 had discrepancies in complex mountainous areas due to extended cloud pixels in its spatiotemporal operations, which resulted in an expansion of snow boundaries or absence of snow information.
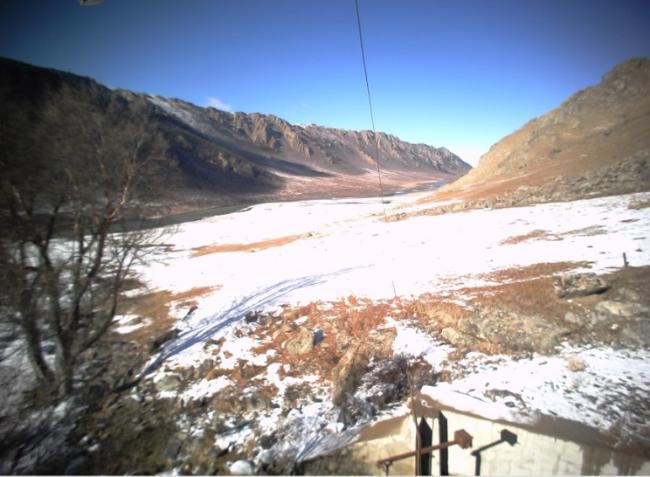
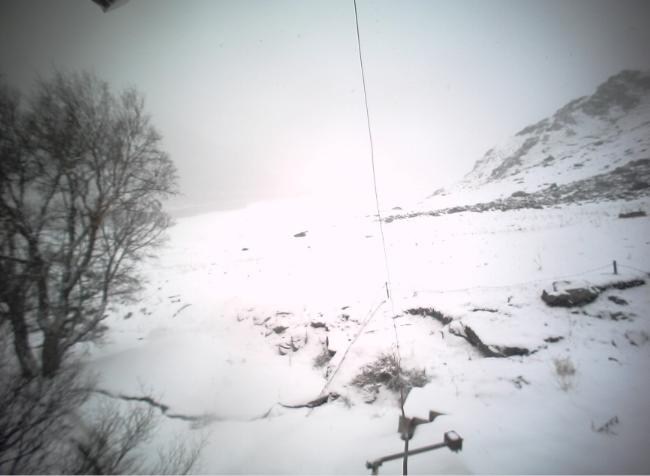
Fig. 3 Real-time camera image of Luotuobozi Station on 5 November 2017
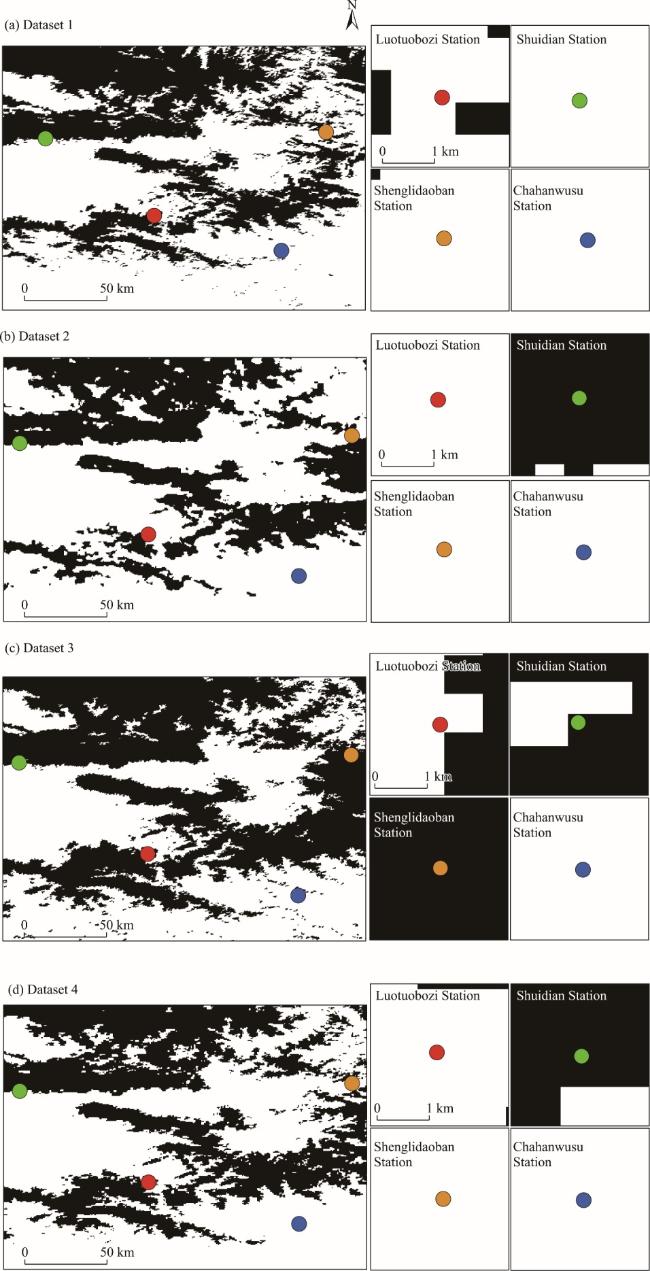
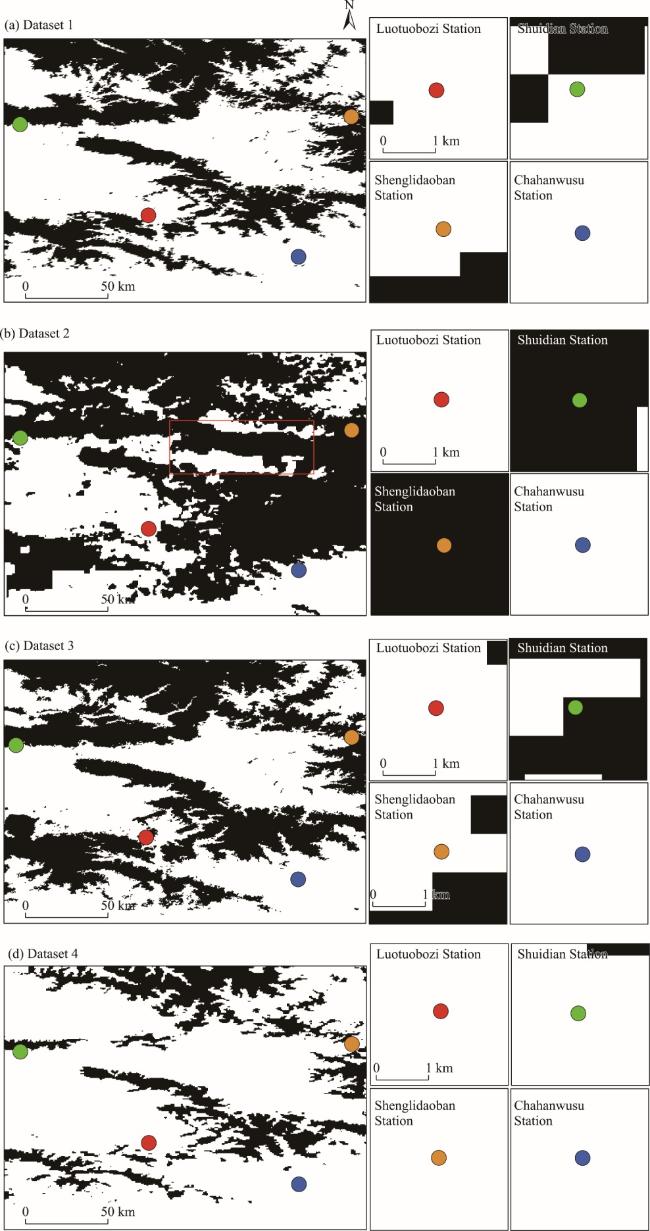
Fig. 4 Diagram illustrating snow cover classification results of different datasets on 5 November 2017. (a), Dataset 1; (b), Dataset 2; (c), Dataset 3; (d), Dataset 4.
In Dataset 3, the cloud removal algorithm employed a spatiotemporal adaptive fusion method. The choices for spatial partitioning and conditional thresholding may lead to an increased number of snow pixels in the NDSI assignment. However, during the cloud gap-filling process, tracing the correlation with the target area using an 8-d window (both before and after) produced reliable snow predictions in areas with prolonged cloud cover. Dataset 4 showed a higher UE due to insufficient spatiotemporal processing and the retention of residual cloud information. At Chahanwusu Station, a gravel surface and steep south-facing slope, combined with unstable snow periods and rapid accumulation, led to high UE for all datasets. These findings indicated that the datasets were not suitable for such terrain, highlighting the need for improving cloud removal algorithms that account for surface conditions and elevation.

3.3.2 Snowmelt period

The various cloud removal datasets also exhibited varying accuracy characteristics at different stations and conditions during the snowmelt period. Snow cover beneath cloud cover was prone to significant and rapid changes that impacted both accuracy and recall (Table S3). Reducing UE during this period was essential for accurately capturing the decrease in snow cover. As shown in Figure 5, a snow event was observed at Luotuobozi Real-time Camera Station at 12:22:32 (LST) on 19 April 2018. However, none of the four datasets detected snow on this date because the original MODIS data failed to detect snow and severe cloud cover prevailed, resulting in inaccurate cloud removal for all datasets (Fig. 6). Although this was a rare phenomenon, it highlighted the challenge of snow detection under complex conditions. Similar to the snow accumulation period, Dataset 2 effectively captured snow dynamics under continuous cloud cover, exhibiting higher accuracy compared with other datasets and reducing UE compared with Dataset 3. However, Dataset 2 displayed a more uniform distribution of binary snow cover, which caused entire areas to be incorrectly classified as snow-covered, particularly in mountainous terrains and valleys (Fig. 6b). The limitations of real-time cameras in mountainous areas led to undetected snow, restricting the spatial accuracy of snow cover. Dataset 4 significantly underestimated snow cover during the snowmelt period, resulting in a higher UE.
Fig. 5 Real-time camera image of Luotuobozi Station on 19 April 2018
Fig. 6 Diagram illustrating snow cover classification results of different datasets on 19 April 2018. (a), Dataset 1; (b), Dataset 2; (c), Dataset 3; (d), Dataset 4.

3.3.3 Stable snow period

During the stable snow period, the various cloud removal datasets exhibited distinct accuracy characteristics at different stations and under diverse conditions. Snow cover remained stable during this period, with minimal changes in distribution and status, resulting in higher accuracy and recall, as well as lower OE and UE. According to the real-time camera observations, there was no snow cover at 12:19:07 (LST) on 21 December 2016 at Chahanwusu Station (Fig. 7). However, snow maps generated by Datasets 1 and 3 erroneously indicated snow cover (Fig. 8). This misclassification occurred because the original MODIS snow data contained snow information, causing datasets 1 and 3 to mistakenly fill gaps with snow. Despite this incorrect prediction at Chahanwusu Station, Dataset 1 performed well throughout the entire stable snow period, with a low UE. Accurately predicting short-term and unstable snow cover remains a critical challenge.
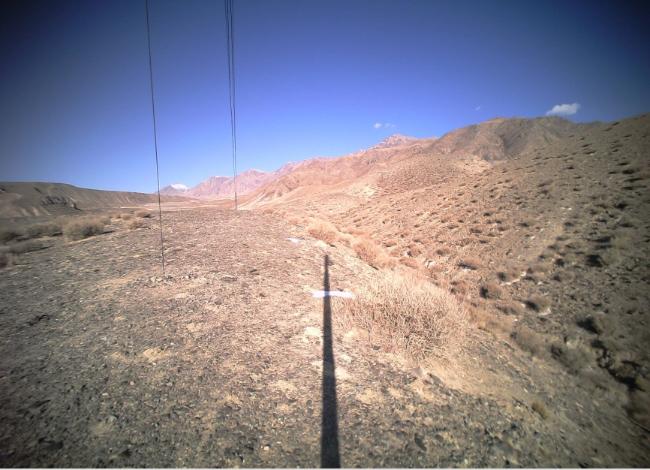
Fig. 7 Real-time camera image of Chahanwusu Station on 21 December 2016
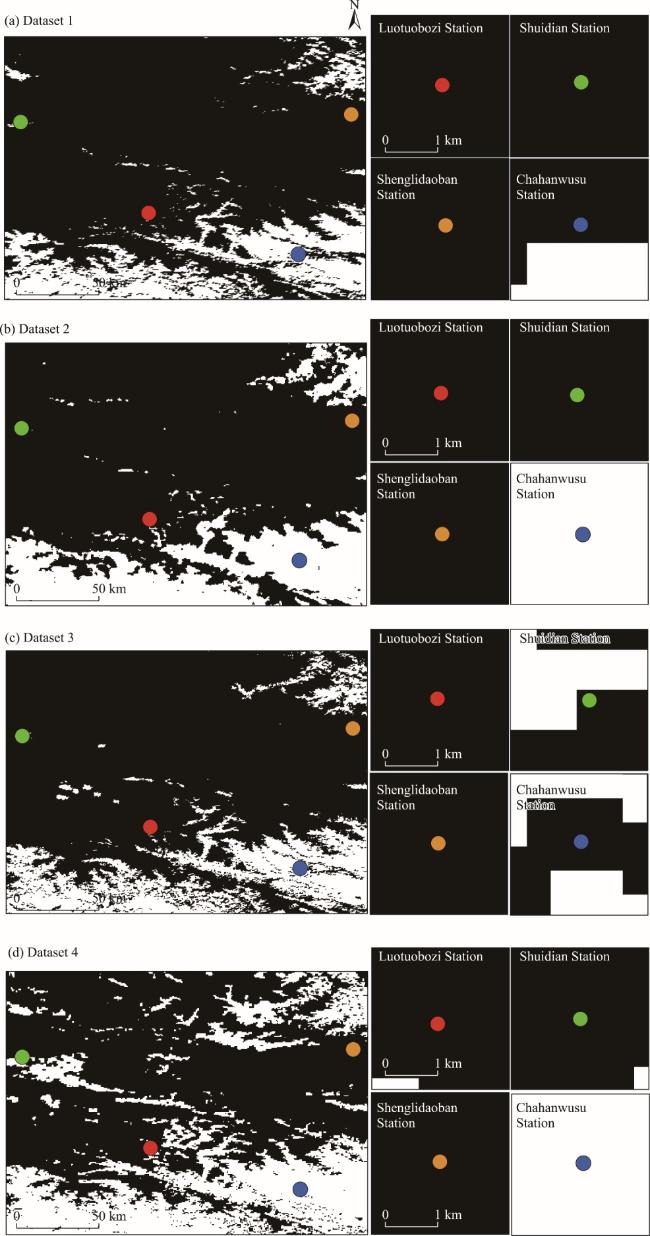
Fig. 8 Diagram illustrating snow cover classification results of different datasets on 21 December 2016. (a), Dataset 1; (b), Dataset 2; (c), Dataset 3; (d), Dataset 4.
In summary, the performance of different methods varied across stations. Dataset 2 performed well at most stations, while datasets 1 and 3 showed relatively balanced performance. However, when cloud cover frequently changes and snow cover fluctuates, overly simplified time-series models (such as Dataset 1) cannot fully capture the dynamic changes in regional snow cover, limiting their effectiveness. Selecting a cloud removal method requires careful consideration of the geographical and climatic conditions specific to the application scenario and study stations. If the goal is to minimize missed snow accumulation, then Dataset 3, with its higher recall, may be preferred. However, if the goal is to maintain overall high accuracy and precision to avoid false positives, then Dataset 2 may be a better choice.

4 Discussion

4.1 Validation and performance of snow detection products

Recent advancements in snow cover remote sensing retrieval technologies have significantly enhanced the applicability of multi-source datasets across complex terrains and diverse surface conditions. For Dataset 1, Stillinger et al. (2023) demonstrated notable improvements in accuracy for the updated version compared with legacy products. According to Hall et al. (2024), intermittent short-term cloud cover has little impact on the accuracy of Dataset 1, but long-term cloudy periods can reduce the accuracy of snow prediction when snow cover conditions change. This is consistent with the snow patterns observed by real-time cameras and the conclusions of our study.
For Dataset 2, Hao et al. (2022) reported an overall accuracy of 93.15% across China, and Zhang et al. (2024) emphasized its superior cloud removal performance and high Cohen's Kappa (CK) value of 0.609 for China, corresponding to an accuracy of 97.00%. Similarly, Gao et al. (2024) demonstrated that Dataset 2 exhibited superior performance on the Xizang Plateau compared with alternative methods, achieving a CK of 0.820. This finding aligns with our validation results, which confirm the reliable performance of Dataset 2 in terms of accuracy and consistency.
In this study, real-time camera observations revealed that during transient snowfall events with minimal accumulation, a thin snow layer may briefly appear on the surface. However, due to cloud contamination, Dataset 1 erroneously indicated clear-sky conditions based on MOD10A1 cloud information, highlighting the limitations of relying solely on a single satellite for snow detection. To improve snow detection accuracy, integrating observations from both Terra and Aqua satellites is essential. Yuan et al. (2022) emphasized that combining MOD10A1 and MYD10A1 daily snow products significantly enhances accuracy, especially in areas below 5000 m elevation, thereby reducing cloud-induced errors across varying terrain conditions. Hall et al. (2019) pointed out that inconsistencies exist in cloud masking and acquisition timing between Terra and Aqua satellite data. Therefore, combining snow cover data from both Terra and Aqua can effectively improve cloud removal accuracy, which is consistent with the conclusions of this study.

4.2 Optimization and application of cloud-free snow cover algorithm

Accuracy validation of snow products remains critical for improving remote sensing methodologies. Breen et al. (2023) demonstrated that camera networks are effective validation tools for satellite products, highlighting a key challenge—decreased accuracy of cloud-filling algorithms under prolonged cloudy conditions. Their study also established the MOD10A1 NDSI threshold through camera data validation, which is particularly useful for identifying errors related to canopy occlusion and cloud filling. Addressing the limitations of validation methods, Xin and Sheng (2024) proposed that high spatial and temporal resolution albedo products derived from camera networks and unmanned aerial vehicle (UAV) technology—providing centimeter-level resolution—offer a reliable benchmark for satellite product calibration. However, the spatial representation of time-lapse imagery in the study area remains limited, underscoring the need for further efforts to extend validation (Berman et al., 2018).
Future research should aim to establish a coordinated "point-to-area" validation framework by expanding the phenological camera network and integrating multispectral data from Landsat-8 and Sentinel-2. Special emphasis should be placed on optimizing camera placement to account for slope orientation and elevation variations in complex mountainous terrains. Expanding localized observations to regional snow information will enhance the evaluation of snow datasets, providing further evidence to support our findings. Once additional phenological camera station data are incorporated, a comprehensive assessment of multiple snow datasets will be conducted to improve research accuracy and analyze the impact of topography and snow heterogeneity on inversion results.
Regarding algorithm optimization, Ide and Oguma (2013) developed a method for monitoring snow-covered areas and vegetation phenology using real-time cameras. Luo et al. (2022) demonstrated that integrating MODIS data with time-lapse photography and machine learning significantly improves binary snow classification accuracy in forest areas. Parajka et al. (2012) and Garvelmann et al. (2013) effectively enhanced cloud removal efficiency and snow cover discrimination in complex scenes by integrating real-time cameras with remote sensing data. Time-lapse cameras also accurately capture the temporal dynamics of snow accumulation and melting (Berman et al., 2018), particularly in areas prone to rapid snowmelt events, such as central Xinjiang. This necessitates the development of algorithms with dynamic adaptability, requiring further integration of instantaneous environmental parameters and multi-source remote sensing data to balance processing efficiency and accuracy.
Furthermore, the effects of topographic complexity (e.g., slope orientation and elevation) and snow dynamics (e.g., transient snow events) on inversion results remain insufficiently quantified in existing studies. This highlights the need to incorporate multi-source auxiliary data, such as land surface temperature and vegetation indices, as well as dynamic environmental parameters (Dong and Menzel, 2017). Vegetation cover, an important factor influencing snow accumulation and melting, must also be considered. Under different land surfaces, changes occur in the temperature and moisture conditions of the surface soil and soil layers, while vegetation can reflect solar radiation, with varying solar radiation absorption rates depending on the type of land surface. The amount of solar radiation directly affects the temperature, thereby influencing the accumulation and melting of snow (Wang et al., 2023). Dong and Menzel (2016) effectively mitigated snow information overestimation by incorporating meteorological fields, such as minimum temperature and precipitation, alongside ground observations.

4.3 Future development and optimization strategies

To address the challenge of delays in cloud removal data processing, future research should focus on improving the accuracy of relevant algorithms for specific stations, such as Chahanwusu and other arid areas of Xinjiang, including the Tarim Basin. In addition, the variability and stability of snow cover must be considered. Combining time-series models with machine learning-based cloud removal strategies can enhance models' adaptability to complex terrain conditions and dynamic snow cover variations. Future studies should continue exploring the integration of multi-source data fusion technologies with machine learning and artificial intelligence methods. Advances in intelligent and efficient cloud removal processing will unlock greater potential for practical applications. Furthermore, the manual visual interpretation of real-time camera data is crucial, particularly for analyzing transient snow cover phenomena, such as sudden accumulation, rapid disappearance, and thin snow layers, and their impact on snow-derived water resources. These findings offer new insights and potential solutions for processing snow data in central Xinjiang, especially in areas characterized by complex topography and rapidly changing snow conditions.

5 Conclusions

This study evaluated the performance of four cloud-free MODIS snow cover datasets in the complex mountainous terrain of the Tianshan Mountains, central Xinjiang, China and provided insights into the effectiveness of cloud removal algorithms in these challenging environments. The results highlighted that Dataset 2 performed consistently well across different snow periods, other datasets, such as Dataset 1 and Dataset 3, showed variable accuracy, particularly under prolonged cloud cover. The analysis of real-time camera observations further underscored the challenges posed by cloud contamination and terrain complexity, especially in areas with unstable snow cover, such as Chahanwusu Station.
In addition to validating snow products under clear-sky and cloudy conditions, this study emphasizes the need for more refined cloud removal strategies that account for terrain variability, land cover heterogeneity, and snow dynamics. The integration of multi-source data fusion technologies and machine learning-based approaches holds considerable potential for enhancing the performance of cloud-free snow detection products. Future research should focus on expanding the scope of validation efforts, incorporating more phenological camera networks, and integrating advanced remote sensing techniques like UAVs and multispectral data to improve snow monitoring accuracy in mountainous areas. The findings of this study provide a solid foundation for improving snow cover monitoring and water resource management in alpine areas, contributing valuable perspectives to the development of more advanced cloud removal methods.

Conflict of interest

The authors declare that they have no known competing financial interests or personal relationships that could have appeared to influence the work reported in this paper.

Acknowledgements

This study was funded by the Third Xinjiang Scientific Expedition Program (2021xjkk1400), the National Natural Science Foundation of China (42071049), the Natural Science Foundation of Xinjiang Uygur Autonomous Region (2019D01C022), the Xinjiang Uygur Autonomous Region Innovation Environment Construction Special Project & Science and Technology Innovation Base Construction Project (PT2107), and the Tianshan Talent-Science and Technology Innovation Team (2022TSYCTD0006). We appreciated the anonymous reviewers for their insightful suggestions on the improvement of this manuscript.

Author contributions

Conceptualization: MA Yonggang, LI Junli; Data curation: MA Yonggang, WANG Qingxue; Methodology: WANG Qingxue; Formal analysis: MA Yonggang, WANG Qingxue; Software: WANG Qingxue; Writing - original draft preparation: WANG Qingxue; Writing - review and editing: XU Zhonglin, MA Yonggang, LI Junli; Visualization: WANG Qingxue; Supervision: XU Zhonglin, MA Yonggang, LI Junli. All authors approved the manuscript.
[1]
Bergeron J, Royer A, Turcotte R, et al. 2014. Snow cover estimation using blended MODIS and AMSR-E data for improved watershed-scale spring streamflow simulation in Quebec, Canada. Hydrological Processes, 28(16): 4626-4639.

[2]
Berman E E, Bolton D K, Coops N C, et al. 2018. Daily estimates of Landsat fractional snow cover driven by MODIS and dynamic time-warping. Remote Sensing of Environment, 216: 635-646.

[3]
Breen C, Vuyovich C, Odden J, et al. 2023. Evaluating MODIS snow products using an extensive wildlife camera network. Remote Sensing of Environment, 295: 113648, doi: 10.1016/j.rse.2023.113648.

[4]
Burgos V L, Gupta H V, Clark M. 2013. Reducing cloud obscuration of MODIS snow cover area products by combining spatio-temporal techniques with a probability of snow approach. Hydrology and Earth System Sciences, 17(5): 1809-1823.

[5]
Chen K, Cao X G, Yang J H, et al. 2014. A method of generating national snow-cover model based on C4.5 algorithm of decision tree. Electronic Design Engineering, 22(17): 44-47. (in Chinese)

[6]
Chen S Y, Wang X Y, Guo H, et al. 2020. A conditional probability interpolation method based on a space-time cube for MODIS snow cover products gap filling. Remote Sensing, 12(21): 3577, doi: 10.3390/rs12213577.

[7]
Deng G, Tang Z G, Dong C Y, et al. 2024. Development and evaluation of a cloud-gap-filled MODIS normalized difference snow index product over High Mountain Asia. Remote Sensing, 16(1): 192, doi: 10.3390/rs16010192.

[8]
Deng J, Huang X D, Feng Q S, et al. 2015. Toward improved daily cloud-free fractional snow cover mapping with multi-source remote sensing data in China. Remote Sensing, 7(6): 6986-7006.

[9]
Dietz A J, Kuenzer C, Conrad C. 2013. Snow-cover variability in central Asia between 2000 and 2011 derived from improved MODIS daily snow-cover products. International Journal of Remote Sensing, 34(11): 3879-3902.

[10]
Dong C Y, Menzel L. 2016. Improving the accuracy of MODIS 8-day snow products with in situ temperature and precipitation data. Journal of Hydrology, 534: 466-477.

[11]
Dong C Y, Menzel L. 2017. Snow process monitoring in montane forests with time-lapse photography. Hydrological Processes, 31(16): 2872-2886.

[12]
Eastman R, Warren S G, Hahn C J. 2021. Climatic Atlas of Clouds Over Land and Ocean. Department of Atmospheric Sciences University of Washington. Seattle Washington 98195-1640. [2024-03-30]. http://www.atmos.washington.edu/CloudMap/index.html.

[13]
Gafurov A, Bárdossy A. 2009. Cloud removal methodology from MODIS snow cover product. Hydrology and Earth System Sciences, 13(7): 1361-1373.

[14]
Gao Y, Wang X T, Mou N X, et al. 2024. Evaluating MODIS cloud-free snow cover datasets using massive spatial benchmark data in the Tibetan Plateau. Science of the Total Environment, 949: 175245, doi: 10.1016/j.scitotenv.2024.175245.

[15]
Garvelmann J, Pohl S, Weiler M. 2013. From observation to the quantification of snow processes with a time-lapse camera network. Hydrology and Earth System Sciences, 17(4): 1415-1429.

[17]
Gurung R D, Kulkarni A V, Giriraj A, et al. 2011. Changes in seasonal snow cover in Hindu Kush-Himalayan Region. The Cryosphere Discussions, 5(2): 755-777.

[18]
Hall D K, Riggs G A, DiGirolamo N E, et al. 2019. Evaluation of MODIS and VIIRS cloud-gap-filled snow-cover products for production of an Earth science data record. Hydrology and Earth System Sciences, 23(12): 5227-5241.

[19]
Hall D K, Riggs G A, DiGirolamo N E, et al. 2024. Comparison of the NASA standard moderate-resolution imaging spectroradiometer and visible infrared imaging radiometer suite snow-cover products for creation of a climate data record: A case study in the Great Basin of the Western United States. Remote Sensing, 16(16): 3029, doi: 10.3390/rs16163029.

[20]
Hao X H, Huang G H, Zheng Z J, et al. 2022. Development and validation of a new MODIS snow-cover-extent product over China. Hydrology and Earth System Sciences, 26(8): 1937-1952.

[21]
Haq M A, Ahmed A, Ilyas K, et al. 2022. Analysis of environmental factors using AI and ML methods. Scientific Reports, 12(1): 13267, doi: 10.1038/s41598-022-16665-7.

[22]
Hou J L, Huang C L, Zhang Y, et al. 2022. Reconstructing a gap-free MODIS normalized difference snow index product using a long short-term memory network. IEEE Transactions on Geoscience and Remote Sensing, 60: 4304914, doi: 10.1109/TGRS.2022.3178421.

[23]
Hu R J. 2004. Physical Geography of Tianshan Mountains in China. Beijing: China Environmental Science Press, 39-57. (in Chinese)

[24]
Huang X D, Hao X H, Wang W, et al. 2012. Algorithms for cloud removal in MODIS daily snow products. Journal of Glaciology and Geocryology, 34(5): 1118-1126. (in Chinese)

[25]
Huang Y, Xu J H, Xu J Y, et al. 2022. HMRFS-TP: long-term daily gap-free snow cover products over the Tibetan Plateau from 2002 to 2021 based on hidden Markov random field model. Earth System Science Data Discussions, 14(9): 4445-4462.

[26]
Ide R, Oguma H. 2013. A cost-effective monitoring method using digital time-lapse cameras for detecting temporal and spatial variations of snowmelt and vegetation phenology in alpine ecosystems. Ecological Informatics, 16: 25-34.

[27]
Jing Y H, Li X H, Shen H F. 2022. STAR NDSI collection: a cloud-free MODIS NDSI dataset (2001-2020) for China. Earth System Science Data, 14(7): 3137-3156.

[28]
Li X H, Jing Y H, Shen H F, et al. 2019. The recent developments in cloud removal approaches of MODIS snow cover product. Hydrology and Earth System Sciences, 23(5): 2401-2416.

[29]
Li Y P, Chen Y N, Li Z. 2020. Climate and topographic controls on snow phenology dynamics in the Tienshan Mountains, Central Asia. Atmospheric Research, 236: 104813, doi: 10.1016/j.atmosres.2019.104813.

[30]
Liang T G, Zhang X T, Xie H J, et al. 2008. Toward improved daily snow cover mapping with advanced combination of MODIS and AMSR-E measurements. Remote Sensing of Environment, 112(10): 3750-3761.

[31]
Liu C Y, Huang X D, Li X B, et al. 2020. MODIS fractional snow cover mapping using machine learning technology in a mountainous area. Remote Sensing, 12(6): 962, doi: 10.3390/rs12060962.

[32]
Liu J P, Zang W C, Liu T. 2017. Monitoring recent changes in snow cover in Central Asia using improved MODIS snow-cover products. Journal of Arid Land, 9(5): 763-777.

[33]
Luo J F, Dong C Y, Lin K R, et al. 2022. Mapping snow cover in forests using optical remote sensing, machine learning and time-lapse photography. Remote Sensing of Environment, 275: 113017, doi: 10.1016/j.rse.2022.113017.

[34]
NCDC (National Cryosphere Desert Data Center). 2021 Daily fractional snow cover dataset over High Asia during 2002 to 2018. [2024-11-03]. https://cstr.cn/CSTR:11738.11.ncdc.nieer.2020.1660.

[35]
Painter T H, Brodzik M J, Racoviteanu A, et al. 2012. Automated mapping of Earth's annual minimum exposed snow and ice with MODIS. Geophysical Research Letters, 39(20): L20501, doi: 10.1029/2012GL053340.

[36]
Pan F B, Jiang L M, Wang G X, et al. 2024. MODIS daily cloud-gap-filled fractional snow cover dataset of the Asian water tower region (2000-2022). Earth System Science Data, 16(5): 2501-2523.

[37]
Parajka J, Blöschl G. 2008. Spatio-temporal combination of MODIS images - potential for snow cover mapping. Water Resources Research, 44(3): W03406, doi: 10.1029/2007WR006204.

[38]
Parajka J, Pepe M, Rampini A, et al. 2010. A regional snow-line method for estimating snow cover from MODIS during cloud cover. Journal of Hydrology, 381(3-4): 203-212.

[39]
Parajka J, Haas P, Kirnbauer R, et al. 2012. Potential of time-lapse photography of snow for hydrological purposes at the small catchment scale. Hydrological Processes, 26(22): 3327-3337.

[40]
Qiu Y B, Zhang H, Chu D, et al. 2017. Cloud removing algorithm for the daily cloud free MODIS-based snow cover product over the Tibetan Plateau. Journal of Glaciology and Geocryology, 39(3): 515-526. (in Chinese)

[41]
Qu J, Ding J L, Sun Y M. 2013. Improved SVM for extracting snow cover in northern Xinjiang. Resources Science, 35(2): 422-429. (in Chinese)

[42]
Stillinger T, Rittger K, Raleigh M S, et al. 2023. Landsat, MODIS, and VIIRS snow cover mapping algorithm performance as validated by airborne lidar datasets. The Cryosphere, 17(2): 567-590.

[43]
Tang Z G, Wang J, Li H Y, et al. 2013. Accuracy validation and cloud obscuration removal of MODIS fractional snow cover products over Tibetan Plateau. Remote Sensing Technology and Application, 28(3): 423-430. (in Chinese)

[44]
Tang Z G, Wang X R, Wang J, et al. 2017. Spatiotemporal variation of snow cover in Tianshan Mountains, Central Asia, based on cloud-free MODIS fractional snow cover product, 2001-2015. Remote Sensing, 9(10): 1045, doi: 10.3390/rs9101045.

[45]
Tang Z G, Deng G, Hu G J, et al. 2022. Satellite observed spatiotemporal variability of snow cover and snow phenology over High Mountain Asia from 2002 to 2021. Journal of Hydrology, 613: 128438, doi: 10.1016/j.jhydrol.2022.128438.

[46]
Thirel G, Salamon P, Burek P, et al. 2011. Assimilation of MODIS snow cover area data in a distributed hydrological model. Hydrology Earth System Sciences Discussions, 8(1): 1329-1364.

[47]
Tian F. 2023. Research on snow-based cloud removal based on machine learning and spatio-temporal change analysis. MSc Thesis. Nanjing: Nanjing University of Information Science & Technology, 15-18. (in Chinese)

[48]
Tong J, Déry S J, Jackson P L. 2009a. Interrelationships between MODIS/Terra remotely sensed snow cover and the hydrometeorology of the Quesnel River Basin, British Columbia, Canada. Hydrology and Earth System Sciences, 13(8): 1439-1452.

[49]
Tong J, Déry S J, Jackson P L. 2009b. Topographic control of snow distribution in an alpine watershed of western Canada inferred from spatially-filtered MODIS snow products. Hydrology and Earth System Sciences, 11(3): 319-326.

[50]
Wang Q X, Ma Y G, Li J L. 2023. Snow cover phenology in Xinjiang based on a novel method and MOD10A 1 data. Remote Sensing, 15(6): 1474, doi: 10.3390/rs15061474.

[51]
Wang X Y, Wang S Y, Yi H, et al. 2016. Snow phenology variability in the Qinghai-Tibetan Plateau and its response to climate change during 2002-2012. Journal of Geo-information Science, 18(11): 1573-1579. (in Chinese)

[52]
Wang Z Y, Che T. 2012. Spatiotemporal distribution of snow cover in arid regions in China. Arid Zone Research, 29(3): 464-471. (in Chinese)

[53]
Xia Q, Gao X G, Wei C, et al. 2012. Estimation of daily cloud-free, snow-covered areas from MODIS based on variational interpolation. Water Resources Research, 48(9): W09523, doi: 10.1029/2011WR011072.

[54]
Xin C, Sheng Y W. 2024. Enhancing glacier monitoring through adaptive smoothing of MODIS NDSI time series. Remote Sensing Letters, 15(10): 1047-1056.

[55]
Xing D, Hou J L, Huang C L, et al. 2022. Spatiotemporal reconstruction of MODIS normalized difference snow index products using U-net with partial convolutions. Remote Sensing, 14(8): 1795, doi: 10.3390/rs14081795.

[56]
Yu J Y, Zhang G Q, Yao T D, et al. 2016. Developing daily cloud-free snow composite products from MODIS Terra-Aqua and IMS for the Tibetan Plateau. IEEE Transactions on Geoscience and Remote Sensing, 54(4): 2171-2180.

[57]
Yuan Y C, Li B L, Gao X Z, et al. 2022. Validation of cloud-gap-filled snow cover of MODIS daily cloud-free snow cover products on the Qinghai-Tibetan Plateau. Remote Sensing, 14(22): 5642, doi: 10.3390/rs14225642.

[58]
Zhang H, Qiu Y B, Zheng Z J, et al. 2016. Comparative study of the feasibility of cloud removal methods based on MODIS seasonal snow cover data over the Tibetan Plateau. Journal of Glaciology and Geocryology, 38(3): 714-724. (in Chinese)

[59]
Zhang L H, Zhang H B, Sun X Y, et al. 2024. Combined use of multiple cloud-free snow cover products in China and its high-mountain region: implications from snow cover identification to snow phenology detection. Water Resources Research, 60(6): e2023WR036274, doi: 10.1029/2023WR036274.

[60]
Zhang X H, Qiu Z X, Peng C, et al. 2022a. Removing cloud cover interference from Sentinel-2 imagery in Google Earth Engine by fusing Sentinel-1 SAR data with a CNN model. International Journal of Remote Sensing, 43(1): 132-147.

[61]
Zhang Y, Gulimire H, Sulitan D, et al. 2022b. Monitoring and analysis of snow cover change in an alpine mountainous area in the Tianshan Mountains, China. Journal of Arid Land, 14(9): 962-977.

文章导航

/