• MENG Ruibing 1, 2, 3 ,
  • MENG Zhongju , 1, 2, 3, * ,
  • Brenton SHARRATT 4 ,
  • ZHANG Jianguo 5 ,
  • CAI Jiale 1, 2, 3 ,
  • CHEN Xiaoyan 6
展开

收稿日期: 2024-03-08

  修回日期: 2024-06-14

  录用日期: 2024-06-18

  网络出版日期: 2025-08-13

Threshold friction velocity influenced by soil particle size within the Columbia Plateau, northwestern United States

  • MENG Ruibing 1, 2, 3 ,
  • MENG Zhongju , 1, 2, 3, * ,
  • Brenton SHARRATT 4 ,
  • ZHANG Jianguo 5 ,
  • CAI Jiale 1, 2, 3 ,
  • CHEN Xiaoyan 6
Expand
  • 1College of Desert Control Science and Engineering, Inner Mongolia Agricultural University, Hohhot 010018, China
  • 2Key Laboratory of Aeolian Physics and Desertification Control Engineering from Inner Mongolia Autonomous Region, Inner Mongolia Agricultural University, Hohhot 010018, China
  • 3Key Laboratory of Desert Ecosystem Conservation and Restoration, State Forestry and Grassland Administration of China, Inner Mongolia Agricultural University, Hohhot 010018, China
  • 4USDA-Agricultural Research Service, Washington State University, Washington 99164, USA
  • 5College of Resources and Environment, Northwest A&F University, Yangling 712100, China
  • 6Inner Mongolia Autonomous Region Academy of Social Sciences, Hohhot 010010, China
*MENG Zhongju (E-mail: )

Received date: 2024-03-08

  Revised date: 2024-06-14

  Accepted date: 2024-06-18

  Online published: 2025-08-13

本文引用格式

MENG Ruibing , MENG Zhongju , Brenton SHARRATT , ZHANG Jianguo , CAI Jiale , CHEN Xiaoyan . [J]. Journal of Arid Land, 2024 , 16(8) : 1147 -1162 . DOI: 10.1007/s40333-024-0081-4

Abstract

Wind erosion is a geomorphic process in arid and semi-arid areas and has substantial implications for regional climate and desertification. In the Columbia Plateau of northwestern United States, the emissions from fine particles of loessial soils often contribute to the exceedance of inhalable particulate matter (PM) with an aerodynamic diameter of 10 μm or less (PM10) according to the air quality standards. However, little is known about the threshold friction velocity (TFV) for particles of different sizes that comprise these soils. In this study, soil samples of two representative soil types (Warden sandy loam and Ritzville silt loam) collected from the Columbia Plateau were sieved to seven particle size fractions, and an experiment was then conducted to determine the relationship between TFV and particle size fraction. The results revealed that soil particle size significantly affected the initiation of soil movement and TFV; TFV ranged 0.304-0.844 and 0.249-0.739 m/s for different particle size fractions of Ritzville silt loam and Warden sandy loam, respectively. PM10 and total suspended particulates (TSP) emissions from a bed of 63-90 μm soil particles were markedly higher for Warden sandy loam than for Ritzville silt loam. Together with the lower TFV of Warden sandy loam, dust emissions from fine particles (<100 μm in diameter) of Warden sandy loam thus may be a main contributor to dust in the region's atmosphere, since the PM10 emissions from the soil erosion surfaces and its ensuing suspension within the atmosphere constitute an essential process of soil erosion in the Columbia Plateau. Developing and implementing strategic land management practices on sandy loam soils is therefore necessary to control dust emissions in the Columbia Plateau.

1 Introduction

The Columbia Plateau is a vast basalt floodplain with complex topography that spans the states of Washington, Oregon, and Idaho, northwestern United States. Loess and sand deposits containing high levels of inhalable particulate matter (PM) dominate the soil of the Columbia Plateau (Goudie and Middleton, 2006; McDonald et al., 2012; Kawai et al., 2021). The arid areas of the Colombia Plateau have serious wind erosion problems, mainly caused by poor soil aggregation and frequent high wind events (Pi et al., 2018). Agricultural soils in most arid areas are managed through a crop rotation system involving winter wheat and summer fallow periods. The lack of vegetation cover during the summer fallow phase of this rotation greatly increases the soil's susceptibility to wind erosion (Colazo and Buschiazzo, 2015; Chang et al., 2023).
Wind erosion removes fertile topsoil and emits fine particles that degrade air and soil quality, causing varying degrees of harm and even catastrophic damage to the environment (Colazo and Buschiazzo, 2010). Based on their intrinsic physicochemical properties, atmospheric dust particles degrade visibility and air quality, which can lead to road closures and respiratory illnesses (Xing and Guo, 2008; Tominaga and Okuyama, 2022). Wind erosion has caused exceedance of inhalable PM with an aerodynamic diameter of 10 μm or less (PM10) according to the national air quality standards in the Columbia Plateau (Hwang et al., 2017; Kok et al., 2018). PM10 and fine PM persist in the atmosphere for prolonged periods, significantly impacting human health and atmospheric visibility (Field et al., 2010; Feng et al., 2011; Shao and Klose, 2016). Accordingly, rigorous methods are needed to assess and simulate the dynamics of fine PM emissions from soil during high wind events (Tominaga, 2022). With the global focus on climate change, desertification, and land degradation, current research continues to focus on modeling wind erosion and dust emission processes in agricultural and prairie environments (Borrelli et al., 2021). Feng and Sharratt (2007) adopted the Wind Erosion Prediction System (WEPS) to agricultural lands within the Columbia Plateau with varying degrees of success. They discovered that WEPS accurately simulated wind erosion only during three of the six high wind events that resulted in significant soil loss and appeared to overestimate soil loss. Pi et al. (2022) then improved the prediction accuracy by replacing the calculation component of threshold friction velocity (TFV) in the WEPS model, and quantitatively assessed the spatio-temporal patterns of wind erosion and PM10 emissions using Geographic Information System (GIS) in arid areas of northwestern United States (Pi et al., 2020a). They expressed the need to further understand the soil erodibility dynamics in simulating wind erosion.
Wind erosion is sensitive to changes in soil erodibility (Tanner et al., 2023). Indeed, wind erosion and PM10 emissions are greatly influenced by soil surface aggregate or particle size (Wang et al., 2019; Pi et al., 2023). TFV is a highly critical parameter in the wind erosion process that determines the frequency and intensity of wind erosion events (Zhang et al., 2021b). As wind speed increases and the TFV is approached, changes in turbulence and drag forces result in movement of particles on the soil surface. TFV is the minimum wind speed necessary to start sand particles moving along the soil surface (Kouchami-Sardoo et al., 2019). For stationary particles, the particles achieve motion when the drag and uplift forces overcome the gravity force acting upon the particles and cohesive forces acting between particles on the soil surface. The main equipment for sand particle motion threshold analysis is the wind tunnel, which is constructed by determining the frictional velocity of sand particle groups with different average diameters at the threshold using empirical curves of dimensionless Reynolds number functions (Bagnold, 1941). However, Miller and Komar (1977) discovered that the sharp upturn in TFV for fine particles occurs because of particle cohesion, rather than the Reynold number effect. In addition, Shao (2001) found that variation of dust emission efficiency with wind speed was related to soil conditions. Therefore, researchers have made a series of field experiments and wind tunnel studies to investigate the TFV of different textured soils under different soil conditions (wetness, standing crop residue, and tillage systems, etc.) (Feng and Shattatt, 2009; Sharratt et al., 2013; Wang et al., 2019). Although these studies have provided valuable insights into soil erosion, a deeper understanding of soil erodibility across varying particle sizes is crucial for enhancing the comprehension and modeling of wind erosion. The size and stability of aggregates determine the degree of soil vulnerability to wind and water erosion. Therefore, determining the fluctuations in TFV across different soil particle sizes is imperative, as it will aid us in implementing more effective soil conservation strategies to minimize the hazards posed by wind erosion.
TFV differs significantly among soils due to differences in cohesion and roughness. In general, TFV decreases and then increases with soil particle size. Soil particles with size fraction of 120-140 μm had the lowest TFV (Yue et al., 2012). The magnitude of TFV largely determines the surface soil erodibility. Marticorena et al. (1997) established a model to explain the TFV of particles with size of 60-120 μm in diameter and found that the most influential parameter affecting the TFV was aerodynamic roughness length. Etyemezian et al. (2019) calculated the TFV based on a surface roughness correction factor to avoid underestimating the TFV of rough surfaces. However, aerodynamic roughness length tends to vary during the wind erosion process and is mainly dependent on aggregate or particle size distribution.
Tillage during the summer fallow phase of the winter wheat-summer fallow rotation in the Columbia Plateau can degrade aggregates and soil structure. Thus, the impact of tillage on changes in soil properties affecting wind erosion is the central focus of soil erodibility research in the region (Sharratt and Feng, 2009). Sharratt and Vaddella (2014) determined that the TFV for sandy loam and silt loam soils in the Columbia Plateau varied from 0.140 to 0.240 m/s. They suggested that TFV varied as a result of differences in soil texture, environmental conditions, and anthropogenic disturbance. This study expands upon previous research in the Columbia Plateau by assessing the link between TFV and particle size of soils commonly found in the Columbia Plateau. The focus was placed on the refinement analysis of soil particles (<100 µm), with the aim to further reveal the effect of fine particle size on TFV and provide a scientific basis for developing more targeted soil conservation measures in the Columbia Plateau.

2 Methods and materials

2.1 Soil preparation and experimental design

The experiment was conducted in the summer of 2023 on farmlands near Washington in the Columbia Plateau, where semi-arid climate dominates and soils are composed of loess and sand deposits. In this study, we collected soil samples of two contrasting soil types representative of the Columbia Plateau. The sampling plot of Warden sandy loam (Mesic Xeric Haplocambids) was near Paterson, Washington (46°10′N, 119°37′W) with annual precipitation of 200 mm. The sampling plot of Ritzville silt loam (Andic Aridic Haplustoll) was near Ritzville, Washington (47°80′N, 118°28′W) with annual precipitation of 280 mm. Both sampling plots were subject to a winter wheat-summer fallow rotation. During the fallow phase of the winter wheat-summer fallow rotation, each plot was managed by wheat growers employing different tillage practices to control weeds and preserve soil moisture. Warden sandy loam has a higher sand content (67.52%) and lower clay content (9.21%) than Ritzville silt loam (with sand content of 30.53% and clay content of 11.42%). Dispersed particle size analysis using a Malvern Mastersizer laser diffractometer (Mastersizer, Malvern Instruments, Malvern, the United Kingdom) indicated that Warden sandy loam had a geometric mean diameter of 36 mm while Ritzville silt loam had a mean diameter of 20-29 mm (Sharratt and Vaddella, 2014).
Five sampling points were set up using the 'S' soil sampling method in each plot. Soil samples collected from the top 1 cm of soil from multiple sampling points in each plot were processed to obtain the erodible portion. Soil samples were air-dried at 70.00°C and then hand-sieved to collect particle size fractions of <45, 45-63, 63-90, 90-125, 125-150, 150-250, and 250-500 μm. This study used a portable wind tunnel (working section: 1.00 m width, 1.20 m height, and 7.30 m length) to produce free-stream wind speeds of 2-20 m/s to evaluate the TFV (Fig. 1). The test section featured plexiglass windows and removable metal trays. The bottom of wind tunnel was lined with sandpaper, mimicking the roughness of the soil surface in the trays. The wind tunnel was located inside a nonregulated climate facility, where relative humidity and temperature varied from 37.42% to 45.23% and 2.32°C to 13.11°C, respectively, during the experiment. The wind tunnel conditioned winds to resemble naturally occurring shear flow characteristics in the field. Wind was conditioned by flowing through a perforated plate to control vortex and velocity fluctuations, a honeycomb frame and wire mesh to reduce turbulence, and then non-uniform mesh components to create shear flow (Pietersma et al., 1996). The wind tunnel floor was built from wood coated with fine sand to simulate the boundary layer features of the natural bare soil surface. A 20 mm deep soil tray was recessed into the wooden floor 5.00 m downwind from the grill component so that the tray top remained level with the wooden floor. The soil trays and wooden floor were constructed with precision to minimize any gap between the soil trays and wooden floor. Soil composed of a specific size fraction of particles was placed in the 1.00 m×0.20 m×0.02 m metal soil tray and then the top of the tray was smoothed with a metal screed.
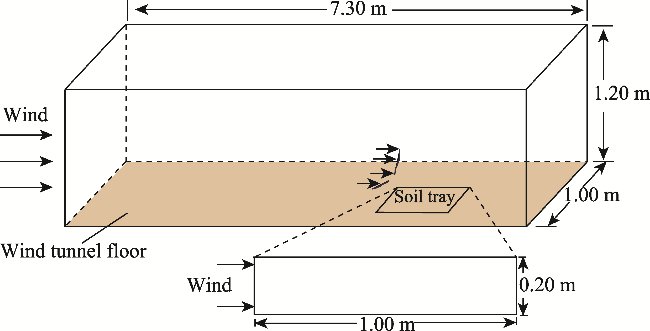
Fig. 1 Schematic diagram of soil tray position in the wind tunnel

2.2 Wind tunnel assessment

Wind speed was measured utilizing a pressure transducer connected to a pitot tube, which was mounted at six different heights (5, 10, 20, 30, 50, and 100 mm) above the soil surface at the leeward edge of the soil tray. Wind speed was corrected for atmospheric pressure and temperature that varied during the experiment. Sensor technology was used instead of visual observation to measure particle emissions from the soil tray because the PM emitted from the soil surface was too small and not visible to the naked eye. Simultaneous observations of PM10 and total suspended particulate (TSP) concentrations (mg/m3) were made at the leeward edge of the soil tray using the DUSTTRAK Aerosol Monitor (Model 8520, TSI Incorporated, Shoreview, USA) and E-sampler (Met One Instruments, Inc., Grants Pass, USA), respectively. Particulate sensors were mounted at the same height above the soil surface as wind speed sensors similar to previous studies (Copeland et al., 2009). The emission of soil particles from the tray as a function of wind speed was also monitored using a Sensit (Model H11-LIN, Sensit Company, Portland, USA). The Sensit was installed at a height of 50 mm above the soil surface. The entrance of the tunnel construction section was also equipped with particulate monitors for measuring background concentrations of PM10 and TSP. It was maintained that ambient dust concentrations in the wind tunnel facility were consistently low throughout the wind tunnel experiment. All sensors were programmed to record experimental parameters every second.

2.3 TFV determination

The TFV for each soil particle size fraction was determined by detecting the rise in PM10 and TSP concentrations downwind of the soil tray over background concentrations within a period of several seconds. In the wind tunnel, the TSP concentration remained essentially constant as wind speed increased. When wind speed reached the TFV, PM10 and TSP concentrations exceeded background concentrations at several heights. The TFV was measured by systematically raising the wind speed every 15 s until we observed an increase in PM10 or TSP concentration above the background for multiple seconds. This procedure ensures that a critical shear stress is reached, which allows particles or agglomerates to be released from the soil surface. This method of TFV determination (Sharratt et al., 2013) differs from visual inspection, which is probably more appropriate for detecting apparent movement of larger particles on the soil surface (Gillette and Passi, 1988). In some instances, saltation activity can facilitate assessing the TFV. We observed no saltation activity using the Sensit in this study. Once we observed that PM10 or TSP concentration rose above background concentrations during a 15 s period, we continued the experiment for 15 s to validate our observations. The experiment was replicated four times with each soil type and particle size fraction. The water potential of the soil surface in the tray was measured immediately before the soil was exposed in the wind tunnel and the wind speed reduced after each experiment. Although the duration of each measurement was short (about an average of 300 s), this method obtained the range of water potential for each soil type and particle size fraction during the experiment. Soil water potential was measured using either a dew point meter (WP4T, Decagon Devices, Pullman, Washington, USA) or filter paper technique (ASTM D5298-10, 2010). Fawcett and Collis-George (1967) verified that the filter paper technique is reliable and accurate. The soil in the soil tray was discarded after each replication. Wind speed profile parameters were calculated using the wind speed data collected at the six heights. Wind speed profile was fitted according to Prandtl-von Karman's logarithmic law (Roney and White, 2006), and friction velocity and aerodynamic roughness length were experimentally determined from the wind speed profile based on the following equation:
$u_{z}=\left(u_{*} / k\right) \ln \left(z / z_{0}\right) \text {, }$
where uz is wind speed (m/s) at height z (m); u* is the friction velocity (or shear velocity) (m/s); k is the von Karman's constant (k=0.4); and z0 is the aerodynamic roughness length (m). Aerodynamic roughness lengths for different particle sizes were determined by plotting the natural logarithm of height against wind speed (Dong et al., 2002). The optimal fit was determined through regression analysis using the least squares method and expressed mathematically as:
$u_{z}=a+b \ln z,$
where a and b are the regression coefficients, which are used to define the aerodynamic roughness length according to:
$z_{0}=\exp (-a / b).$
Combining Equations 1-3, friction velocity can be calculated as:
$u_{*}=k b.$
PM10 and TSP concentrations above background concentrations were typically found within 180-300 s of generating winds inside the wind tunnel. Our procedure attempted to eliminate errors introduced by contamination or singular or 1 s transient increases or peaks in PM10 or TSP concentration due to the emission of perched particles on the soil surface. Approximately 60 s was required to install the soil tray in the wind tunnel floor and to ready all instrumentation before generating winds to determine the TFV in a wind tunnel. The TFV (m/s) was determined from the friction velocity within 15 s after the PM10 or TSP concentration exceeded the above-background value.

3 Results and discussion

3.1 Variations in PM10 and TSP concentrations with particle size fraction for the two representative soils

Figures 2 and 3 show the variations in PM10 and TSP concentrations with particle size fraction for Warden sandy loam and Ritzville silt loam. During this experiment, PM10 and TSP concentrations changed dramatically with wind speed as the TFV was attained. Specifically, when wind speed exceeded TFV, Warden sandy loam showed the highest TSP and PM10 concentrations for particle size fractions of 63-90, 90-125, and 125-150 μm. The highest TSP and PM10 concentrations for Ritzville silt loam were observed in particle size fractions of 125-150 and 150-250 μm, respectively. This suggested that particles in size fraction of 63-150 μm for Warden sandy loam and in size fraction of 125-250 μm for Ritzville silt loam were most vulnerable generating PM10 emissions. Notably, PM10 and TSP emissions from Warden sandy loam were significantly higher than those from Ritzville silt loam when particle size was below 150 μm. This suggested that PM10 attached to Warden sandy loam tends to be released more rapidly than that attached to Ritzville silt loam under high shear stress or as a result of saltation bombardment. This difference may stem from the varying soil textures, as Warden sandy loam has a higher sand particle content (67.52%) than Ritzville silt loam (with sand content of 30.53%). Soils rich in sand content often lack aggregates, making it easy for fine particles to detach from the sand grains, thus becoming a significant source of PM10 emissions. Indeed, sandy soils with weak cohesive characteristic are more fragile and likely susceptible to bombardment as compared to the silty soils with stronger bonding characteristic. Additionally, soils with higher sand content show excellent water permeability and aeration. The absolute values of the rate of change in water potential of Warden sandy loam were significantly higher than those of Ritzville silt loam (Table 1). This indicates that sandy loam has stronger hydrophobicity and weaker water film binding force. Therefore, we assumed that both low particle forces and low aggregation can increase TSP emissions significantly.
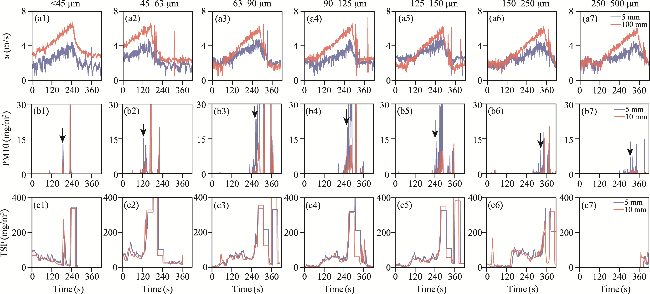
Fig. 2 Variations in wind speed (a1-a7) and PM10 (b1-b7) and TSP (c1-c7) concentrations at various heights above the soil surface of Warden sandy loam in different particle size fractions over time in the wind tunnel. u, wind speed; PM10, inhalable particulate matter with an aerodynamic diameter of 10 μm or less; TSP, total suspended particulates. Data presented are in soil particle size fractions of <45, 45-63, 63-90, 90-125, 125-150, 150-250, and 250-500 μm only for wind speed measured at heights of 5 and 100 mm and PM10 and TSP concentrations monitored at heights of 5 and 10 mm. Arrows define when TSP and PM10 concentrations are above background concentrations at multiple heights.
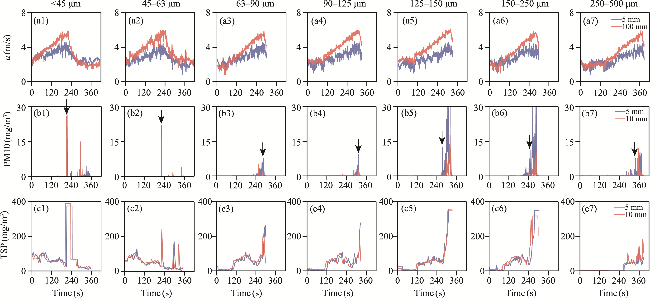
Fig. 3 Variations in wind speed (a1-a7) and PM10 (b1-b7) and TSP (c1-c7) concentrations at various heights above the soil surface of Ritzville silt loam in different particle size fractions over time in the wind tunnel. Data presented are in soil particle size fractions of <45, 45-63, 63-90, 90-125, 125-150, 150-250, and 250-500 μm only for wind speed monitored at heights of 5 and 100 mm and PM10 and TSP concentrations monitored at heights of 5 and 10 mm. Arrows defined when TSP and PM10 concentrations are above background concentrations at multiple heights.
Table 1 Water potential for the seven particle size fractions of the two representative soil types determined in the wind tunnel
Particle size fraction (μm) Warden sandy loam Ritzville silt loam
Water potential (MPa) Rate of change (%) Water potential (MPa) Rate of change (%)
Before After Before After
<45 -159.82 -136.44 -14.63 -164.37 -158.88 -3.34
45-63 -187.34 -137.79 -26.45 -163.78 -158.98 -2.93
63-90 -146.59 -125.92 -14.10 -238.16 -160.14 -32.76
90-125 -200.22 -145.03 -27.56 -225.64 -181.38 -19.62
125-150 -173.22 -136.05 -21.46 -233.01 -185.51 -20.39
150-250 -216.80 -154.71 -28.64 -232.59 -175.45 -24.57
250-500 -204.99 -122.03 -40.47 -231.29 -170.76 -26.17

Note: 'Before' indicated that the water potential of the surface 2 mm of soil in the tray was measured immediately prior to exposing the soil to wind; 'After' indicated that the water potential of the surface 2 mm of soil in the tray was measured after the wind subsided in the tunnel.

Soils of different textures exhibited significant differences in PM10 and TSP emissions across varying particle size fractions. The PM10 and TSP emissions from Warden sandy loam were significantly higher than those from Ritzville silt loam in most particle size fractions. However, in size fraction of 150-250 μm, the PM10 and TSP emissions from Ritzville silt loam were higher than Warden sandy loam. Notably, unlike Warden sandy loam, which has a higher sand content, aggregate fragmentation became the dominant process in the clay-rich soil of Ritzville silt loam. Interestingly, the highest PM10 and TSP emissions were found in size fraction of 125-150 μm for both soils. This may indicate that, compared to soils with smaller or larger particle sizes, for soils with medium texture, the detachment of dust attached to the soil surface, the fragmentation of aggregates, and the bombardment of saltating particles may collectively lead to continuous emissions of PM10 and TSP. Therefore, we hypothesized that the soil particles in size fraction of 125-150 μm were the predominant source of high PM10 concentrations in the Columbia Plateau (Fig. 4). This provides a new perspective for further research and controlling environmental pollution in the region.
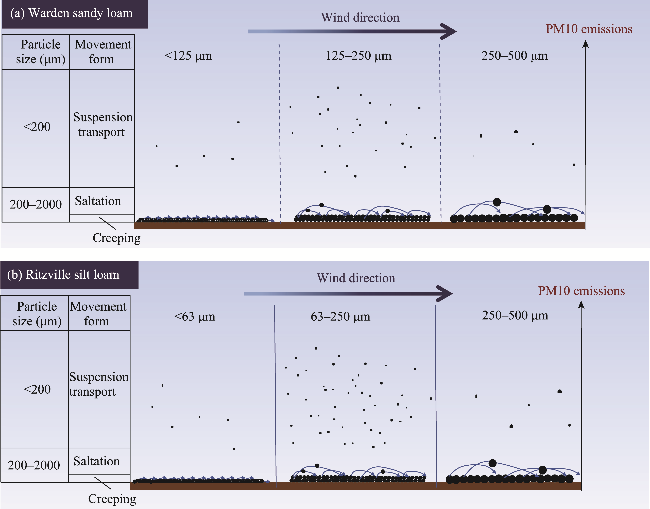
Fig. 4 Graphical representation of PM10 emissions for different particle size fractions of Warden sandy loam (a) and Ritzville silt loam (b)
Although the Sensit was used to detect potential saltation activity, there was a lack of saltation activity in our wind tunnel experiment. This is probably due to the limited size of the soil tray and the sensitivity constraints of the sensors, rather than the lack of saltation activity. Suspension at low wind speeds is generally considered a minor component of total dust flux because surface wind speeds are probably insufficient to overcome the interaction forces between fine particles, including capillary forces. In case of PM10 emissions from finer soils, we postulated that the suspension mechanism holds greater significance. Finer soil particles are more easily lifted by wind and suspended in the air, ultimately contributing to PM10 emissions. Conversely, in coarser soils, the generation of PM10 is predominantly driven by processes such as bombardment and abrasion, marking a distinct contrast in PM10 generation mechanisms. However, we cannot confirm that direct suspension will cause an increase in PM10 and TSP emissions. Although particle size and number can affect saltation activity, Van Pelt et al. (2009) found that the Sensit was not sensitive to particles smaller than 100 μm in diameter except at very high wind speeds. Moreover, Sharratt (2011) suggested that the Sensit lacked sensitivity for saltating particles smaller than 100 μm in diameter that can be commonly found in windblown dust in the Columbia Plateau. Thus, saltation may have occurred but was not detected with our instrumentation.

3.2 TFV of the two representative soil types in different particle size fractions

Figure 5 illustrates the wind speed profiles of the two representative soil types in varying particle size fractions. The good fit (R2>0.918) of the wind speed profile data provided confidence in estimating the TFV and aerodynamic roughness length. The TFV of Ritzville silt loam and Warden sandy loam ranged from 0.304 to 0.844 and 0.249 to 0.739 m/s, respectively, across all particle size fractions. It can be found that TFV is related to the particle size, particle shape, and microstructure of soil surface (Wang et al., 2008). The highest TFV for Ritzville silt loam occurred in size fraction of <45 μm while the highest TFV for Warden sandy loam occurred in size fraction of 45-63 μm. The increase trend in TFV with soil particle size fraction was significantly different between the two soil types.
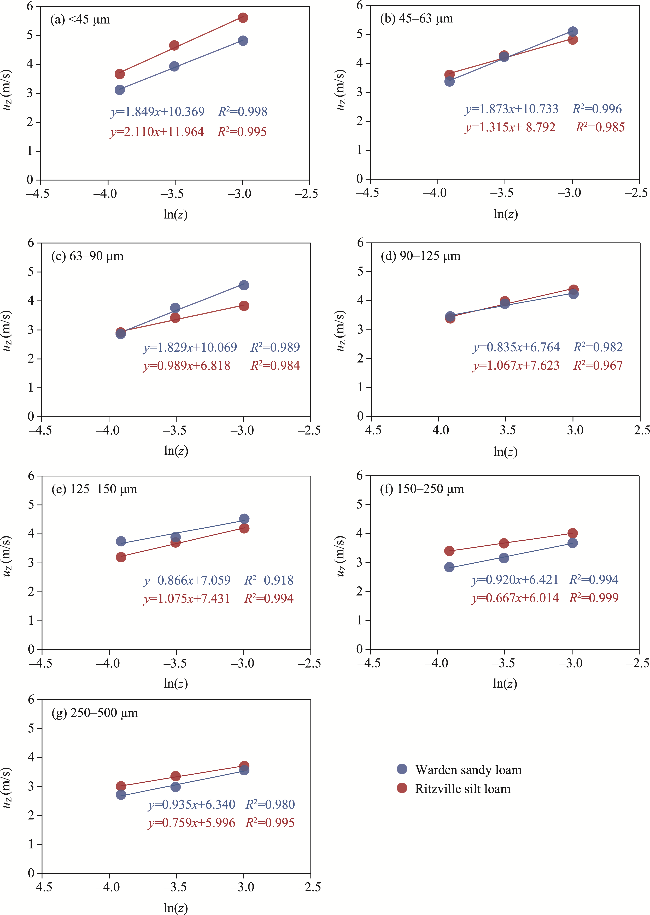
Fig. 5 Regression analysis between uz and ln(z) at 20, 30, and 50 mm above the soil surface of the two representative soil types in different particle size fractions. (a), <45 μm; (b), 45-63 μm; (c), 63-90 μm; (d), 90-125 μm; (e), 125-150 μm; (f), 150-250 μm; (g), 250-500 μm. uz is the wind speed at height z.
The TFV of the two soil types in different particle size fractions is shown in Figure 6. For size fraction of 45-63 μm, TFV differed between the two soil types. The TFV was significantly higher for Warden sandy loam (0.749 m/s) than for Ritzville silt loam (0.526 m/s). This difference in TFV may be related to differences in cohesive forces between soil aggregates (Greeley and Iversen, 1985; Colazo and Buschiazzo, 2010). In size fraction of 125-150 μm, Warden sandy loam had a lower TFV than Ritzville silt loam. In fact, the lowest TFV for both soil types occurred in size fraction of 250-500 μm. The TFV in size fraction of 250-500 μm was 64.01% and 66.27% lower than that in size fraction of <45 μm for Ritzville silt loam and Warden sandy loam, respectively.
In our study, exponential functions adequately described the relationship between TFV and particle size fraction (R2≥0.867), which can be used to estimate the response of TFV to particle size for the two soil types (Fig. 6). The standard errors of the fitted equation for both soil types ranged between 0.03 and 0.09 m/s. Indeed, estimating the TFV under known smooth, dry, fine-grain, loose, and bare soil surface conditions can be very effective. Accordingly, as soil particle size increased from 45 to 500 μm, TFV decreased for both soil types. Significant differences of TFV between the two soil types were observed in the same particle size fraction after saltation, because particle emission may also occur before the soil tray is placed in the wind tunnel, which corresponds to the static threshold observed during particle shaking. After the saltation process, Ritzville silt loam had the largest decrease in TFV when the particle size fraction varied from <45 to 45-63 μm. In contrast, Warden sandy loam had the largest decrease in TFV as the particle size fraction varied from 45-63 to 63-90 μm. These observations indicated that the largest differences in TFV can be found for particles smaller than 100 μm in size for the two soil types.
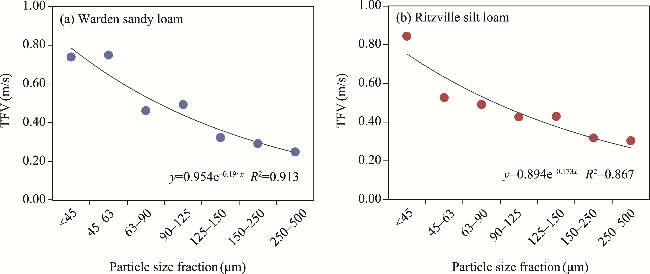
Fig. 6 Variation in threshold friction velocity (TFV) with particle size fraction for Warden sandy loam (a) and Ritzville silt loam (b)

3.3 Relationship between aerodynamic roughness length and TFV

Aerodynamic roughness length reflects the weakening effect of the soil surface on wind speed as well as wind and sand activity (Dong et al., 2002). It is related to the size of the particles or aggregates on the soil surface. As the aggregates or particles on the soil surface get larger, the aerodynamic roughness length increases. Figure 7 shows that the aerodynamic roughness length increased with soil particle size for the two representative soil types. The aerodynamic roughness length of Ritzville silt loam and Warden sandy loam increased by 0.043 and 0.049 mm, respectively, as the particle size increased from the smallest size fraction (<45 μm) to the largest size fraction (250-500 μm). The results indicated that as the particle size increases, the destructive force of the soil surface against the airflow increases, resulting in a rougher surface that can better trap and immobilise the soil particles, thus reducing wind erosion.
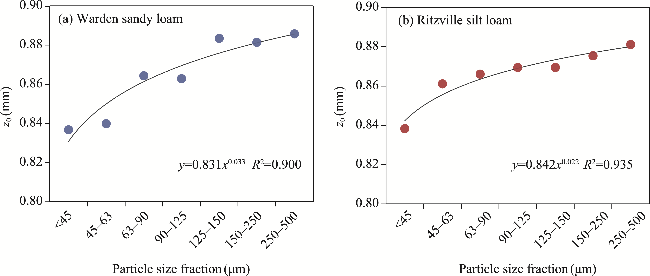
Fig. 7 Variation in aerodynamic roughness length (z0) with particle size fraction for Warden sandy loam (a) and Ritzville silt loam (b)
Etyemezian (2019) indicated that aerodynamic roughness length can affect the TFV. As shown in Figure 8, even within a narrow range of aerodynamic roughness length, TFV exhibited noticeable variations. Specifically, the intercept of the relationship between TFV and aerodynamic roughness length was -1.151 m/s for Ritzville silt loam and -0.742 m/s for Warden sandy loam, which indicated that TFV is greater for Warden sandy loam than for Ritzville silt loam with very little aerodynamic roughness length. Additionally, Figure 8 reveals a negative correlation between aerodynamic roughness length and TFV, indicating that a decrease in aerodynamic roughness length leads to an increase in TFV. This result may seem counterintuitive, as the TFV derived in this study focused on inhalable PM emissions from isolated soil particles of different size fractions, rather than the traditional soil erosion threshold. From a physical perspective, friction velocity is determined by the momentum transferred by the surface with a certain geometric roughness after absorbing the shear stress of the boundary layer flow. Therefore, changes in wind momentum absorbed by the erodible components of the soil surface will cause a change in friction velocity. The aerodynamic roughness length generated by the surface geometric roughness is the main factor affecting the friction velocity. This study revealed that finer soil fractions correspond to smaller aerodynamic roughness length.
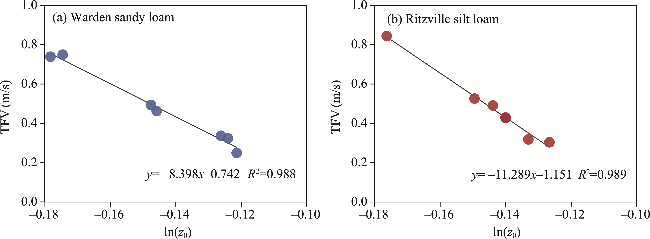
Fig. 8 Relationship between TFV and ln(z0) for Warden sandy loam (a) and Ritzville silt loam (b)

3.4 Further analysis of factors affecting the TFV

In arid and semi-arid areas, the impact of wind erosion on soil is a crucial factor shaping the landscape and biological potential of the surface (Shao, 2000; Chandler et al., 2004; Ebrahimi-Khusfi and Soleimani Sardoo, 2021). The size and stability of soil aggregates directly determine the sensitivity of soil to wind and water erosion (Kheirabadi et al., 2018; Yang et al., 2022; Zhu et al., 2022). This study found that the TFV of isolated particles in different size fractions was higher than previously reported results in the Columbia Plateau. For instance, Sharratt and Vaddella (2012) found that the TFV of Warden sandy loam was 0.139 m/s and the TFV of Ritzville silt loam was 0.180-0.239 m/s. This phenomenon may be attributed to the special properties of the soil particles in this study. The soil particles obtained through fine screening are smaller and have a uniform particle size distribution. This significantly reduces the gaps between particles, resulting in a compact structure. Under the same wind speed conditions, this compact structure makes it more difficult for the soil particles to be blown away by the wind, leading to higher TFV. Furthermore, experiments of Bagnold (1941) provided valuable insights, that is, even if the wind speed is sufficient to move fine stones with a diameter of 4600 μm, it is still difficult to blow finer cement sand in a stable airflow. The relationship between TFV and particle size is complex and not directly proportional. Larger particles generally require higher wind speeds to be blown away due to their increased mass and inertia, but other factors also play a role. For example, particle shape, soil moisture, and the presence of other particles can all affect the TFV (Tanner et al., 2018; Pi et al., 2020b). In our study, the particle size on the soil surface is relatively uniform, and a very smooth surface is formed after ironing treatment. This treatment results in a more uniform distribution of resistance across the entire soil bed, which has a profound impact on TFV measurement results. Additionally, the lack of particles susceptible to direct wind influence on the soil surface may also contribute to the higher TFV observed in this study.
Meanwhile, soil wind erosion is a complex phenomenon since it involves numerous interacting factors (Kjelgaard et al., 2004; Sundram et al., 2004; Zamani and Mathmoodabadi, 2013). Shao (2008) indicated that particle size distribution, soil wetness, soil surface roughness, aboveground biomass, and crust cover influence the TFV. The interaction of these factors determines the sensitivity of soil to wind erosion. Especially on dry and loosely sand surfaces, TFV is mainly influenced by the particle size of sand grains. If the particles are small enough, they will adhere well upon contact even when completely dry, and particularly in a vacuum. The TFV of Ritzville silt loam and Warden sandy loam ranged from 0.304 to 0.844 and 0.249 to 0.739 m/s, respectively, across particle size fractions in this study. We speculate that the difference in TFV between different particle size fractions of the two soil types may be partially attributed to variations in soil particle cohesion. Especially in fine-grained soils, cohesion is deeply influenced by intermolecular forces, including van der Waals forces, electrostatic forces, and capillary forces. Due to the large specific surface area of fine-grained soils, these intermolecular forces become more significant. In addition, different soil particle sizes have variable degrees of water repellency or hydrophobicity, with finer-grained materials requiring more suitable soil moisture (Shattatt, 2007; Ishizuka et al., 2008; Ravi et al., 2016). Interparticle capillary force is the primary factor resulting in increased TFV when soil moisture increases, and fine-grained soils retained more water than large-particle soil aggregates. We observed an average decrease of 8.99% in water potential for the two soil types in size fraction of <45 μm, while an average decrease of 33.32% was observed in size fraction of 250-500 μm. Interparticle cohesion plays a crucial role in the wind erosion of fine-grained materials (Colazo and Buschiazzo, 2010). As a result, moisture bonding and soil cohesion between soil particles in size fraction of <45 μm is much greater than that in size fraction of 250-500 μm, resulting in higher TFV.
Wind erosion generates dust, which serves as a significant source of atmospheric aerosols (Zhang et al., 2022; Gao et al., 2023). Agricultural practices that denude or disturb the soil in arid areas can therefore lead to environmental degradation. Potential dust emission is a complex yet crucial topic. According to previous studies, PM10 emissions increase with silt and clay content and decrease with sand content, and the difference in PM10 emissions may be related to variations in soil organic matter content, aggregate size distribution, and aggregate stability (Funk et al., 2008; Avecilla et al., 2016; Zhang et al., 2021a). This paper examined two representative soil types, unveiling a profound correlation between distinct soil particle size fractions and PM10 and TSP emissions. Our findings revealed that both PM10 and TSP emissions attain their apex for the two soil types when soil particle size falls between 125 and 150 μm. This suggested that a substantial amount of fine PM becomes suspended during the wind erosion process. It is widely accepted that the interaction between saltation components and soil surface largely depends on their composition, aggregation state, or strength during the wind erosion and dust emission processes. Our results align with this consensus, emphasizing the crucial role of high PM10 concentration and low aggregation in determining dust emission rates, especially highlighting the importance of soil particles in size fraction of 125-150 μm in dust generation. Once these complex particles or aggregates are set in motion by wind force, they can exhibit distinct behaviors in terms of PM10 emissions.

4 Conclusions

The Columbia Plateau is severely impacted by wind erosion. The sediment generated by wind erosion of farmlands remains suspended in the air and is the major cause of poor air quality and visibility during period of high winds. Therefore, ascertaining when sediment is emitted from the soil surface into the atmosphere is paramount to controlling wind erosion, but further research is needed to investigate the variation in TFV of diverse soils in the Columbia Plateau. The results showed that the TFV of Ritzville silt loam and Warden sandy loam in different particle size fractions ranged from 0.304 to 0.844 and 0.249 to 0.739 m/s, respectively. We also found that the TFV for the smallest size fraction (<45 μm) was significantly higher than that for the largest size fraction (250-500 μm) for both soil types. Therefore, soil particle size can dramatically affect soil wind erosion due to differences in TFV among particle sizes. Soil particles in size fraction of 125-150 μm are the primary source of high PM10 concentrations in the Columbia Plateau, and suspended sediments appear to constitute the majority of wind-blown sediments in this region, thereby elevating the risk of air quality deterioration. Therefore, it is imperative to advance and enforce strategic land management practices aimed at mitigating dust emissions in the Columbia Plateau to promote sustainable crop production in this region.

Conflict of interest

The authors declare that they have no known competing financial interests or personal relationships that could have appeared to influence the work reported in this paper.

Acknowledgements

This research was supported by the Basic Research Funds for Colleges and Universities directly under the Inner Mongolia Autonomous Region: Desert Ecosystem Protection and Restoration Innovation Team (BR 22–13–03).

Author contributions

Conceptualization: MENG Ruibing, MENG Zhongju, Brenton SHARRATT; Data curation: MENG Ruibing, ZHANG Jianguo; Formal analysis: CAI Jiale; Funding acquisition: MENG Zhongju; Investigation: MENG Ruibing, MENG Zhongju, ZHANG Jianguo; Methodology: Brenton SHARRATT, ZHANG Jianguo; Supervision: MENG Zhongju, Brenton SHARRATT; Validation: CAI Jiale, CHEN Xiaoyan; Visualization: MENG Ruibing, CAI Jiale, CHEN Xiaoyan; Writing - original draft: MENG Ruibing; Writing - review and editing: MENG Zhongju, Brenton SHARRATT. All authors approved the manuscript.
[1]
ASTM D5298-10. 2010. Standard test method for measurement of soil potential (suction) using filter paper. ASTM International, West Conshohocken, PA, USA.

[2]
Avecilla F, Panebianco J E, Buschiazzo D E. 2016. A wind-tunnel study on saltation and PM10 emission from agricultural soils. Aeolian Research, 22: 73-83.

[3]
Bagnold R A. 1941. The Physics of Blown Sand and Desert Dunes. London: Methuen, 91-96.

[4]
Borrelli P, Alewell C, Alvarez P, et al. 2021. Soil erosion modelling: A global review and statistical analysis. Science of the Total Environment, 780: 146494, doi: 10.1016/j.scitotenv.2021.146494.

[5]
Chandler D G, Blaesing-Thompson S, Busacca A. 2004. Geospatial assessment of agricultural lands critical to air quality on the Columbia Plateau, Washington State. Journal of Soil and Water Conservation, 59(4): 184-189.

[6]
Chang T T, Feng G, Paul V, et al. 2023. Soil health assessment for different tillage and cropping systems to determine sustainable management practices in a humid region. Soil and Tillage Research, 233: 105796, doi: 10.1016/j.still.2023.105796.

[7]
Colazo J C, Buschiazzo D E. 2010. Soil dry aggregate stability and wind erodible fraction in a semiarid environment of Argentina. Geoderma, 159(1-2): 228-236.

[8]
Colazo J C, Buschiazzo D E. 2015. The impact of agriculture on soil texture due to wind erosion. Land Degradation and Development, 26(1): 62-70.

[9]
Copeland N S, Sharratt B S, Wu J Q, et al. 2009. A wood-strand material for wind erosion control: Effects on total sediment loss, PM10 vertical flux, and PM10 loss. Journal of Environmental Quality, 38(1): 139-148.

[10]
Dong Z B, Liu X P, Wang X M. 2002. Aerodynamic roughness of gravel surfaces. Geomorphology, 43(1-2): 17-31.

[11]
Ebrahimi-Khusfi Z,Soleimani Sardoo M. 2021. Recent changes in physical properties of the land surface and their effects on dust events in different climatic regions of Iran. Arabian Journal of Geosciences, 14: 287, doi: 10.1007/s12517-021-06664-9.

[12]
Etyemezian V, Gillies J A, Mastin L G. 2019. Laboratory experiments of volcanic ash resuspension by wind. Journal of Geophysical Research Atmospheres, 124(16): 9534-9560.

[13]
Fawcett R G, Collis-George N. 1967. A fiter-paper method for determining the moisture characteristics of soil. Australian Journal of Experimental Agriculture, 7: 162-167.

[14]
Feng G L, Sharratt B S. 2007. Validation of WEPS for soil and PM 10 loss from agricultural fields within the Columbia Plateau of the United States. Earth Surface Processes and Landform, 32(5): 743-753.

[15]
Feng G L, Sharratt B S. 2009. Evaluation of the SWEEP model during high winds on the Columbia Plateau. Earth Surface Processes and Landform, 34(11): 1461-1468.

[16]
Feng G L, Sharratt B S, Young F. 2011. Soil properties governing soil erosion affected by cropping systems in the U.S. Pacific Northwest. Soil and Tillage Research, 111(2): 168-174.

[17]
Field J P, Belnap J, Breshears D D. 2010. The ecology of dust. Frontiers in Ecology and the Environment, 8(8): 423-430.

[18]
Funk R, Reuter H I, Hoffmann C, et al. 2008. Effect of moisture on fine dust emission from tillage operations on agricultural soils. Earth Surface Processes and Landforms, 33(12): 1851-1863.

[19]
Gao Q Q, Zhu X J, Wang Q H, et al. 2023. Enrichment and transfer of polycyclic aromatic hydrocarbons (PAHs) through dust aerosol generation from soil to the air. Frontiers of Environmental Science and Engineering. 17: 10, doi: 10.1007/s11783-023-1610-7.

[20]
Gillette D A, Passi R. 1988. Modeling dust emission caused by wind erosion. Journal of geophysical Research, 93(D11): 14233-14242.

[21]
Goudie A S, Middleton N J. 2006. Desert Dust in the Global System. Heidelberg: Springer, 13-31.

[22]
Greeley R, Iversen J D. 1985. Wind as a Geological Process on Earth, Mars, Venus and Titan. New York: Cambridge University Press, 33-61.

[23]
Hwang S H, Lee J Y, Yi S M, et al. 2017. Associations of particulate matter and its components with emergency room visits for cardiovascular and respiratory diseases. PLoS ONE, 12(8): e0183224, doi: 10.1371/journal.pone.0183224.

[24]
Ishizuka M, Mikami M, Leys J, et al. 2008. Effects of soil moisture and dried raindroplet crust on saltation and dust emission. Journal of Geophysical Research Atmospheres: Atmospheres, 113(D24): D24212, doi: 10.1029/2008JD009955.

[25]
Kawai K, Matsui H, Kimura R, et al. 2021. High sensitivity of Asian dust emission, transport, and climate impacts to threshold friction velocity. Scientific Online Letters on the Atmosphere, 17: 239-245.

[26]
Kheirabadi H, Mahmoodabadi M, Jalali V, et al. 2018. Sediment flux, wind erosion and net erosion influenced by soil bed length, wind velocity and aggregate size distribution. Geoderma, 323: 22-30.

[27]
Kjelgaard J, Sharratt B, Sundram I, et al. 2004. PM 10 emission from agricultural soils on the Columbia Plateau: Comparison of dynamic and time-integrated field-scale measurements and entrainment mechanisms. Agricultural and Forest Meteorology, 125(3-4): 259-277.

[28]
Kok J F, Ward D S, Mahowald N M. 2018. Global and regional importance of the direct dust-climate feedback. Nature Communications, 9(1): 241, doi: 10.1038/s41467-017-02620-y.

[29]
Kouchami-Sardoo I, Shirani H, Esfandiarpour-Boroujeni I, et al. 2019. Optimal feature selection for prediction of wind erosion threshold friction velocity using a modified evolution algorithm. Geoderma, 354: 113873, doi: 10.1016/j.geoderma.2019.07.031.

[30]
Marticorena B, Bergametti G, Gillette D, et al. 1997. Factors controlling threshold friction velocity in semiarid and arid areas of the United States. Journal of Geophysical Research: Atmospheres, 102(D19): 23277-23287.

[31]
McDonald E V, Sweeney M R, Busacca A J. 2012. Glacial outburst floods and loess sedimentation documented during Oxygen Isotope Stage 4 on the Columbia Plateau, Washington State. Quaternary Science Reviews, 45: 18-30.

[32]
Miller M C, Komar P D. 1977. The development of sediment threshold curves for unusual environments (Mars) and for inadequately studied materials (froam sand). Sedimentology, 24(5): 709-721.

[33]
Pi H W, Sharratt B, Schillinger W F, et al. 2018. Wind erosion potential of a winter wheat-summer fallow rotation after land application of biosolids. Aeolian Research, 32: 53-59.

[34]
Pi H W, Huggins D R, Abatzoglou J T, et al. 2020a. Modeling soil wind erosion from agro-ecological classes of the Pacific Northwest in response to current climate. Journal of Geophysical Research: Atmospheres, 125(2): e2019JD031104, doi: 10.1029/2019JD031104.

[35]
Pi H W, Huggins D R, Sharratt B. 2020b. Influence of clay amendment on soil physical properties and threshold friction velocity within a disturbed crust cover in the inland Pacific Northwest. Soil and Tillage Research, 202: 104659, doi: 10.1016/j.still.2020.104659.

[36]
Pi H W, Webb N P, Lei J, et al. 2022. Soil loss and PM 10 emissions from agricultural fields in the Junggar Basin over the past six decades. Journal of Soil and Water Conservation, 77(2): 113-125.

[37]
Pi H W, Webb N P, Huggins D R, et al. 2023. Effects of secondary soil aggregates on threshold friction velocity and wind erosion. Land Degradation and Development, 34(1): 16-27.

[38]
Pietersma D, Stetler L D, Saxton K E. 1996. Design and aerodynamics of a portable wind tunnel for soil erosion and fugitive dust research. Transactions of the Asae American Society of Agricultural Engineers, 39(6): 2075-2083.

[39]
Ravi S, Sharratt B S, Li J R, et al. 2016. Particulate matter emissions from biochar-amended soils as a potential tradeoff to the negative emission potential. Scientific Reports, 6: 35984, doi: 10.1038/srep35984.

[40]
Roney J A, White B R. 2006. Estimating fugitive dust emission rates using an environmental boundary layer wind tunnel. Atmospheric Environment, 40(40): 7668-7685.

[41]
Shao Y P. 2000. Physics and Modeling of Wind Erosion. The Netherlands: Kluwer Academic Publishers, 211-245.

[42]
Shao Y P. 2001. A model for mineral dust emission. Journal of Geophysical Research: Atmospheres, 106(D17): 20239-20254.

[43]
Shao Y P. 2008. Physics and Modelling of Wind Erosion. Berlin: Springer, 1-11.

[44]
Shao Y P, Klose M. 2016. A note on the stochastic nature of particle cohesive force and implications to threshold friction velocity for aerodynamic dust entrainment. Aeolian Research, 22: 123-125.

[45]
Sharratt B S. 2007. Instrumentation to quantify soil and PM10 flux using a portable wind tunnel. International Symposium on Air Quality and Waste Management for Agriculture, Broomfield, Colorado.

[46]
Sharratt B S, Feng G L. 2009. Windblown dust influenced by conventional and undercutter tillage within the Columbia Plateau, USA. Earth Surface Processes and Landforms, 34(10): 1323-1332.

[47]
Sharratt B S. 2011. Size distribution of windblown sediment emitted from agricultural fields in the Columbia Plateau. Soil Science Society of America Journal, 75(3): 1054-1060.

[48]
Sharratt B S, Vaddella V K. 2012. Threshold friction velocity of soils within the Columbia Plateau. Aeolian Research, 6: 13-20.

[49]
Sharratt B S, Vaddella V K, Feng G L. 2013. Threshold friction velocity influenced by wetness of soils within the Columbia Plateau. Aeolian Research, 9: 175-182.

[50]
Sharratt B S, Vaddella V K. 2014. Threshold friction velocity of crusted windblown soils in the Columbia Plateau. Aeolian Research, 15: 227-234.

[51]
Sundram I, Claiborn C, Strand T. 2004. Numerical modeling of windblown dust in the Pacific Northwest with improved meteorology and dust emission models. Journal of Geophysical Research Atmospheres, 109(D24): D24208, doi: 10.1029/2004JD004794.

[52]
Tanner S, Katra I, Argaman E, et al. 2018. Erodibility of waste (Loess) soils from construction sites under water and wind erosional forces. Science of the Total Environment, 616-617: 1524-1532.

[53]
Tanner S, Ben-Hur M, Argaman E, et al. 2023. The effects of soil properties and aggregation on sensitivity to erosion by water and wind in two Mediterranean soils. Catena, 221: 106787, doi: 10.1016/j.catena.2022.106787.

[54]
Tominaga Y, Okuyama T. 2022. Investigating threshold wind velocity for movement of sparsely distributed gravels in a wind tunnel: Effect of surface coarseness. Aeolian Research, 54: 100775, doi: 10.1016/j.aeolia.2022:100775.

[55]
Van Pelt R S, Peters P, Visser S. 2009. Laboratory wind tunnel testing of three commonly used saltation impact sensors. Aeolian Research, 1(1-2): 55-62.

[56]
Wang R D, Zhou N, Li Q, et al. 2008. Difference in wind erosion characteristics between loamy and sandy farmlands and the implications for soil dust emission potential. Land Degradation and Development, 29(12): 4362-4372.

[57]
Wang R D, Li Q, Zhou N, et al. 2019. Effect of wind speed on aggregate size distribution of windblown sediment. Aeolian Research, 36: 1-8.

[58]
Xing M, Guo L J. 2008. Research on dust emission low in soil wind erosion process. Scientia Sinica (Physica, Mechanica & Astronomica), 38 (8): 984-998. (in Chinese)

[59]
Yang M N, Tian X, Guo Z L, et al. 2022. Effect of dry soil aggregate size on microplastic distribution and its implications for microplastic emissions induced by wind erosion. Environmental Science & Technology Letters, 9(7): 618-624.

[60]
Yue G W, Jia H N, Lin H X. 2012. Release mechanism of soil particles in soil wind erosion. Arid Land Geography, 35(2): 248-253. (in Chinese)

[61]
Zamani S, Mathmoodabadi M. 2013. Effect of particle-size distribution on wind erosion rate and soil erodibility. Archives of Agronomy and Soil Science, 59(12): 1743-1753.

[62]
Zhang H T, Tian P F, Kang C L, et al. 2022. Regional organic matter and mineral dust are the main components of atmospheric aerosols over the Nam Co station on the central Tibetan Plateau in summer. Frontiers in Environmental Science, 10, doi: 10.3389/fenvs.2022.1055673.

[63]
Zhang J, Amonette J E, Flury M. 2021a. Effect of biochar and biochar particle size on plant-available water of sand, silt loam, and clay soil. Soil and Tillage Research, 212: 104992, doi: 10.1016/j.still.2021.104992.

[64]
Zhang Z C, Dong Z B, Qian G Q, et al. 2021b. Gravel-desert surface properties and their influences on the wind-erosion threshold friction velocity in North-West China. Boundary-Layer Meteorology, 179: 117-131.

[65]
Zhu X A, Liu W J, Yuan X, et al. 2022. Aggregate stability and size distribution regulate rainsplash erosion: Evidence from a humid tropical soil under different land-use regimes. Geoderma, 420: 115880, doi: 10.1016/j.geoderma.2022.115880.

文章导航

/