• HAN Qifei ,
  • XU Wei ,
  • LI Chaofan , *
展开

收稿日期: 2024-03-11

  修回日期: 2024-06-07

  录用日期: 2024-06-16

  网络出版日期: 2025-08-13

Effects of nitrogen deposition on the carbon budget and water stress in Central Asia under climate change

  • HAN Qifei ,
  • XU Wei ,
  • LI Chaofan , *
Expand
  • School of Geographical Sciences, Nanjing University of Information Science & Technology, Nanjing 210044, China
*LI Chaofan (E-mail: )

Received date: 2024-03-11

  Revised date: 2024-06-07

  Accepted date: 2024-06-16

  Online published: 2025-08-13

本文引用格式

HAN Qifei , XU Wei , LI Chaofan . [J]. Journal of Arid Land, 2024 , 16(8) : 1118 -1129 . DOI: 10.1007/s40333-024-0022-2

Abstract

Atmospheric deposition of nitrogen (N) plays a significant role in shaping the structure and functioning of various terrestrial ecosystems worldwide. However, the magnitude of N deposition on grassland ecosystems in Central Asia still remains highly uncertain. In this study, a multi-data approach was adopted to analyze the distribution and amplitude of N deposition effects in Central Asia from 1979 to 2014 using a process-based denitrification decomposition (DNDC) model. Results showed that total vegetation carbon (C) in Central Asia was 0.35 (±0.09) Pg C/a and the averaged water stress index (WSI) was 0.20 (±0.02) for the whole area. Increasing N deposition led to an increase in the vegetation C of 65.56 (±83.03) Tg C and slightly decreased water stress in Central Asia. Findings of this study will expand both our understanding and predictive capacity of C characteristics under future increases in N deposition, and also serve as a valuable reference for decision-making regarding water resources management and climate change mitigation in arid and semi-arid areas globally.

1 Introduction

The grasslands in Central Asia play a critical role in the global carbon (C) cycle (Li et al., 2015a; Zhu et al., 2022). A variety of factors (e.g., temperature, precipitation, carbon dioxide (CO2) concentration, land use change, etc.) affect C cycle in the terrestrial biosphere, in which nitrogen (N) deposition is a key constraint on the C dynamics (Lamarque et al., 2005; Liu et al., 2022). In recent decades, atmospheric N deposition has rapidly increased in global terrestrial ecosystems due to significant emissions of reactive N resulting from anthropogenic activities, such as the production and utilization of N fertilizers and the combustion of fossil fuels (Li et al., 2013; Decina et al., 2020; Li et al., 2021). The potential impact of increased atmospheric N deposition on grassland C sequestration is significant, particularly in N-limited Central Asian ecosystems (Jarsjö et al., 2017; Zang et al., 2022). However, the impact of N deposition on the C cycle in this area is uncertainty.
The amount of accessible N in the soil controls both C and water cycles in terrestrial ecosystems. Primary productivity in arid and semi-arid areas is restricted by the availability of water and, to a lesser degree, by the supply of N (Serafini et al., 2019). The IPCC (Intergovernmental Panel on Climate Change) report predicts that global surface average temperature will increase by around 1.1°C to 6.4°C by the end of this century (Mateus et al., 2022). It is estimated that drought stress would be intensified with global warming (Kim et al., 2023). The interactive effects of N deposition will be influenced by water scarcity, as water plays a crucial role in both soil microbial activity and plant photosynthetic capacity. However, the coupling effects of N deposition and climate change on water stress are still unclear. Few studies have investigated the impacts of elevated N levels on plants' responses to water stress, and the findings have been contradictory. Specifically, some studies have reported that N deposition alleviated the detrimental effects of water stress on plants, while others observed an opposite trend (Zhou et al., 2011; Friedrich et al., 2012; Liu et al., 2016).
Different approaches have been proposed to assess the impact of atmospheric N deposition on C dynamics in forest lands, including model simulation, N fertilizer experiment, empirical correlation between C uptake and N deposition, and stoichiometric scaling methodology (van der Graaf et al., 2021; Karlsson et al., 2022; McDonough and Watmough, 2023; Walker et al., 2023). However, accurately assessing the response of grassland C sequestration to atmospheric N deposition on a large scale remains a significant challenge due to the intricate processes involved in external N uptake and allocation within natural ecosystems (Templer et al., 2012). Based on the biogeochemical cycling of C and N, Li et al. (1992) have developed a process oriented denitrification decomposition (DNDC) model, which describes C dynamics and greenhouse gas emissions. The model is capable of predicting vegetation growth and productivity, soil C and N dynamics, C sequestration, as well as soil-borne trace gas emissions across diverse ecosystems.
Therefore, this study investigated the effects of N deposition in driving the changes of C and water status in the grasslands of Central Asia. The aims of this study are: (1) to ascertain the specific impact of N deposition on C and water dynamics in diverse grasslands in Central Asia; and (2) to evaluate the combined effects of climate change and N deposition on C and water status at regional scales.

2 Materials and methods

2.1 Study area

The grasslands of Central Asia are located between 30°-50°N and 40°-105°E (Fig. 1), and belong to typical temperate continental climate. The significant variation in altitude within the area (-173-7347 m a.s.l.) results in distinct vertical zonation of vegetation with grassland types ranging from desert grassland (DG), temperate grassland (TG), and forest meadow (FM) (Han et al., 2014). The annual mean temperature in this area is recorded at 3.80℃, while the mean annual precipitation is 1949.0 mm, with June to September contributing to approximately 60.6% of the annual total precipitation. The mountainous areas in the southeastern Central Asia are much wetter with an average of 500.0 mm/a (Ta et al., 2018). The mean temperature is 15.00℃ in the low latitude areas and below 0.00℃ in the high latitude areas (Mitchell and Jones, 2005). Datasets revealed a significant regional increase in surface air temperature ranging from 0.36℃ to 0.42°C over the past 33 a (Hu et al., 2014).
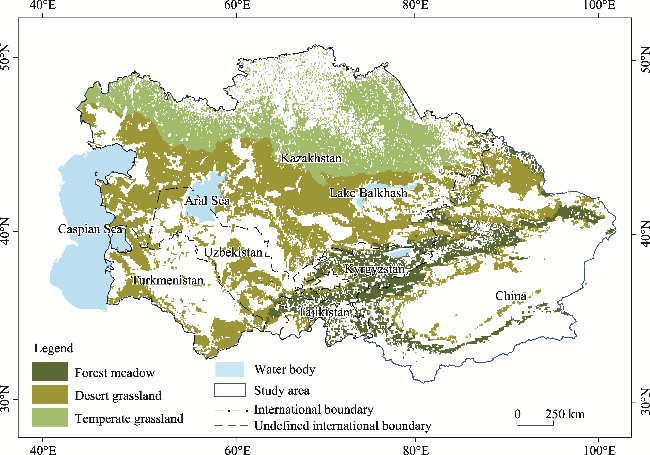
Fig. 1 Study area and types of grassland in Central Asia. Note that the figure is based on the standard maps (GS(2016)1666 and GS(2019)1822) of the Map Service System (https://bzdt.ch.mnr.gov.cn/), and the international boundaries have not been modified.

2.2 DNDC model and data collection

The DNDC model was originally developed for the estimation of C sequestration and N2O emissions in agricultural ecosystems. Through long-term application (Li et al., 1992), researchers have used this model to simulate biogeochemical C cycle for almost all terrestrial ecosystems (i.e., farmlands, forest lands, wetlands, and grasslands) (Smakgahn et al., 2009; Li et al., 2012; Katayanagi et al., 2013; Guest et al., 2017; Wu et al., 2018). The model comprises six interconnected sub-models, encompassing soil and climate processes, vegetation growth dynamics, decomposition mechanisms, as well as nitrification, denitrification, and fermentation processes. It is primarily driven by four fundamental ecological factors, i.e., climate conditions, soil properties, vegetation characteristics, and management practices (Li et al., 1992).
Detailed information on soil parameters, including clay fraction, textural class, drainage rate, bulk density, organic C content, pH value, and cation exchange capacity are extracted from the corresponding grid cell in the Harmonized World Soil Database (HWSD) (https://gaez.fao.org/pages/hwsd) (FAO/IIASA/ISRIC/ISS-CAS/JRC, 2009). Elevation data were derived from the WorldClim data (http://www.worldclim. org/download) (Hijmans et al., 2005). The spatial data were subsequently smoothed to a resolution of 40 km. N deposition data derived from a mosaic Asian anthropogenic emission inventory under the international collaboration framework of the Model Inter-Comparison Study for Asia (MICS-Asia) (Li et al., 2017). Three different long-term gridded atmospheric reanalysis datasets were used including Medium-Range Weather Forecasts (ECMWF) Re-Analysis-Interim (ERA-Interim), Modern-Era Retrospective analysis for Research and Applications (MERRA), and Climate Forecast System Reanalysis (CFSR). ERA-Interim is a global atmospheric reanalysis produced by the European Centre for ECMWF with a spatial resolution of about 80 km (https://www.ecmwf.int/en/forecasts/dataset/ecmwf-reanalysis-interim). The time frame covered by the dataset starts from 1 January 1979 and continuously updated in near-real time. Detailed description of ERA-Interim data archive is given in Dee et al. (2011). MERRA was generated utilizing the Goddard Earth Observing System Data Assimilation System v.5.0 (GEOS-5), comprising of the GEOS-5 atmospheric model and the Grid-point Statistical Interpolation (GSI) analysis system (Rienecker et al., 2011). The MERRA data set is available from 1979 and onwards with a resolution of 0.50°×0.65° (https://disc.gsfc.nasa.gov/information/mission-project?title=MERRA-2). The CFSR is designed and executed as a globally comprehensive and high-resolution coupled atmosphere-ocean-land surface-sea ice system, aiming to provide the most accurate estimation of the state of these interconnected domains during the study period (https://rda.ucar.edu/datasets/ds093.0/). The CFSR global atmosphere data exhibit a spatial resolution of approximately 38 km, and have been available since 1979 (Saha et al., 2014). The datasets exhibit variations in terms of their spatial and temporal resolution, available time period, as well as the methodology employed for their derivation. To facilitate a direct comparison among simulations, we standardized the datasets to a uniform spatial (40 km×40 km) and temporal scale (daily resolution). The time period of 1979-2014 was adopted as the common interval for air temperature, precipitation, and shortwave radiation serving as shared climate variables across all datasets.

2.3 Model validation and simulation design

After parameterizing the DNDC model in arid grasslands, a total of 48 net primary productivity (NPP) and 6 vegetation C were used for model validation. Due to the limited availability of validation data in Central Asia, we collected data from grasslands that exhibit similar conditions to our own grassland ecosystem from other literatures (Anwar et al., 2006; Zhao et al., 2006, 2007; Zhang et al., 2008; Fan et al., 2009; Toderich et al., 2009; Yan, 2009; Yang et al., 2010; Zhang et al., 2012). We used R2 to verify the accuracy of DNDC model, which can reflect the consistency between simulated and observed values.
For this study, the effects of N deposition, climate change, and grazing on C and water dynamics were evaluated through three distinct simulations. We designed two groups of management practice scenarios for this purpose with and without N deposition. Prior to conducting various simulations, we utilized the mean values of temperature, precipitation, and N deposition rates spanning from 1979 to 2014 in conjunction with other model initial datasets for model spin-up until C and N pools achieved equilibrium.

2.4 Water stress index (WSI)

The leaf temperature data were utilized to calculate the WSI for both the controlled environment and field components of this study. To determine WSI, we employed the empirical method proposed by Gardner et al. (1992), consisting of the following equation:
$\mathrm{WSI}=\left(d T_{m}-d T_{L L}\right) /\left(d T_{U L}-d T_{L L}\right),$
where dT is the difference between leaf temperature and ambient air temperature (°C); and the subscripts m, LL, and UL represent measured, lower limit, and upper limit temperature differences, respectively.

3 Results

3.1 Validation

We conducted a comparative analysis between site simulations and observations to assess the accuracy of NPP and vegetation C estimates, which serve as indicators of ecosystem C dynamics. The R2 values between observed and simulated NPP and vegetation C were 0.83 and 0.99, respectively (Fig. 2). The agreement between observed and simulated values was generally satisfactory, indicating that the model is suitable for simulating the spatial and temporal variations of C dynamics in Central Asia.
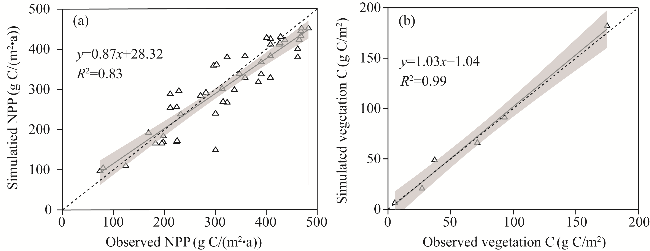
Fig. 2 Validation of simulated and observed net primary productivity (NPP; a) and vegetation carbon (C; b). Shaded gray area represents the 95% confidence interval. Dashed line represents the 1:1 goodness-fit-line.

3.2 Trends in simulated vegetation C and WSI

Figure 3 shows spatial distribution of simulated annual average vegetation C during the period 1979-2014. Total vegetation C in Central Asia was 0.35 (±0.09) Pg C/a for the whole area. The highest vegetation productivity was distributed in FM where average vegetation C was 165.30 (±47.36) g C/(m2•a), while DG and TG had a lower NPP. WSI with values ranging from 0.00 (maximum stress) to 1.00 (no stress), and the average WSI was 0.20 (±0.02) in Central Asia. WSI was also high in FM (0.34) and was the lowest in DG with mean WSI of 0.09 (±0.01). The temporal variations of vegetation C during the period 1979-2014 are shown in Figure 4. The simulated vegetation C increased by 3.27g C/(m2•a) (R2=0.83; Fig. 4a), while WSI showed no upward or downward trend.
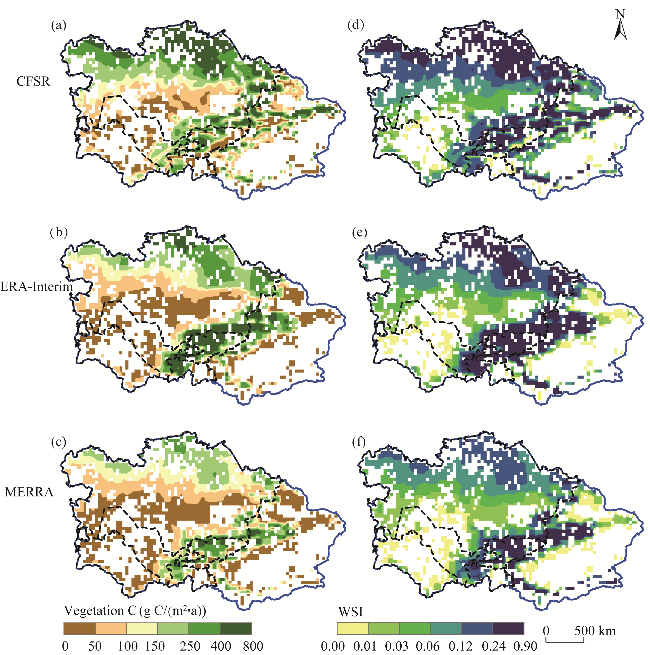
Fig. 3 Spatial distribution of vegetation C and water stress index (WSI) of grasslands in Central Asia during the period 1979-2014 under nitrogen (N) deposition simulated by Climate Forecast System Reanalysis (CFSR) (a and d), Medium-Range Weather Forecasts (ECMWF) Re-Analysis-Interim (ERA-Interim) (b and e), and Modern-Era Retrospective analysis for Research and Applications (MERRA) (c and f). The abbreviations are the same in the following figures.
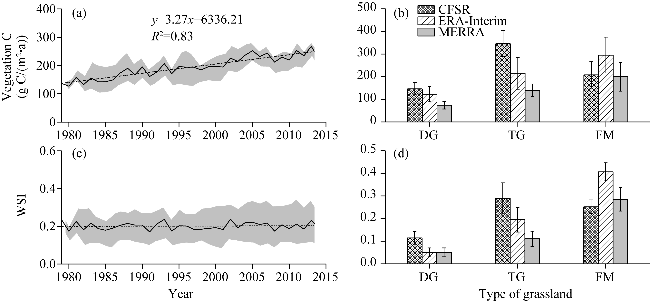
Fig. 4 Trends of vegetation C (a) and WSI (c) and their values (c and d) of different types of grassland in Central Asia during the period 1979-2014 under N deposition simulated by CFSR, ERA-Interim, and MERRA. DG, desert grassland; TG, temperate grassland; FM, forest meadow. Shaded gray area in Figure 4a and c represents the 95% confidence interval and dashed line represents the fitting line. Bars are standard errors. The abbreviations are the same in the following figures.

3.3 N effects on C dynamics and WSI

Figures 5 and 6 show N influence on vegetation C difference and WSI variation during the period 1979-2014. During the past 36 a, increasing N deposition led to an increase in vegetation C of 65.56 (±83.03) Tg C at regional scale. As simulated in our experiments, the areas in which N deposition had a large effect on vegetation C were mainly located in DG (Figs. 5a-c and 6a). In these areas, N deposition increased vegetation C by more than 1.41 (±0.98) g C/(m2•a). N deposition also evidently increased vegetation C in FM by 0.68 (±0.61) g C/(m2•a), while decreasing trend was found in TG. Changes in N deposition led to vegetation C decreases of more than 31.83 (±75.83) Tg C in TG during the period 1979-2014. During the past 36 a, N deposition slightly decreased WSI in Central Asia. In addition, N deposition-induced decline in WSI was apparent in TG than in other grasslands. N deposition almost had no effect on WSI in the enriched DG (Figs. 5d-f and 6b).
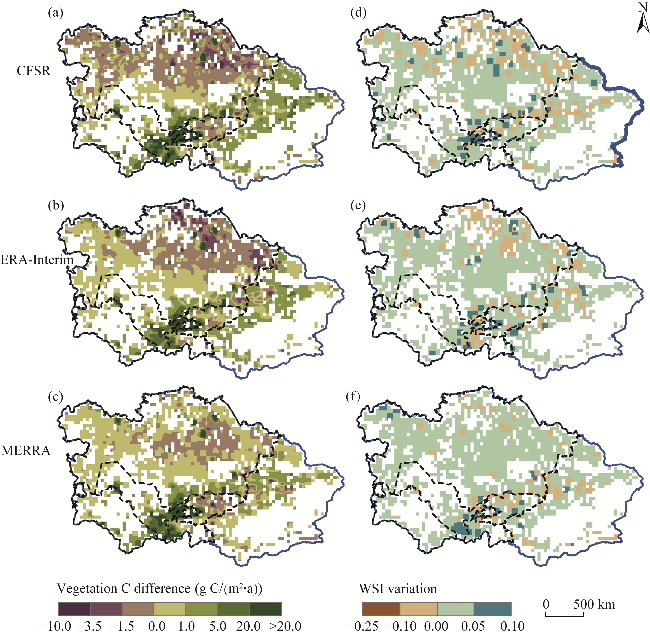
Fig. 5 Spatial distributions of vegetation C difference and WSI variation under N deposition simulated by CFSR (a and d), ERA-Interim (b and e), and MERRA (c and f)
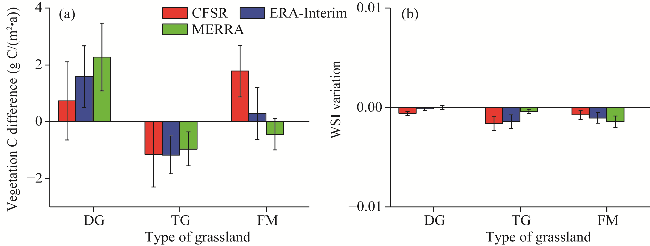
Fig. 6 Vegetation C difference (a) and WSI variation (b) of different types of grassland in Central Asia during the period 1979-2014 under N deposition simulated by CSRS, ERA-Interim, and MERRA. Bars are standard errors.

3.4 Climate change effects on C dynamics and WSI

We compared the effects of changing climate (without N deposition effect) on modeled C dynamics and WSI (Fig. 7) during the period 1979-2014. All results simulated by three reanalysis data showed a significant increasing trend in vegetation C, ranging from 2.10 (±0.41) g C/(m2•a) for CFSR to 5.04 (±0.36) g C/(m2•a) for ERA (Fig. 7a). Thus, our simulations suggested that climate change was the major driver for increased terrestrial productivity compared with N deposition. Meanwhile, no significant trend in WSI for the same period was detected.
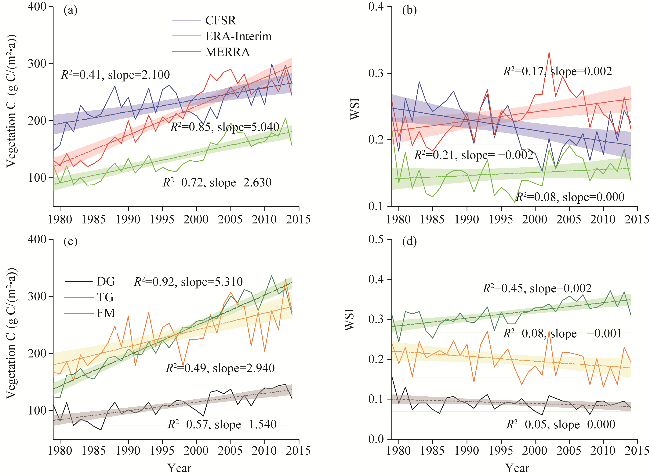
Fig. 7 Effects of climate on vegetation C (a and c) and WSI (b and d) of grasslands in Central Asia during the period 1979-2014 simulated by CSRS, ERA-Interim, and MERRA. Shaded area represents the 95% confidence interval and dashed line represents the fitting line.
Three types of grassland in this study showed the same trends but different extent in C and water dynamics over the last three decades. All the types of grassland showed an increasing trend of vegetation C (Fig. 7c), however, FM showed more significant increasing value of 5.31 (±0.25) g C/(m2•a) (R2=0.92), while the increasing values were 2.94 (±0.49) g C/(m2•a) (R2=0.49) and 1.54 (±0.02) g C/(m2•a) (R2=0.57) for TG and DG, respectively. No significant trend in WSI for the same period was detected.

4 Discussion

4.1 N effect on C dynamics

Atmospheric N deposition can significantly influence the C and N cycles of terrestrial ecosystems, thereby impacting their structure and functioning. In recent years, numerous experimental studies have been conducted globally to simulate N deposition effects in various ecosystems (Stevens et al., 2011; Kinugasa et al., 2012; Zhang et al., 2023). Previous research has highlighted the crucial role of N as a limiting factor for grassland growth (Li et al., 2015b; Stevens et al., 2015). However, it is worth noting that in arid and semi-arid areas where vegetation growth is primarily constrained by precipitation, the contribution of N has often been overlooked. Lu et al. (2016) illustrated in their research that increased N deposition raised NPP by 9.60 g C/(m2•a) on average, accounting for around 92.20 Tg C/a of the national total. In Europe, the average NPP under N deposition was 5.00-75.00 g C/g N (de Vries et al., 2009). In China, the average NPP under N deposition in grasslands was 25.00 g C/g N in early 21st century (Lu et al., 2012). Our study indicated that N deposition led to an increase of 65.56 (±83.03) Tg C in the grasslands in Central Asia. The substantial increase in vegetation C can be attributed to enhanced photosynthesis resulting from the rise in plant N with N addition (Kinugasa et al., 2012). Zhu et al. (2021) also observed that N input in arid and semi-arid grasslands could stimulate root growth for improved nutrient and water uptake. Considering the prevalence of widespread N limitation in Central Asian grasslands as indicated by experimental and monitoring studies, our modeled C sequestration under N deposition further supported the hypothesis of N limitation in this area, although with moderate magnitude diminishing over time.
In terms of N deposition-induced C sequestration, our simulations and other field investigations (Wang et al., 2021) suggest that grasslands serve as a stronger C sink. While there are limited indications of N saturation in our simulations, determining the threshold for N saturation is crucial across different types of grassland ecosystems.

4.2 C water dynamics in different types of grassland

The results showed different trends in C and water dynamics under N deposition over the past 36 a. Different climate zones and soil characteristics associated with each type of grassland affect their trends. Our study indicated that different types of grassland responded variably to N deposition. In detail, N deposition had positive effects on DG productivity, which was consistent with the findings of Li (2021). DG was modeled to exhibit a higher degree of N limitation on vegetation C compared with other types of grassland, which is consistent with empirical observations and modeling results. Kinugasa et al. (2012) imply that increased N deposition can enhance grassland recovery after a drought even in arid areas like the Mongolian Steppe. This greater productivity might be attributed to plants enhancing photorespiration under drought conditions, which stimulates malate production in chloroplasts and generates reductants for nitrate assimilation, making them particularly adept at utilizing soil nitrate as a source of N (Eisenhut et al., 2019).
Notably, effects of N dynamics were negative in TG, whether it was compensated for by other process settings in the model, or reached N saturation was uncertain. The negative effects of N deposition on species richness in temperate grasslands in China have been widely observed (Fang et al., 2012), as well as decreased belowground biomass with N addition. One probably explanation is that N addition increased plant growth, which will increase the rate of water loss from plants and result in the drier condition, causing drought in the long term.

4.3 WSI under N deposition

Water and N are two primary limiting factors across many ecosystems (Kamran et al., 2022). It has been suggested that applying N should only be done in areas with sufficient plant-available water since its uptake depends on soil and plant water status (Tilling et al., 2007). In numerous studies, researchers have demonstrated that adequate N nutrition can enhance plant drought resistance and effectively improve water relations when growing under dry soil conditions (Dang et al., 2006; Adamtey et al., 2010). Lin et al. (2012) found no significant effect of N fertilization on crop WSI under different soil drought treatments, which aligns with our findings. In the field of agriculture and forestry, WSI is extensively utilized for irrigation scheduling and N fertilization (Emekli et al., 2007), yet, our finding suggested that the calculation of N and water should be different, depending on different ecosystems.

4.4 Uncertainty

In this study, we used three sets of climate data to partially correct the uncertainty of parameters, however, due to the time constraints on the data, our analysis is limited to the situation prior to 2015. Simulations driven by different climate datasets yielded different NPP results, when compared with field observation, and simulation ability of different meteorological datasets varied in different areas (Smakgahn et al., 2009; Gaillard et al., 2018). The model structure represents another significant source of uncertainty. We have not considered grasslands reclaimed for farmlands and other land use and land cover (LULC) changes, which have been estimated to result in substantial C emissions (Chang et al., 2022; Feng et al., 2023). Especially in TG, the anthropogenic influence was more obvious. Interactions among N cycle, deposition, and anthropogenic effects have primarily shown a net loss of C from ecosystems, potentially offsetting the effects of N deposition alone. In addition, LULC changes can modify the properties of N deposition by altering the ground surface features and reactive N emission (Lu et al., 2016). In addition, this model also lacks other essential elements like phosphorus.

5 Conclusions

This study analyzed the effects of N deposition on C and water dynamics in the grasslands of Central Asia. Results showed that total vegetation C in Central Asia was 0.35 (±0.09) Pg C/a for the whole area. Increasing N deposition led to an increase in the vegetation C of 65.56 (±83.03) Tg C and slightly decreased WSI in Central Asia. Our finding has significant implications for how N deposition affects the C balance in arid and semi-arid areas. Moreover, there were differences in water and nutrient conditions of different types of grassland, which resulted in inconsistent responses of productivity to N deposition. N deposition had positive effects on desert grasslands, while had negative effects on temperate grasslands. In addition, the interactions of nutrient and C cycles and the extent to which N is limited are key to understanding water use efficiency and making reliable predictions under future climate change. Models should further be rigorously tested with relevant parameters, particularly in the integration of fluxes and pools of C and N, as well as phosphorus.

Conflict of interest

The authors declare that they have no known competing financial interests or personal relationships that could have appeared to influence the work reported in this paper.

Acknowledgements

This work was funded by the National Key Research and Development Program of China (2023YFC3206803), and the National Natural Science Foundation of China (42271493).

Author contributions

Conceptualization: HAN Qifei, LI Chaofan; Methodology: HAN Qifei; Formal analysis: HAN Qifei, XU Wei; Writing - original draft preparation: HAN Qifei, XU Wei; Writing - review and editing: HAN Qifei; Funding acquisition: HAN Qifei, LI Chaofan. All authors approved the manuscript.
[1]
Adamtey N, Cofie O, Ofosu-Budu K G, et al. 2010. Effect of N-enriched co-compost on transpiration efficiency and water-use efficiency of maize (Zea mays L.) under controlled irrigation. Agricultural Water Management, 97(7): 995-1005.

[2]
Anwar M, Yang Y H, Guo Z D, et al. 2006. Carbon contents and its vertical distribution in alpine grasslands in Bayinbulak, middle stretch of the Tianshan Mountains of Xinjiang. Journal of Plant Ecology, 30(4): 545-552. (in Chinese)

[3]
Chang X Q, Xing Y Q, Wang J Q, et al. 2022. Effects of land use and cover change (LUCC) on terrestrial carbon stocks in China between 2000 and 2018. Resource, Conservation and Recycling, 182: 106333, doi: 10.1016/j.resconrec.2022.106333.

[4]
Dang T H, Cai G X, Guo S L, et al. 2006. Effect of nitrogen management on yield and water use efficiency of rainfed wheat and maize in Northwest China. Pedosphere, 16(4): 495-504.

[5]
de Vries W, Solberg S, Dobbertin M, et al. 2009. The impact of nitrogen deposition on carbon sequestration by European forests and heathlands. Forest Ecology and Management, 258(8): 1814-1823.

[6]
Decina S M, Hutyra L R, Templer P H. 2020. Hotspots of nitrogen deposition in the world's urban areas: A global data synthesis. Frontiers in Ecology and the Environment, 18(2): 92-100.

[7]
Dee D P, Uppala S M, Simmons A J, et al. 2011. The ERA-Interim reanalysis: Configuration and performance of the data assimilation system. Quarterly Journal of the Royal Meteorological Society, 137(656): 553-597.

[8]
Eisenhut M, Roell M, Weber A P M. 2019. Mechanistic understanding of photorespiration paves the way to a new green revolution. New Phytologist, 223(4): 1762-1769.

[9]
Emekli Y, Bastug R, Buyuktas D, et al. 2007. Evaluation of a crop water stress index for irrigation scheduling of Bermuda grass. Agricultural Water Management, 90(3): 205-212.

[10]
Fan Y M, Sun Z J, WU H Q, et al. 2009. Influences of fencing on vegetation and soil properties in mountain steppe. Pratacultural Science, 3(3): 79-82. (in Chinese)

[11]
Fang Y, Xun F, Bai W, et al. 2012. Long-term nitrogen addition leads to loss of species richness due to litter accumulation and soil acidification in a temperate steppe. PLoS ONE, 7(10): e47369, doi: 10.1371/journal.pone.0047369.

[12]
FAO/IIASA/ISRIC/ISS-CAS/JRC. 2009. Harmonized World Soil Database (version 1.1), FAO, Rome, Italy. [2023-09-05]. https://gaez.fao.org/pages/hwsd.

[13]
Feng H H, Wang S, Zou B, et al. 2023. Contribution of land use and cover change (LUCC) to the global terrestrial carbon uptake. Science of the Total Environment, 901: 165932, doi: 10.1016/j.scitotenv.2023.165932.

[14]
Friedrich U, von Oheimb G, Kriebitzsch W U, et al. 2012. Nitrogen deposition increases susceptibility to drought-experimental evidence with the perennial grass Molinia caerulea (L.) Moench. Plant and Soil, 353(1-2): 59-71.

[15]
Gaillard R K, Jones C D, Ingraham P, et al. 2018. Underestimation of N2O emissions in a comparison of the DayCent, DNDC, and EPIC models. Ecological Applications, 28(3): 694-708.

[16]
Gardner B R, Nielsen D C, Shock B C. 1992. Infrared thermometry and the crop water stress index. I. History, theory, and baselines. Journal of Production Agriculture, 5(4): 462-466.

[17]
Guest G, Kröbel R, Grant B, et al. 2017. Model comparison of soil processes in eastern Canada using DayCent, DNDC and STICS. Nutrient Cycling in Agroecosystems, 109(3): 211-232.

[18]
Han Q F, Luo G P, Li C F, et al. 2014. Modeling the grazing effect on dry grassland carbon cycling with Biome-BGC model. Ecological Complexity, 17: 149-157.

[19]
Hu Z Y, Zhang C, Hu Q, et al. 2014. Temperature changes in Central Asia from 1979 to 2011 based on multiple datasets. Journal of Climate, 27(3): 1143-1167.

[20]
Jarsjö J, Törnqvist R, Su Y. 2017. Climate-driven change of nitrogen retention-attenuation near irrigated fields: Multi-model projections for Central Asia. Environmental Earth Sciences, 76: 117, doi: 10.1007/s12665-017-6418-y.

[21]
Kamran M, Yan Z G, Jia Q M, et al. 2022. Irrigation and nitrogen fertilization influence on alfalfa yield, nutritive value, and resource use efficiency in an arid environment. Field Crops Research, 284: 108587, doi: 10.1016/j.fcr.2022.108587.

[22]
Karlsson P E, Akselsson C, Hellsten S, et al. 2022. Twenty years of nitrogen deposition to Norway spruce forests in Sweden. Science of the Total Environment, 809: 152192, doi: 10.1016/j.scitotenv.2021.152192.

[23]
Katayanagi N, Ono K, Fumoto T, et al. 2013. Validation of the DNDC-Rice model to discover problems in evaluating the nitrogen balance at a paddy-field scale for single-cropping of rice. Nutrient Cycling in Agroecosystems, 95(2): 255-268.

[24]
Kim Y, Garcia M, Johnson M S. 2023. Land-atmosphere coupling constrains increases to potential evaporation in a warming climate: Implications at local and global scales. Earth's Future, 11(2): e2022EF002886, doi: 10.1029/2022EF002886.

[25]
Kinugasa T, Tsunekawa A, Shinoda M. 2012. Increasing nitrogen deposition enhances post-drought recovery of grassland productivity in the Mongolian Steppe. Oecologia, 170(3): 857-865.

[26]
Lamarque J F, Kiehl J T, Brasseur G P, et al. 2005. Assessing future nitrogen deposition and carbon cycle feedback using a multimodel approach: Analysis of nitrogen deposition. Journal of Geophysical Research-atmospheres, 110: D19303, doi: 10.1029/2005JD005825.

[27]
Li C F, Zhang C, Luo G P, et al. 2015a. Carbon stock and its responses to climate change in Central Asia. Global Change Biology, 21(5): 1951-1967.

[28]
Li C S, Frolking S, Frolking T A. 1992. A model of nitrous oxide evolution from soil driven by rainfall event: Ⅰ. Model structure and sensitivity. Journal of Geophysical Research-atmospheres, 97(D9): 9759-9776.

[29]
Li C S, Salas W, Zhang R H, et al. 2012. Manure-DNDC: A biogeochemical process model for quantifying greenhouse gas and ammonia emissions from livestock manure systems. Nutrient Cycling in Agroecosystems, 93(2): 163-200.

[30]
Li K H, Liu X J, Song W, et al. 2013. Atmospheric nitrogen deposition at two sites in an arid environment of Central Asia. PLoS ONE, 8(6): 0067018, doi: 10.1371/journal.pone.0067018.

[31]
Li K H, Liu X J, Song L, et al. 2015b. Response of alpine grassland to elevated nitrogen deposition and water supply in China. Oecologia, 177(1): 65-72.

[32]
Li K H, Liu X J, Geng F Z, et al. 2021. Inorganic nitrogen deposition in arid land ecosystems of Central Asia. Environmental Science and Pollution Research, 28(24): 31861-31871.

[33]
Li M, Zhang Q, Kurokawa J, et al. 2017. MIX: A mosaic Asian anthropogenic emission inventory under the international collaboration framework of the MICS-Asia and HTAP. Atmospheric Chemistry and Physics, 17(2): 935-963.

[34]
Lin L R, Chen J Z, Cai C F. 2012. High rate of nitrogen fertilization increases the crop water stress index of corn under soil drought. Communications in Soil Science and Plant Analysis, 43(22): 2865-2877.

[35]
Liu B Y, Lei C Y, Jin H J, et al. 2016. Physiological responses of two moss species to the combined stress of water deficit and elevated N deposition (II): Carbon and nitrogen metabolism. Ecology and Evolution, 6(21): 7596-7609.

[36]
Liu M X, Shang F, Lu X J, et al. 2022. Unexpected response of nitrogen deposition to nitrogen oxide controls and implications for land carbon sink. Nature Communications, 13: 3126, doi: 10.1038/s41467-022-30854-y.

[37]
Lu X H, Jiang H, Liu J, et al. 2012. Spatial and temporal variability of nitrogen deposition and its impacts on the carbon budget of China. Procedia Environmental Sciences, 13: 1997-2030.

[38]
Lu X H, Jiang H, Zhang X Y, et al. 2016. Relationship between nitrogen deposition and LUCC and its impact on terrestrial ecosystem carbon budgets in China. Science China-Earth Sciences, 59(12): 2285-2294.

[39]
Mateus N S, Ferreira E V O, Florentino A L, et al. 2022. Potassium supply modulates Eucalyptus leaf water-status under PEG-induced osmotic stress: Integrating leaf gas exchange, carbon and nitrogen isotopic composition and plant growth. Tree Physiology, 42(1): 59-70.

[40]
McDonough A M, Watmough S A. 2023. Interactive effects of precipitation and above canopy nitrogen deposition on understory vascular plants in a jack pine (Pinus banksiana) forest in northern Alberta, Canada. Science of the Total Environment, 855: 158708, doi: 10.1016/j.scitotenv.2022.158708.

[41]
Mitchell T D, Jones P D. 2005. An improved method of constructing a database of monthly climate observations and associated high-resolution grids. International Journal of Climatology, 25(6): 693-712.

[42]
Rienecker M M, Suarez M J, Gelaro R, et al. 2011. MERRA: NASA's modern-era retrospective analysis for research and applications. Journal of Climate, 24(14): 3624-3648.

[43]
Saha S, Moorthi S, Wu X R, et al. 2014. The NCEP climate forecast system version 2.0. Journal of Climate, 27(6): 2185-2208.

[44]
Serafini J, Grogan P, Aarssen L. 2019. Summer precipitation limits plant species richness but not overall productivity in a temperate mesic old-field meadow. Journal of Vegetation Science, 30(5): 832-844.

[45]
Smakgahn K, Fumoto T, Yagi K. 2009. Validation of revised DNDC model for methane emissions from irrigated rice fields in Thailand and sensitivity analysis of key factors. Journal of Geophysical Research-Biogeosciences, 114(G2): G02017, doi: 10.1029/2008JG000775.

[46]
Stevens C J, Gowing D J G, Wotherspoon K A, et al. 2011. Addressing the impact of atmospheric nitrogen deposition on western European grasslands. Environmental Management, 48(5): 885-894.

[47]
Stevens C J, Lind E M, Hautier Y, et al. 2015. Anthropogenic nitrogen deposition predicts local grassland primary production worldwide. Ecology, 96(6): 1459-1465.

[48]
Ta Z J, Yu Y, Sun L X, et al. 2018. Assessment of precipitation simulations in Central Asia by CMIP 5 climate models. Water, 10(11): 1516, doi: doi.org/10.3390/w10111516.

[49]
Templer P H, Pinder R W, Goodale C L. 2012. Effects of nitrogen deposition on greenhouse-gas fluxes for forests and grasslands of North America. Frontiers in Ecology and the Environment, 10(10): 547-553.

[50]
Tilling A K, O'Leary G J, Ferwerda J G, et al. 2007. Remote sensing of nitrogen and water stress in wheat. Field Crops Research, 104(1-3): 77-85.

[51]
Toderich K N, Shuyskaya E V, Ismail S, et al. 2009. Phytogenic resources of halophytes of Central Asia and their role for rehabilitation of sandy desert degraded rangelands. Land Degradation & Development, 20(4): 386-396.

[52]
van der Graaf S C, Janssen T A J, Erisman J W, et al. 2021. Nitrogen deposition shows no consistent negative nor positive effect on the response of forest productivity to drought across European FLUXNET forest sites. Environmental Research Communications, 3(12): 125003, doi: 10.1088/2515-7620/ac2b7d.

[53]
Walker J T, Chen X, Wu Z Y, et al. 2023. Atmospheric deposition of reactive nitrogen to a deciduous forest in the southern Appalachian Mountains. Biogeosciences, 20(5): 971-995.

[54]
Wang X, Wang M, Tao Y M, et al. 2021. Beneficial effects of nitrogen deposition on carbon and nitrogen accumulation in grasses over other species in Inner Mongolian grasslands. Global Ecology and Conservation, 26: e01507, doi: 10.1016/j.gecco.2021.e01507.

[55]
Wu X, Kang X M, Liu W J, et al. 2018. Using the DNDC model to simulate the potential of carbon budget in the meadow and desert steppes in Inner Mongolia, China. Journal of Soils and Sediments, 18(1): 63-75.

[56]
Yan X H. 2009. Study on change of grassland community of the Stipa capillata+herbage and lambs eating and growing in warm season. MSc Thesis. Xinjiang: Xinjiang Agricultural University. (in Chinese)

[57]
Yang Y H, Fang J Y, Ma W H, et al. 2010. Large-scale pattern of biomass partitioning across China's grasslands. Global Ecology and Biogeography, 19: 268-277.

[58]
Zang Y X, Xu W X, Wu K, et al. 2022. Effect of nitrogen application on the sensitivity of desert shrub community productivity to precipitation in Central Asia. Frontiers in Plant Science, 13: 916706, doi: 10.3389/fpls.2022.916706.

[59]
Zhang R H, An S Z, Yang H K, et al. 2008. Effect of different grazing intensities on spring community of Stipa capillata grassland in Xinjiang. Xinjiang Agricultural Sciences, 45(3): 570-574. (in Chinese)

[60]
Zhang S K, Wang J X, Liu F Y, et al. 2023. Simulated nitrogen deposition promotes the carbon assimilation of shrubs rather than tree species in an evergreen broad-leaved forest. Environmental Research, 216: 114497, doi: 10.1016/j.envres.2022.114497.

[61]
Zhang X H, An S Z, Wang Y, et al. 2012. The effect on main quantitative characters of mowing and grazing alternating use on the grassland vegetation. Xinjiang Agricultural Sciences, 49(3): 549-554. (in Chinese)

[62]
Zhao Z Y, Wang R H, Zhang H Z, et al. 2006. Aboveground biomass of Tamarix on piedmont plain of Tianshan Mountains south slope. Chinese Journal of Applied Ecology, 17(9): 1557-1562. (in Chinese)

[63]
Zhao Z Y, Wang R H, Yin C H, et al. 2007. Influence of spatial heterogeneity of soil salinity on plant community structure and composition of plain at south piedmont of Tianshan Mountains. Arid Land Geography, 30(6): 839-845. (in Chinese)

[64]
Zhou X B, Zhang Y M, Ji X H, et al. 2011. Combined effects of nitrogen deposition and water stress on growth and physiological responses of two annual desert plants in northwestern China. Environmental and Experimental Botany, 74: 1-8.

[65]
Zhu J X, Wang Q F, He N P, et al. 2021. Effect of atmospheric nitrogen deposition and its components on carbon flux in terrestrial ecosystems in China. Environmental Research, 202: 111787, doi: 10.1016/j.envres.2021.111787.

[66]
Zhu S H, Chen X, Zhang C, et al. 2022. Carbon variation of dry grasslands in Central Asia in response to climate controls and grazing appropriation. Environmental Science and Pollution Research, 29(21): 32205-32219.

文章导航

/