
Response of vegetation variation to climate change and human activities in the Shiyang River Basin of China during 2001-2022
Received date: 2024-01-09
Revised date: 2024-05-25
Accepted date: 2024-05-30
Online published: 2025-08-13
SUN Chao , BAI Xuelian , WANG Xinping , ZHAO Wenzhi , WEI Lemin . [J]. Journal of Arid Land, 2024 , 16(8) : 1044 -1061 . DOI: 10.1007/s40333-024-0059-2
Understanding the response of vegetation variation to climate change and human activities is critical for addressing future conflicts between humans and the environment, and maintaining ecosystem stability. Here, we aimed to identify the determining factors of vegetation variation and explore the sensitivity of vegetation to temperature (SVT) and the sensitivity of vegetation to precipitation (SVP) in the Shiyang River Basin (SYRB) of China during 2001-2022. The climate data from climatic research unit (CRU), vegetation index data from Moderate Resolution Imaging Spectroradiometer (MODIS), and land use data from Landsat images were used to analyze the spatial-temporal changes in vegetation indices, climate, and land use in the SYRB and its sub-basins (i.e., upstream, midstream, and downstream basins) during 2001-2022. Linear regression analysis and correlation analysis were used to explore the SVT and SVP, revealing the driving factors of vegetation variation. Significant increasing trends (P<0.05) were detected for the enhanced vegetation index (EVI) and normalized difference vegetation index (NDVI) in the SYRB during 2001-2022, with most regions (84%) experiencing significant variation in vegetation, and land use change was determined as the dominant factor of vegetation variation. Non-significant decreasing trends were detected in the SVT and SVP of the SYRB during 2001-2022. There were spatial differences in vegetation variation, SVT, and SVP. Although NDVI and EVI exhibited increasing trends in the upstream, midstream, and downstream basins, the change slope in the downstream basin was lower than those in the upstream and midstream basins, the SVT in the upstream basin was higher than those in the midstream and downstream basins, and the SVP in the downstream basin was lower than those in the upstream and midstream basins. Temperature and precipitation changes controlled vegetation variation in the upstream and midstream basins while human activities (land use change) dominated vegetation variation in the downstream basin. We concluded that there is a spatial heterogeneity in the response of vegetation variation to climate change and human activities across different sub-basins of the SYRB. These findings can enhance our understanding of the relationship among vegetation variation, climate change, and human activities, and provide a reference for addressing future conflicts between humans and the environment in the arid inland river basins.
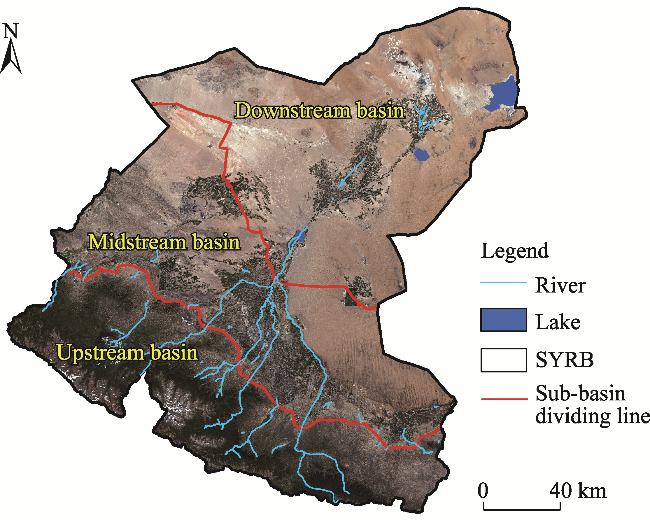
Fig. 1 Overview of the Shiyang River Basin (SYRB) and its three sub-basins. Note that the image was the true color composite (band 4/3/2) of Sentinel-2 data in 2023 downloaded from the European Space Agency (https://scihub.copernicus.eu/dhus/#/home). |
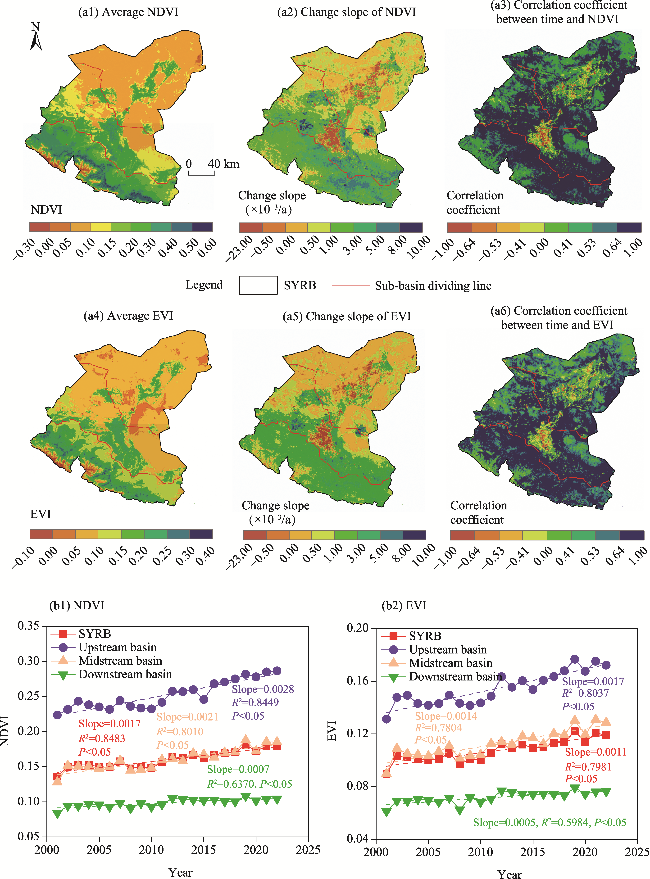
Fig. 2 Spatial (a1-a6) and temporal (b1 and b2) distribution of normalized difference vegetation index (NDVI) and enhanced vegetation index (EVI) in the SYRB and its sub-basins during 2001-2022. (a1), spatial distribution of average NDVI; (a2), spatial distribution of the change slope of NDVI; (a3), spatial distribution of the correlation coefficient between time and NDVI; (a4), spatial distribution of average EVI; (a5), spatial distribution of the change slope of EVI; (a6), spatial distribution of the correlation coefficient between time and EVI; (b1), temporal distribution of NDVI; (b2), temporal distribution of EVI. |
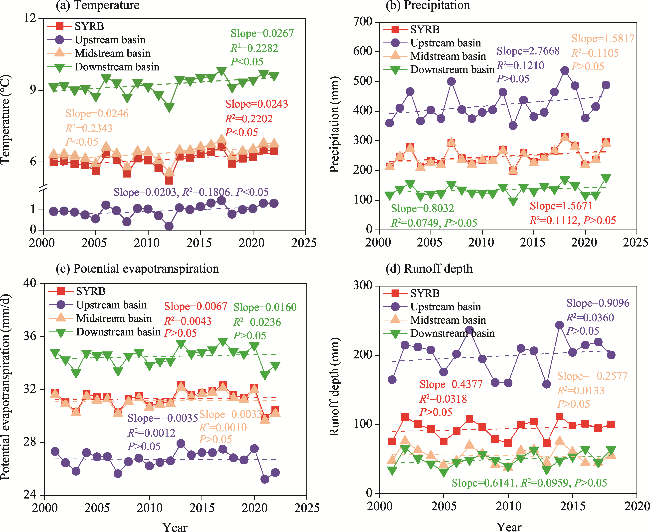
Fig. 3 Temporal changes of climatic and hydrological factors in the SYRB and its sub-basins during 2001-2022. (a), temperature; (b), precipitation; (c), potential evapotranspiration; (d), runoff depth. |
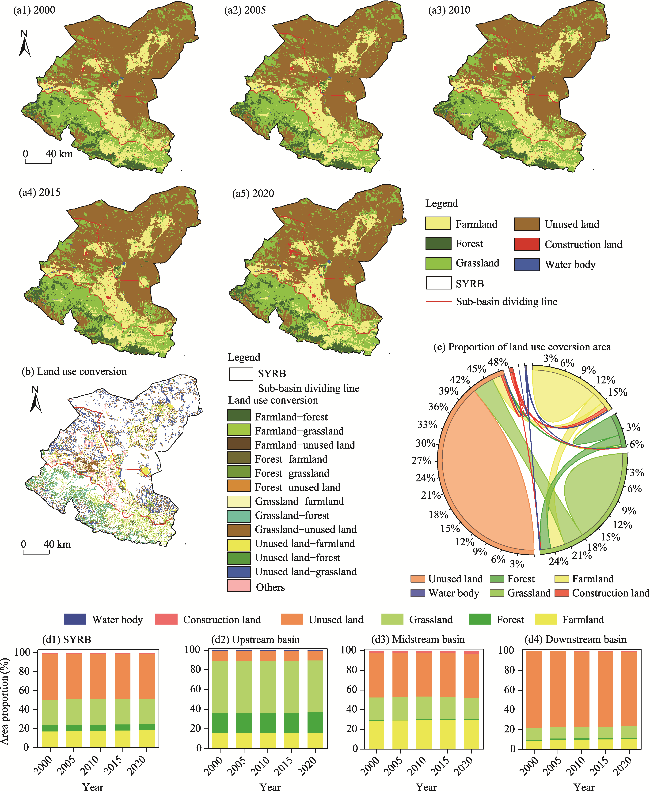
Fig. 4 Spatial-temporal distribution of land use types in 2000 (a1), 2005 (a2), 2010 (a3), 2015 (a4), and 2020 (a5), spatial distribution of major land use conversions during 2001-2022 (b), chord diagram of the proportion of land use conversion area during 2001-2022 (c), and area proportions of different land use types during 2001-2022 (d1-d4) in the SYRB and its sub-basins |
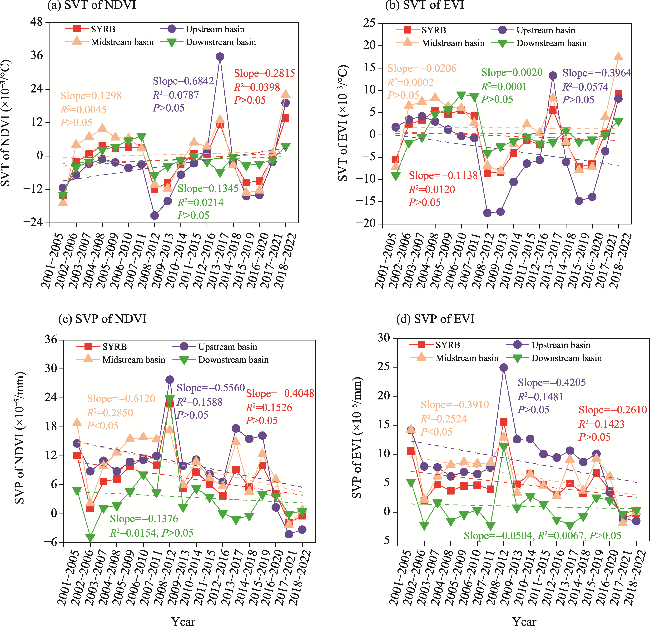
Fig. 5 Temporal changes in the sensitivity of vegetation to temperature (SVT) and sensitivity of vegetation to precipitation (SVP) in the SYRB and its sub-basins in a 5-a moving window during 2001-2022. (a), SVT of NDVI; (b), SVT of EVI; (c), SVP of NDVI; (d), SVP of EVI. |
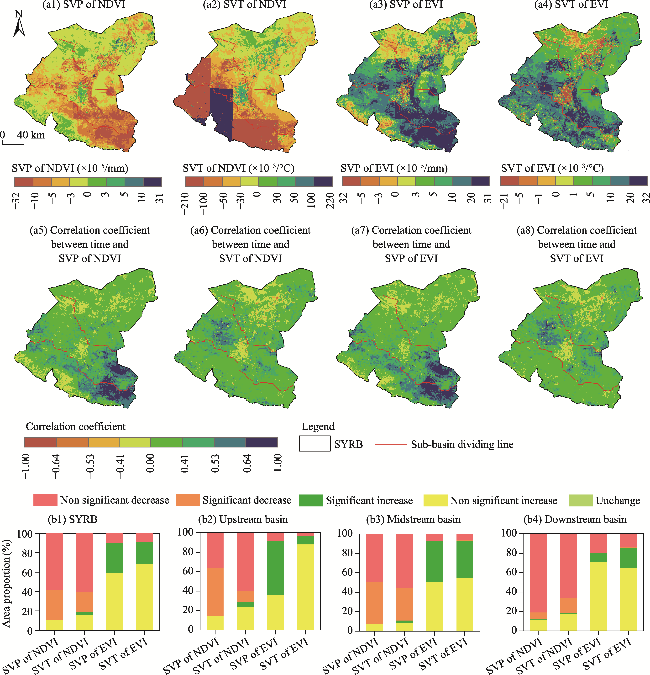
Fig. 6 Spatial distribution of the SVP and SVT of NDVI and EVI (a1-a4) and their correlations with time (a5-a8), and area proportions of regions with different changes of the SVP and SVT of NDVI and EVI (b1-b4) in the SYRB and its sub-basins during 2001-2022 |
Fig. 7 Person's correlation coefficients among vegetation indices, climate change, runoff depth change, and land use change in the SYRB and its sub-basins. (a), SYRB; (b), upstream basin; (c), midstream basin; (d), downstream basin. The direction of ellipse represents the positive or negative correlation coefficient, with negative value to the left direction and positive value to the right direction. The size of ellipse represents the magnitude of the correlation coefficient, with a larger ellipse indicating a smaller correlation coefficient. * represents a significant correlation at the 0.05 level. |
| [1] |
|
| [2] |
|
| [3] |
|
| [4] |
|
| [5] |
|
| [6] |
|
| [7] |
|
| [8] |
|
| [9] |
|
| [10] |
|
| [11] |
|
| [12] |
|
| [13] |
|
| [14] |
|
| [15] |
|
| [16] |
|
| [17] |
|
| [18] |
|
| [19] |
|
| [20] |
|
| [21] |
|
| [22] |
|
| [23] |
|
| [24] |
|
| [25] |
|
| [26] |
|
| [27] |
|
| [28] |
|
| [29] |
|
| [30] |
|
| [31] |
|
| [32] |
|
| [33] |
|
| [34] |
|
| [35] |
|
| [36] |
|
| [37] |
|
| [38] |
|
| [39] |
|
| [40] |
|
| [41] |
|
| [42] |
|
| [43] |
|
| [44] |
|
| [45] |
|
| [46] |
|
| [47] |
|
| [48] |
|
| [49] |
|
| [50] |
|
| [51] |
|
| [52] |
|
| [53] |
|
| [54] |
|
| [55] |
|
| [56] |
|
| [57] |
|
| [58] |
|
| [59] |
|
| [60] |
|
| [61] |
|
| [62] |
|
| [63] |
|
| [64] |
|
| [65] |
|
| [66] |
|
| [67] |
|
| [68] |
|
| [69] |
|
| [70] |
|
| [71] |
|
| [72] |
|
| [73] |
|
/
| 〈 |
|
〉 |
