• LI Mingqian 1, 2 ,
  • WANG He , 1, * ,
  • DU Wei 3 ,
  • GU Hongbiao 4 ,
  • ZHOU Fanchao 5 ,
  • CHI Baoming 1
展开

收稿日期: 2024-04-20

  修回日期: 2024-06-11

  录用日期: 2024-06-28

  网络出版日期: 2025-08-13

Responses of runoff to changes in climate and human activities in the Liuhe River Basin, China

  • LI Mingqian 1, 2 ,
  • WANG He , 1, * ,
  • DU Wei 3 ,
  • GU Hongbiao 4 ,
  • ZHOU Fanchao 5 ,
  • CHI Baoming 1
Expand
  • 1School of Ecology and Environment, Institute of Disaster Prevention, Langfang 065201, China
  • 2Hebei Key Laboratory of Resource and Environmental Disaster Mechanism and Risk Monitoring, Sanhe 065201, China
  • 3Suzhou Qianxing Environmental Engineering Co., Ltd., Suzhou 215000, China
  • 4College of Transportation Engineering, Nanjing Tech University, Nanjing 210000, China
  • 5Tianjin North China Geological Exploration General Institute, Tianjin 300000, China
*WANG He (E-mail: )

Received date: 2024-04-20

  Revised date: 2024-06-11

  Accepted date: 2024-06-28

  Online published: 2025-08-13

本文引用格式

LI Mingqian , WANG He , DU Wei , GU Hongbiao , ZHOU Fanchao , CHI Baoming . [J]. Journal of Arid Land, 2024 , 16(8) : 1023 -1043 . DOI: 10.1007/s40333-024-0023-1

Abstract

Since the 1950s, numerous soil and water conservation measures have been implemented to control severe soil erosion in the Liuhe River Basin (LRB), China. While these measures have protected the upstream soil and water ecological environment, they have led to a sharp reduction in the downstream flow and the deterioration of the river ecological environment. Therefore, it is important to evaluate the impact of soil and water conservation measures on hydrological processes to assess long-term runoff changes. Using the Soil and Water Assessment Tool (SWAT) models and sensitivity analyses based on the Budyko hypothesis, this study quantitatively evaluated the effects of climate change, direct water withdrawal, and soil and water conservation measures on runoff in the LRB during different periods, including different responses to runoff discharge, hydrological regime, and flood processes. The runoff series were divided into a baseline period (1956-1969) and two altered periods, i.e., period 1 (1970-1999) and period 2 (2000-2020). Human activities were the main cause of the decrease in runoff during the altered periods, contributing 86.03% (-29.61 mm), while the contribution of climate change was only 13.70% (-4.70 mm). The impact of climate change manifests as a decrease in flood volume caused by a reduction in precipitation during the flood season. Analysis of two flood cases indicated a 66.00%-84.00% reduction in basin runoff capacity due to soil and water conservation measures in the upstream area. Soil and water conservation measures reduced the peak flow and total flood volume in the upstream runoff area by 77.98% and 55.16%, respectively, even with nearly double the precipitation. The runoff coefficient in the reservoir area without soil and water conservation measures was 4.0 times that in the conservation area. These results contribute to the re-evaluation of soil and water conservation hydrological effects and provide important guidance for water resource planning and water conservation policy formulation in the LRB.

1 Introduction

Climate change and human activity are the main driving forces behind the hydrological cycle and spatiotemporal changes in water resource distribution, and it is crucial to quantitatively separate their impacts on regional water resource security (Chang et al., 2016; Dey and Mishra, 2017; Liu et al., 2017; Jiang et al., 2021). Climate change, characterized by global warming, is considered one of the main driving factors behind the decrease in global water resource availability and spatial distribution changes. In addition, intense human activities such as water engineering, urbanization processes, and agricultural activities directly or indirectly alter the path, flux, and distribution of water resources (Jiang et al., 2011; Luo et al., 2020; Yin et al., 2023). Quantitative assessment of the impacts of climate change and human activities on runoff is an important foundation for watershed governance, regional water resource assessment, and water security (Shi et al., 2023).
There are currently various methods to separate the impacts of climate change and human activities on runoff. These methods can be categorized as experimental methods, hydrological models, conceptual methods, and analytical methods (Li et al., 2023). Experimental methods include time trend and paired catchment observations; hydrological models are used to simulate runoff under natural and disturbed conditions; conceptual approaches include decomposition methods based on the Budyko hypothesis and Tomer-Schilling frameworks; analytical methods include climate elasticity and hydrological sensitivity methods. Each method has its advantages, limitations, and scope of application. Wang (2014) and Dey and Mishra (2017) have made a comprehensive assessment of these methods.
Climate change directly affects the water supply sources of runoff; however, the impacts vary significantly across different areas (Masson et al., 2021; Chen et al., 2022). From a climatic zoning perspective, warming temperatures significantly impact runoff in cold areas, causing earlier peak snowmelt runoff and increased flow in winter and spring (Qin et al., 2020; Uzun et al., 2021). In arid to semi-arid areas, runoff exhibits high sensitivity to climate change, increases temperature, and enhances evaporation, further exacerbates regional water scarcity (Liu et al., 2017; Luan et al., 2021). In humid areas, frequent extreme precipitation events in the context of global warming will further increase the risk of flooding, particularly urban flooding (Tabari, 2021; Ghanghas et al., 2023). From a geographical perspective, climate change has mainly led to a decrease in runoff in northern Asia, southern Europe, the Mediterranean, and southern South America. In contrast, surface runoff has shown an increasing trend in northern Australia, central and southern North America, and southern Asia (Song et al., 2013; Masson et al., 2021; Yan et al., 2021).
The continuous expansion and increasing intensity of human activities have become an important factor influencing changes in the watershed water cycle, surpassing climate forcing in certain areas (Yin et al., 2023). The degree of impact on the water cycle can be divided into two main categories: direct and indirect. With the development of flow measurement technology and the establishment of monitoring networks, the direct water extraction process can be quantified. However, the indirect impacts of human activities, such as changes in vegetation cover or land-use changes related to soil conservation measures, make it difficult to directly quantify their effects on runoff. This has been an important and challenging issue in international hydrological research (Gao et al., 2016; Dey and Mishra, 2017; Luan et al., 2021). Soil conservation is one of the most common land-use changes and has historically been a key measure in agricultural production and the fight against water-related disasters (Zhang et al., 2008a).
The hydrological effects of soil and water conservation measures are believed to reduce peak flow and total flood volume and increase infiltration and dry season runoff by altering the coverage of underlying surface through afforestation, grass planting, terracing, and check dams (Lacombe et al., 2008; Hu et al., 2021; Yan et al., 2023). Soil and water conservation measures characterized by forest lands, grasslands, and terraces have significant interception and storage capacities for surface runoff. A few experimental results have shown that, under moderate rainfall conditions, compared with bare lands, forest lands can reduce surface runoff by 60.00% to 80.00%, whereas grasslands can reduce it by 35.00% to 40.00% (Lacombe et al., 2008; Hu et al., 2021). However, due to geographical location and meteorological conditions, the hydrological response to soil and water conservation measures varies in different areas, with higher hydrological sensitivity in arid areas than in humid areas (Liu et al., 2014). However, the increase in vegetation cover in arid areas enhances soil moisture absorption and increases watershed evapotranspiration, thereby reducing watershed yield (Zhang et al., 2008b).
The benefits of soil and water conservation are more focused on protecting land resources. In contrast, the impact of changes in runoff in the downstream areas of soil and water conservation zones receives far less attention. In recent years, due to the sharp decrease in river runoff and the deterioration of river ecological environments, the impact of soil and water conservation on water resources has received increasing attention. Therefore, it is necessary to evaluate the impact of soil and water conservation measures on the runoff process from the perspective of long-term runoff variations (Gao et al., 2016, 2021). The complexity and systematic nature of the hydrological cycle make it challenging to quantify the independent effects of each soil and water conservation measure. Under the backdrop of climate change, what might trigger water environmental issues under large-scale soil and water conservation measures? How might the patterns of runoff be altered? What is the intensity and direction of such alterations? Due to the asynchrony of soil conservation measures and runoff data, as well as insufficient statistics on human direct water extraction, it is difficult to quantitatively separate the hydrological impact of soil and water conservation from climate change and other human activities (Wang, 2014; Dey and Mishra, 2017).
The Liuhe River Basin (LRB) is a typical semi-arid and highly sediment-laden area in northern China. Intensive agricultural development, concentrated heavy rainfall, and the destruction of original vegetation have exacerbated water and soil erosion in the LRB. To mitigate the ecological and environmental problems caused by erosion, Chinese government implemented large-scale soil and water conservation measures, including grass planting, afforestation, terraced field construction, and pasture improvement in the LRB since 1983. These measures have significantly improved the water and soil environment in the upper reaches, protected cultivated land resources, and reduced the sediment load in the lower reaches. However, the potential impact of soil and water conservation measures on river flow has received little attention. The average annual value with no flow in the lower reaches of the LRB was 200 d/a between 1988 and 2020, and the ecological environment of the downstream river channel was severely damaged. In light of recent ecological flow assessment conducted by the Chinese government, it is necessary to understand the impact of extensive soil and water conservation measures on runoff in the LRB. The extensive soil conservation measures, long series of runoff data, and a complete set of water usage statistical data in the LRB provide the opportunity to answer these questions.
In this study, we assessed the specific impacts of climate change, direct water abstraction, and water conservation measures on hydrological processes from the perspective of long-term runoff variation. The objectives of this paper are: (1) to evaluate the historical changes in hydrological and meteorological elements in the LRB; (2) to quantitatively assess the impacts of climate change, direct water extraction, and soil and water conservation measures on runoff; and (3) to explore the effects of soil and water conservation on the runoff discharge and its composition. These findings have important implications for water resource planning and the formulation of soil and water conservation policies in the LRB.

2 Materials and methods

2.1 Study area

The Liuhe River, located in northern China, is the primary tributary of the Liaohe River, with a total area of 5587.57 km2 and an average annual runoff of 2.70×10⁸ m3. The basin slopes from northwest to southeast, with the western part of the Naodehai Reservoir area being mostly low hills and the southern part being a long belt-shaped alluvial plain (41°50′-42°47′N, 121°03′-122°50′E; Fig. 1). The LRB has a typical semi-arid continental climate with an annual precipitation of 478.00 mm, mainly occurring in July and August (approximately 50.00% of the annual precipitation), with heavy rainstorms being the main component. The annual average evaporation and potential evapotranspiration (PET) are 1800.00 and 939.00 mm, respectively, making it one of the areas with the highest evaporation in northern China. Runoff in the LRB is unevenly distributed throughout the year, with the maximum runoff occurring in July and snowmelt contributing to runoff in March and April, often causing spring floods. The Naodehai Reservoir is the only major control reservoir in the basin and was completed in 1942 with a total storage capacity of 2×10⁸ m3. The Liuhe River has an average sediment transport of approximately 20×106 t/a before 1980, approximately 50.00% of which was deposited in the river channel, resulting in an aboveground river downstream.
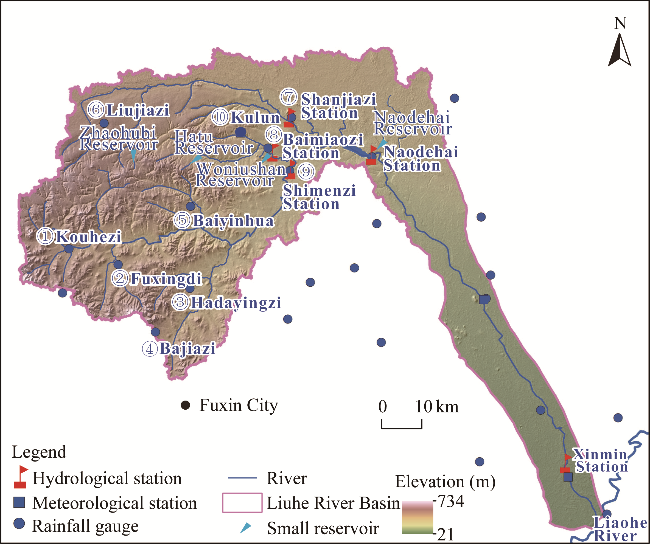
Fig. 1 Hydrological and meteorological stations, rainfall gauges, and reservoirs of the Liuhe River Basin (LRB)

2.2 Data description

Monthly runoff data from 1956 to 2020 at Xinmin Station and flood data from 1963 to 1994 in the LRB were provided by the Nanjing Hydraulic Research Institute (NHRI). Daily precipitation, minimum and maximum temperatures, wind speed, radiation, and relative humidity data from three national meteorological stations from 1956 to 2020 were obtained from the China Meteorological Data Network (http://data.cma.cn/data). The NHRI provided daily precipitation data from 24 rainfall gauges. All hydrometeorological data underwent rigorous quality checks, and no data were missing. The data of soil and water conservation measures in the LRB come from the Liaoning Provincial Department of Water Resources.
The soil data required for the Soil and Water Assessment Tool (SWAT) model were obtained from the World Soil Database (http://www.fao.org). Land use data in 1980 were sourced from the Resource and Environment Science and Data Centre (http://www.resdc.cn/). PET was calculated using the Penman-Monteith method, modified by the Food and Agriculture Organization (FAO), on a daily scale (Allen et al., 1998).

2.3 Trend and breakpoint analysis

2.3.1 Mann-Kendall test

The Mann-Kendall test (Mann, 1945; Kendall, 1975) is widely used to test trends in hydrometeorological time series data. For sequence x (x1, x2,..., xn) to be detected with a length of n, the statistic S is defined as follows:
$S=\sum_{i=1}^{n-1} \sum_{j=i+1}^{n} \operatorname{sgn}\left(x_{j}-x_{i}\right), \operatorname{sgn}\left(x_{j}-x_{i}\right)=\left\{\begin{array}{cc} 1 & x_{j}-x_{i}>0 \\ 0 & x_{j}-x_{i}=0 \\ -1 & x_{j}-x_{i}<0 \end{array},\right.$
where S is the statistic of the Mann-Kendall test; i and j are both the index variables; n is the length of the sequence; and xj and xi are the jth and ith sequence values, respectively.
When n≥10, the statistic S follows an approximate normal distribution with a mean of 0, and the variance var(S) is calculated as follows:
$\operatorname{var}(S)=n(n-1)(2 n+5) / 18$
The Mann-Kendall Z value is given by the following equation:
$Z=\left\{\begin{array}{cc} (S-1) / \sqrt{\operatorname{var}(S)} & S>0 \\ 0 & S=0 \\ (S+1) / \sqrt{\operatorname{var}(S)} & S<0 \end{array}.\right.$
A negative value of Z indicates a decreasing trend, and vice versa. When Z was greater than 1.64, 1.96, and 2.58, it passed the significance test with confidence levels of 90%, 95%, and 99%, respectively.

2.3.2 Breakpoint analysis

Considering the stochastic nature of breakpoint analysis, we employed a combination of the sequential clustering method and the Pettitt test (PT; Pettitt, 1979). The essence of the sequential clustering method (SCM) is to determine the optimal segmentation point τ (that can be one or multiple) for time series and divide the sequences into different segments using τ (Ding, 1986). We determined the segmentation point τ (1≤τn-1) based on the principle of minimizing the sum of squared deviations of the segmented sequences (Sn(τ)) (Chang et al., 2016). The statistical value Sn(τ) corresponding to the τ is defined as follows:
$S_{n}(\tau)=\sum_{i=1}^{\tau}\left(x_{i}-\bar{x}_{\tau}\right)^{2}+\sum_{i=\tau+1}^{n}\left(x_{i}-\bar{x}_{n-\tau}\right)^{2},$
where Sn(τ) is the sum of squared deviations; τ is the optimal segmentation point; and $\bar{x}_{\tau}$ and $\bar{x}_{n-\tau}$ are the averages of the sequences before and after τ, respectively.
PT determines the breakpoint by testing the change in the mean value of time series. In addition to identifying the breakpoint position, PT can provide significant results. The PT is based on the Mann-Whitney statistic Ut,n to test two samples of sequence x (x1, x2, …, xn), i.e., x1, …, xt and xt+1, …, xn. The formula for the statistic Ut,n is as follows:
$U_{t, n}=U_{t-1, n}+\sum_{i=1}^{n} \operatorname{sgn}\left(x_{t}-x_{i}\right), t=2,3, \cdots, n,$
where Ut,n is the Mann-Whitney's statistic; t is the assumed breakpoint; Ut-1,n is the intermediate variable; and xt is the tth sequence value.
The null hypothesis of PT is that the original sequence has no breakpoint. If the test statistic satisfies $K(t)=\max \left|U_{t, n}\right|, \quad(1 \leq t \leq n)$ at time t, time t is considered as a breakpoint. If K(t) and the corresponding significance level α satisfy the following conditions:
$K(t) \geq \sqrt{\frac{-\ln (\alpha / 2) \times\left(n^{2}+n^{3}\right)}{6}},$
where K(t) is the Pettitt's statistic; and α is the significance level. A significant breakpoint occurs at time t under the significance level α.

2.4 Separating the impacts of climate variability and human activities on runoff

2.4.1 Semi-distributed hydrological model

The SWAT is a semi-distributed hydrological model developed by the United States Department of Agriculture, and it is widely used in hydrological simulations, soil erosion, and pollutant transport (Tan et al., 2020; Castellanos et al., 2023). The SWAT utilizes digital elevation models to extract watershed characteristics and divides watersheds into sub-basins based on artificial thresholds. We further divided each sub-basin into hydrological response unit (HRU) based on different combinations of land use, soil, and slope. Precipitation and outlet flow were calculated separately for each HRU and then aggregated at the watershed outlet. The 90 m×90 m resolution SRTM3 DEM (Shuttle Radar Topography Mission Digital Elevation Model) data released by the United States Geological Survey were used to extract the river network, sub-basin, and slope grading; the obtained 90 m resolution slope data were superimposed with 1 km resolution land use raster data and 90 m resolution soil type data, and finally, the result of the HRU division was obtained.
We set the SWAT outlet at Xinmin Station (Fig. 1) to simulate natural runoff from 1956 to 2020 on a monthly timescale. SWAT-CUP2019 calibrated the model parameters with a two-year model warm-up period from 1956 to 1957, a calibration period from 1958 to 1963, and a validation period from 1964 to 1969. Sequential Uncertainty Fitting v. 2.0 (SUFI-2.0) was used for parameter calibration, with the Nash-Sutcliffe efficiency (NSE) as the objective function. Following the evaluation system proposed by Moriasi et al. (2007), the NSE, ratio of the root mean square error to the standard deviation of the measured data (RSR), and percent bias (PBIAS) were used to evaluate the simulated runoff:
$\mathrm{NSE}=1-\frac{\sum_{i=1}^{n}\left(Q_{o, i}-Q_{s, i}\right)^{2}}{\sum_{i=1}^{n}\left(Q_{o, i}-\bar{Q}_{o}\right)^{2}},$
$\operatorname{RSR}=\frac{\sqrt{\sum_{i=1}^{n}\left(Q_{o, i}-Q_{s, i}\right)^{2}}}{\sqrt{\sum_{i=1}^{n}\left(Q_{o, i}-\bar{Q}_{o}\right)^{2}}},$
$\operatorname{PBIAS}=\frac{\left(\sum_{i=1}^{n}\left(Q_{o, i}-Q_{s, i}\right)\right)}{0.01 \times \sum_{i=1}^{n} Q_{o, i}},$
where Qo,i is the ith observed runoff depth (mm); Qs,i is the ith simulated runoff depth (mm); and $\bar{Q}_{o}$ is the average of observed runoff depth (mm).

2.4.2 Hydrological sensitivity based on the Budyko hypothesis

The water balance equation over a catchment scale can be written as follows:
$P=Q+\mathrm{ET}_{\mathrm{a}}+\Delta S,$
where P, Q, ETa, and ΔS are the precipitation (mm), runoff (mm), actual evapotranspiration (mm), and changes in groundwater storage (mm), respectively. For a long period of time, ΔS can be ignored. Budyko (1974) assumed that on larger timescales, actual evapotranspiration is a function of precipitation and PET (mm). Fu (1981) expressed the Budyko hypothesis by considering the catchment properties as follows:
$\frac{\mathrm{ET}_{\mathrm{a}}}{P}=1+\frac{\mathrm{PET}}{P}-\left[1+\left(\frac{\mathrm{PET}}{P}\right)^{w}\right]^{1 / w},$
where w is the watershed characteristics. A high w value indicates that the watershed is favorable for evapotranspiration and vice versa. Parameter w can be obtained by fitting the baseline period hydroclimatic data with the statistical software Origin using a nonlinear fitting method.
Changes in runoff due to climate variability ΔQc can be expressed as follows (Milly and Dunne, 2002):
$\Delta Q_{\mathrm{c}}=\frac{\partial Q}{\partial P} \times \Delta P+\frac{\partial Q}{\partial \mathrm{PET}} \times \Delta \mathrm{PET}=\beta \times \Delta P+\gamma \times \Delta \mathrm{PET},$
where ΔQc is the changes in runoff (mm); $\partial$ is the sign of partial derivative; ΔP and ΔPET are the precipitation and PET changes in altered period relative to baseline period (mm), respectively; and β and γ are the sensitivity of runoff to precipitation and PET, respectively. Combining Equations 10–12, using precipitation and PET data in baseline period, we expressed β and γ as follows:
$\beta=\partial Q / \partial P=P^{w-1}\left(\mathrm{PET}^{w}+P^{w}\right)^{1 / w-1},$
$\gamma=\partial Q / \partial \mathrm{PET}^{-}=\mathrm{PET}^{w-1}\left(\mathrm{PET}^{w}+P^{w}\right)^{1 / w-1}-1.$

2.4.3 Item-by-item investigation method

The first, second, and third China Water Resources Survey and Evaluation Projects conducted itemized investigations and restored the direct water intake in the LRB, including agricultural irrigation, industrial water use, domestic water use, reservoir storage capacity, and inter-basin water transfer. The restoration outcomes passed the comprehensive water balance evaluation within the watershed scope. The itemized investigation and restoration method can estimate the human direct water intake quantity (Qhd) during different periods.

2.4.4 Flow duration curve (FDC)

The FDC illustrates the percentage of time (Pa) in a given runoff (Qa) was equaled or exceeded during a specified period of time (Li, 2022). When Qa is arranged in descending order, Pa can be expressed as follows:
$P_{a}=\frac{a}{m+1},$
where a is the rank of Qa; and m is the sample size of Qa.

2.5 Determining runoff response to changes in climate and land use/cover

The basic framework of this study is illustrated in Figure 2. First, the hydrometeorological series of the watershed were divided into two sub-series through statistical methods and the actual conditions of watershed, such as dam construction and soil and water conservation measures. The first period is called the baseline period (BP), during which runoff is considered almost unaffected by human activities. The second period is called the altered period (AP), which is influenced by climate variability and human activities and can be further divided into several sub-series. Therefore, assuming that climate variability and human activities are independent of each other, the change in annual average flow during AP (QAP; mm) relative to BP (QBP; mm), denoted as ΔQ (mm), can be considered as the linear superposition of climate variability (ΔQc; mm) and human activities (ΔQh; mm):
$\Delta Q=Q_{\mathrm{AP}}-Q_{\mathrm{BP}}=\Delta Q_{\mathrm{c}}+\Delta Q_{\mathrm{h}}.$
Using a hydrological model, the natural runoff (Qsim; mm) on AP can be obtained. Therefore, ΔQc (mm) or ΔQh (mm) can be expressed as:
$\Delta Q_{\mathrm{h}}=Q_{\mathrm{AP}}-Q_{\mathrm{sim}} \text { or } \Delta Q_{\mathrm{c}}=Q_{\mathrm{sim}}-Q_{\mathrm{BP}}$
We divided ΔQc (mm) into contributions from precipitation and PET based on climate sensitivity method. According to the investigation and restoration method, we obtained the direct exploitation index (Qhd; mm). As a typical agricultural basin, the impact of urbanization can be ignored in the LRB, and soil and water conservation measures are the most significant factors of land use change. Therefore, under the assumption of ignoring insignificant human activities, it can be considered that the impact of human activities only includes Qhd and soil and water conservation measures. The impact of soil and water conservation measures on runoff (Qhc; mm) can be expressed as follows:
$Q_{\mathrm{hc}}=\Delta Q_{\mathrm{h}}-Q_{\mathrm{hd}}.$
The relative contribution rates of climate change (ηc), direct exploitation (ηhd), and soil and water conservation measures (ηhc) to runoff variations can be expressed as follows:
$\eta_{\mathrm{c}}=\frac{\Delta Q_{\mathrm{c}}}{\left|\Delta Q_{\mathrm{c}}\right|+\left|\Delta Q_{\mathrm{h}}\right|}, \eta_{\mathrm{hd}}=\frac{\Delta Q_{\mathrm{hd}}}{\left|\Delta Q_{\mathrm{c}}\right|+\left|\Delta Q_{\mathrm{h}}\right|}, \eta_{\mathrm{hc}}=\frac{\Delta Q_{\mathrm{hc}}}{\left|\Delta Q_{\mathrm{c}}\right|+\left|\Delta Q_{\mathrm{h}}\right|} \text {, }$
where $\left|\Delta Q_{\mathrm{c}}\right|$ and $\left|\Delta Q_{\mathrm{h}}\right|$ are the absolute values of the linear superposition of climate variability (mm) and human activities (mm), respectively.
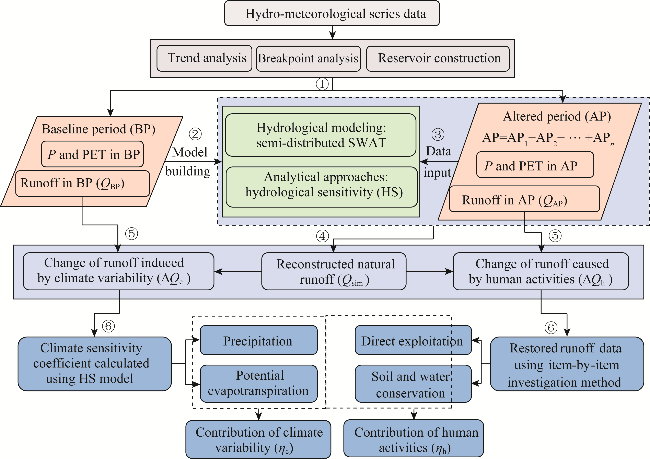
Fig. 2 Basic framework of runoff change attribution analysis. P, precipitation; PET, potential evaporation; Q, runoff; SWAT, Soil and Water Assessment Tool. The abbreviations are the same in the following figures and tables.

3 Results

3.1 Trends and breakpoints of hydrometeorological variables

The precipitation and PET in the LRB showed no significant decreasing trend from 1956 to 2020. At the same time, the runoff exhibited a significant decreasing trend of -0.86 mm/a (Fig. 3). The decrease in runoff corresponded to 2.55% of the annual average runoff (33.73 mm). In contrast, precipitation and PET decreased by 0.01% and 0.07%, respectively. The change-point analysis showed no significant change for precipitation, and the sequential clustering analysis suggested a change point in PET in 2004. However, it did not pass the significance test at α=0.10. The sequential clustering analysis identified the best and second-best breakpoints in 2000 and 1970, respectively, and PT showed that both points passed the significance test at α=0.05. Therefore, it could be assumed that there were two breakpoints in annual runoff.
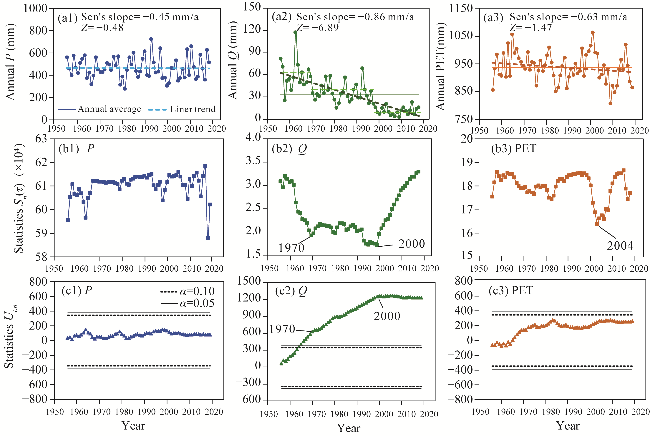
Fig. 3 Time series (a1-a3), sequential cluster (b1-b3), and Pettitt test (PT) (c1-c3) of annual P, Q, and PET. Sn(τ) is the sum of squared deviations; Ut,n is the Mann-Whitney statistic; and α is the significance level.
The double mass curve of annual precipitation and runoff (Fig. 4a) showed clear turning points around 1970 and 2000 with a downward deviation. The runoff coefficient α showed a significant decreasing trend on an annual basis and exhibited significant segmentation (Fig. 4b). The average values of α in the three periods were 0.13, 0.03, and 0.03, respectively, with a decrease of 14.95% and 80.14% in the two AP, indicating a significant alteration in the runoff generation. Therefore, using 1970 and 2000 as the dividing points between BP and AP conformed to statistical laws and corresponded to the actual runoff changes in the LRB.
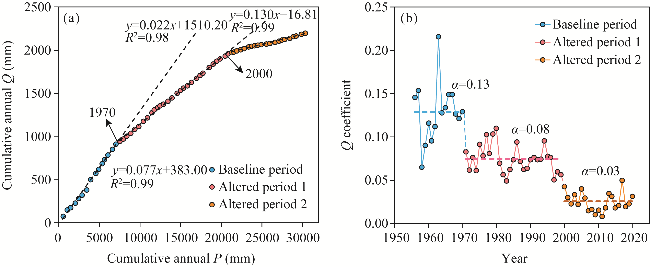
Fig. 4 Verification of the break point's election using (a) double mass curve and (b) runoff coefficient

3.2 Changes in hydrometeorological variables in different periods

The study was divided into three periods, i.e., BP (1956-1970), AP1 (1971-1999), and AP2 (2000-2020). The variations in precipitation, PET, and runoff in different periods are listed in Table 1. Compared with that in BP, precipitation and PET in the entire AP decreased by 2.25% and 2.16%, respectively. Compared with that in BP, precipitation increased by 1.30% in AP1 and decreased by 5.37% in AP2. PET decreased by 2.29% and 1.94% in the two periods, respectively. The observed runoff decreased by 40.72% and 81.45% in the two periods, respectively, with a total decrease of 56.32% over the entire AP. The changes in runoff were significantly greater than those in precipitation and PET.
Table 1 Changes of hydrometeorological variables in different periods
Variable BP
(1956-1970; n=15)
(mm)
AP1 (1971-1999; n=29) AP2 (2000-2020; n=21) AP (1971-2020; n=50)
Mean (mm) Percentage (%) Mean (mm) Percentage (%) Mean (mm) Percentage (%)
P 469.92 476.04 1.30 444.66 -5.37 464.02 -2.25
PET 955.10 933.20 -2.29 936.52 -1.94 934.47 -2.16
Q 60.86 36.08 -40.72 11.29 -81.45 26.59 -56.32

Note: BP, baseline period; AP, altered period.

To further understand the seasonal variations in the hydrometeorological variables, we compared the changes in the monthly average precipitation, runoff, and PET in different periods (Fig. 5). Compared with that in BP, precipitation showed significant variations at the monthly scale, with a significant decrease in July and August and decreases of 36.49% and 18.27% in AP1 and AP2, respectively. In AP, runoff increased by 275.21% and 50.88% in May, whereas it decreased to varying degrees in the remaining months. The most significant decrease occurred during the flood season in July and August, with decreases of 37.20% and 83.87% in July for AP1 and AP2, respectively. PET showed a decreasing trend in all months, with the most prominent decreases in May and June, with reductions of 31.07% and 26.27%, respectively.
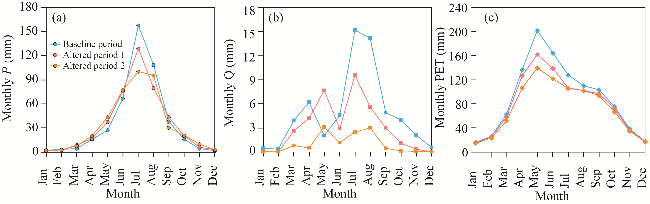
Fig. 5 Monthly changes of P (a), Q (b), and PET (c) in different periods

3.3 SWAT model simulation results and sensitivity analysis

Figure 6 shows a good fit between measured and simulated runoff values at the Xinmin Station, which is the outlet of the LRB. The calibration and validation periods had NSE values above 0.80 and satisfactory performance in simulating the peak flow variations. According to Moriasi's evaluation guidelines, the simulation performance in the LRB was classified as ''very good''. The simulation results indicated that the observed runoff in AP was significantly lower than the simulated values (natural runoff), especially in AP2, where the runoff reduction was particularly pronounced. At the monthly scale, in AP1, the measured runoff was only higher than the simulated values in May. In contrast, the runoff decreased by 27.00%-96.00% in the remaining months. In AP2, except for May, when the runoff change was not significant, the runoff decreased by 76.00%-99.00% in the other months.
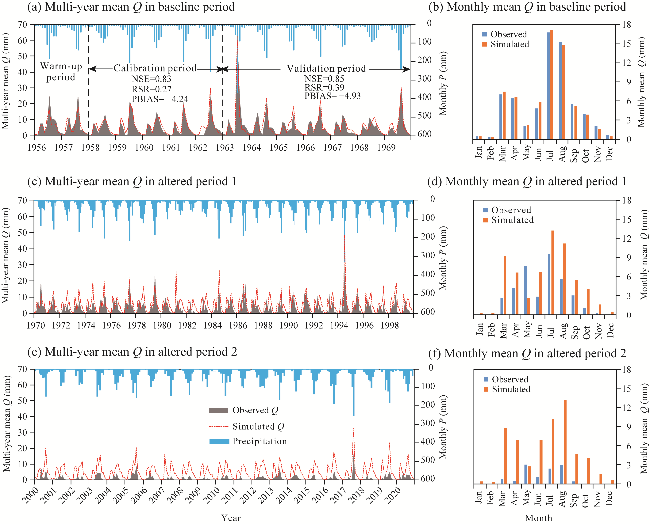
Fig. 6 Observed and simulated multi-year mean runoff and monthly runoff in baseline period (a and b), altered period 1 (c and d), and altered period 2 (e and f). NSE, Nash-Sutcliffe efficiency; RSR, ratio of the root mean square error to the standard deviation of the measured data; PBIAS, percent bias.
Based on the monthly SWAT results, we obtained variations in the observed and natural runoff at the annual scale, and calculated the cumulative impacts of human activities and climate variability on runoff (Fig. 7). The simulated values for AP1 and AP2 were significantly higher than the observed values, particularly for AP2, indicating the influence of human activities. The cumulative impact of human activities during the entire altered period was -1392.10 mm, exhibiting a phased change pattern. The cumulative impact of climate variability was -220.90 mm, showing a fluctuating increasing trend.
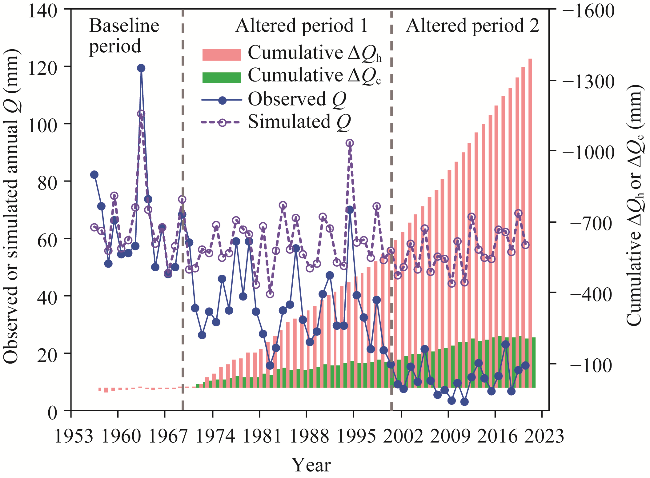
Fig. 7 Observed and simulated annual runoff and cumulative linear superposition of climate variability (ΔQc) and human activities (ΔQh) in different periods. The abbreviations are the same in the following figure.
Based on the Budyko hypothesis, we conducted sensitivity analysis using Equation 11. The underlying surface parameter w was determined to be 2.56 using BP data and fitted with Origin software. The elasticity coefficients εP and εPEV, representing the runoff response to changes in precipitation and PET, respectively, were calculated as 2.44 and -0.71, and it can be observed that runoff in the LRB was more sensitive to changes in precipitation, with a 2.44% increase or a −0.71% decrease for every 1% change in precipitation and PET.

3.4 Quantitative attribution of runoff variation

Based on the SWAT model and the Budyko sensitivity analysis, we quantitatively calculated the impacts of climate change and human activities on runoff variation using Equation 19 (Table 2). The results from both approaches consistently indicated that human activities were the primary driving force behind the flow decrease of the LRB, with contribution rates of 86.30% and 95.89%. However, there were differences in the impacts during different stages. The SWAT model suggested that climate change caused a decrease in runoff in AP1. In contrast, the sensitivity analysis showed increased runoff caused by climate change during the same period. In AP1, the calculated impacts of human activities using these two methods were -21.46 and -28.42 mm, which equated to -43.38 and -43.56 mm in AP2. Both methods provide consistent estimates of runoff variation, demonstrating the reliability of quantitative evaluation results.
Table 2 Relative impact of climate change and human activities on runoff based on the SWAT (Soil and Water Assessment Tool) model and the Budyko sensitivity analysis
Period ΔQ
(mm)
SWAT model Budyko sensitivity analysis
ΔQc ΔQh ΔQc ΔQh
Mean
(mm)
Percentage (%) Mean
(mm)
Percentage (%) Mean
(mm)
Percentage (%) Mean
(mm)
Percentage (%)
AP1 -24.65 -3.19 12.94 -21.46 87.06 3.77 11.71 -28.42 88.29
AP2 -49.50 -6.12 12.36 -43.38 87.64 -3.78 12.00 -43.56 88.00
BP -34.31 -4.70 13.70 -29.61 86.30 -1.33 4.11 -32.90 95.89

Note: ΔQ is the changes in annual average runoff during altered period (AP) relative to baseline period (BP).

3.5 Effects of climate variability and human activity on runoff

Compared with human activities, the impact of climate change was relatively minor, with an annual effect ranging from 10.00 to -20.00 mm using Equation 16. Over the entire AP, climate change reduced runoff, with impact estimates of -4.70 and -1.33 mm from two different methods, contributing 13.70% and 4.11%, respectively. During the entire AP, the sensitivity analysis (Eqs. 11-14) further decomposed the impacts of climate change on precipitation and PET, which were -1.78 and 0.45 mm/a, respectively. An insignificant increase in precipitation led to a decrease in runoff. In contrast, a decrease in PET led to an increase in runoff.
Figure 8a shows the relationship between the impact of human activity on runoff and annual precipitation in different periods. Regardless of the period, the abundance or scarcity of annual precipitation did not significantly affect human activity. From a decadal perspective (Fig. 8b), the impact of human activity showed an increasing trend. The multi-year mean ΔQh in BP was around 0.00 mm; by the 20th century, it had changed to -50.00 mm. In the LRB, the direct impact of human activities includes inter-basin water transfer and direct water consumption. In contrast, indirect impact refers to the influence of watershed soil and water conservation measures. Due to various soil and water conservation measures, it is difficult to directly quantify their impacts on runoff changes. This study inferred the impact of soil and water conservation measures on runoff through direct water consumption in different decades in the LRB (Fig. 8c). The decrease in runoff caused by soil and water conservation measures showed an increasing trend on a decadal scale, accounting for 66.00%-84.00% of the total impact (Fig. 8d).
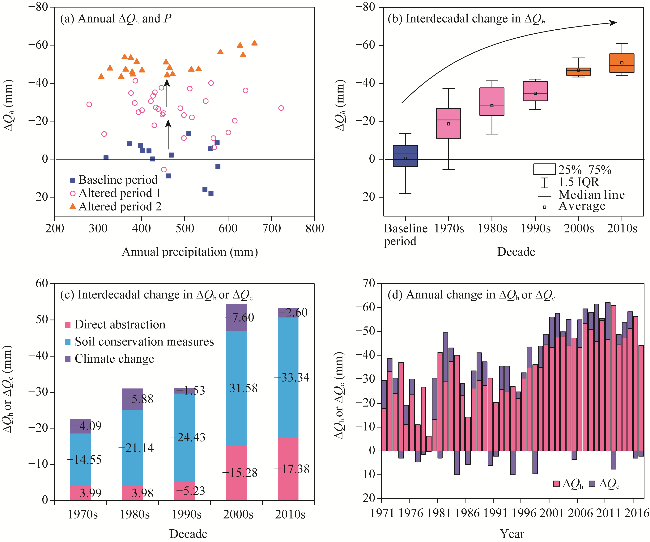
Fig. 8 Impact of human activities on runoff under different annual precipitation (a) and decades (b), quantification of interdecadal runoff change under human activities or climate change (c), and quantification of annual runoff change under human activities or climate change (d). IQR, interquartile range.

4 Discussion

4.1 Comparison of results from different methods

In arid and semi-arid areas, the nonlinear relationship between meteorological factors and runoff is more pronounced than in humid areas (Lacombe et al., 2008; Ma et al., 2008; Dong et al., 2014). Simulation results obtained using the Budyko formula of annual water-energy or multiple linear regression methods have not been satisfactory (Jiang et al., 2011; Zhao et al., 2014; Luan et al., 2021). The determination coefficients (R2) for these two methods between observed and simulated runoff in BP of the LRB were 0.57 and 0.42, respectively, while R2 of the SWAT model is 0.89. The sensitivity model based on the Budyko sensitivity analysis could simulate the impact of climate change on runoff on a multi-year mean scale through sensitivity coefficients. However, the results of the two methods are not entirely consistent, indicating that their applicability in semi-arid basins varies.
Certain discrepancies were observed in the calculated results between the two methods in different periods. In AP1, they may yield opposite outcomes. AP1 is characterized by an increase in precipitation and a decrease in PET (Table 1). The runoff impact calculated by the sensitivity model must be positive because the elasticity of precipitation was positive and that of PET was negative. However, the SWAT results showed that climate change led to a decrease in runoff. In AP2, ΔQc values of the SWAT model were lower than those of sensitivity model. The differences in the results may be caused by the inherent limitations of sensitivity model itself, as the sensitivity model based on the Budyko theory calculates changes in precipitation and PET only at the multi-year mean scale without considering the inter-annual variability of precipitation or its distribution within a year (Dey and Mishra, 2017; Luan et al., 2021). However, the inter-annual variability and intra-annual distribution of precipitation can significantly affect annual runoff changes, particularly in arid and semi-arid areas (Shi et al., 2023). In semi-arid areas, precipitation is rare and concentrates throughout the year, with heavy rainfall being the main component. Heavy rainfall has a short duration and high intensity, resulting in rapid infiltration and flood formation. This was an important component of the annual runoff, accounting for approximately 50.00% of the annual runoff in the LRB (Zhang et al., 2008b). During the non-flood season, much precipitation evaporates directly because of intense evaporation and low soil moisture content, making it difficult to generate runoff (Allan et al., 2021). In conclusion, an increase in the annual mean precipitation does not necessarily lead to a decrease in runoff. Considering the LRB as an example, although the annual mean precipitation in AP1 was higher than that in BP, it was manifested as an increase in precipitation during the dry season. In contrast, the key precipitation during the flood season decreased by 37.00%, resulting in a decrease in runoff.
The SWAT model is a process-based approach that does not rely directly on the correlation between annual precipitation and runoff. This can establish a comprehensive connection between changes in precipitation components and runoff, specifically the effects of changes in precipitation distribution on runoff within a year. This explains the differences between the SWAT and more sensitive models. Therefore, in arid to semi-arid areas, due to their unique runoff characteristics, changes in precipitation within a year, including variations in intense rainfall and ineffective precipitation components, must be considered when studying runoff variation. Process-based hydrological models that fully consider the distribution of precipitation within a year are more applicable in arid to semi-arid areas than methods driven by annual or multi-year mean data (such as the Budyko-based model and the multiple linear regression method).

4.2 Impact of climate change on runoff

The sensitivity of runoff variations to precipitation in semi-arid areas depends, to a certain extent, on their sensitivity to heavy precipitation events, with runoff being more sensitive to heavy precipitation than to annual or multi-year mean precipitation (Wang et al., 2020; Camus et al., 2021). In the LRB, the frequency of heavy precipitation events in AP decreased compared with that in BP. Considering July as an example (precipitation in July accounts for the largest proportion of annual precipitation at approximately 30.00%), the average precipitation at all rainfall gauges in July showed varying degrees of decrease, and the extremely high precipitation amount at most stations showed a decreasing trend (Fig. 9). The frequency of high precipitation events decreased significantly in AP, with AP2 showing the most significant decrease. An increase in precipitation in dry season (Fig. 5) did not significantly increase runoff; however, a decrease in the frequency and intensity of heavy precipitation effectively reduced runoff. Therefore, even if the annual average precipitation increases in AP1, the impact of decreased precipitation in flood season on runoff is far greater than that of increased precipitation in dry season. This explains why in AP1, despite the increase in precipitation, climate change manifests as a decrease in runoff (Table 2). In AP2, the intensity of heavy precipitation decreased again, and if this change was not considered when calculating the runoff change caused by precipitation changes, the precipitation elasticity would be underestimated. The data showed that out of 51 a in AP, there were 20 a with annual precipitation higher than that of BP. Among these 20 a, the annual runoff in 12 a was lower than that in BP. For example, in 1975, the annual precipitation was 498.17 mm, being 28.25 mm higher than that of BP. However, the simulated runoff was 7.28 mm, which was lower than that of BP.
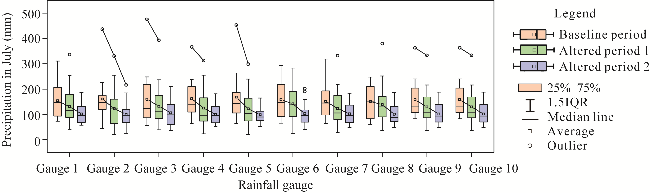
Fig. 9 Box plots of precipitation in the runoff-producing areas of the LRB during July in different periods

4.3 Impact of human activities on runoff

4.3.1 Direct water consumption

The contribution rate of direct water consumption to runoff was approximately 0.13%-0.33%, showing an increasing trend. Water consumption mainly occurs in the Naodehai Reservoir and the upstream area (Meng, 1994). Considering the Naodehai Reservoir as an example, it started supplying water to Fuxin City in 1995, with a supply of only 50×106 m3, and then increased at an average rate of 15×106 m3/a (Li, 2022). With the economic development of Fuxin City and the increase in water demand due to continuous drought and less precipitation since 2000, the cross-basin water supply from the Naodehai Reservoir has significantly increased. By 2003, the Naodehai Reservoir had become one of the main water sources for Fuxin City, with an annual supply of approximately 230×106 m3 (Zhang et al., 2008b). After 2008, in addition to Fuxin City, the Naodehai Reservoir supplied water to the Qijiazi Reservoir and Zhangwu Power Plant with annual supplies of 25×106 and 87×106 m3, respectively (Zhao et al., 2014). On an annual scale, human activities caused a decrease in runoff in all years, with the degree of impact showing an increasing trend. Although climate change reduces runoff on a decadal scale, wet years can increase runoff annually (Fig. 8d).

4.3.2 Soil and water conservation measures

The impact of soil and water conservation measures on runoff reduction was the most significant and gradually increased. Compared with the 1970s, the impact of soil and water conservation measures in the 2010s increased by nearly 1.3 times. Before large-scale comprehensive management, vegetation coverage in the LRB was only approximately 10.00%. By 1993, after completing the first phase of comprehensive management, the coverage had reached 34.60% (Zhang et al., 2008b). This stage is known as the ''ten-year management'' period, which was the stage with the most rapid changes in the underlying surface of the LRB (Li, 2022). Comprehensive management includes both biological and engineering measures. Biological measures include afforestation, grass planting, and mountain closure (Li, 2022). Engineering measures included terracing, dams, mountain ditches, and valley mills. Afforestation is the most important measure (Fig. 10). Through an analysis of the soil and water conservation benefits from 1983 to 1993, Meng (1994) believed that the ''ten-year management'' increased the annual water interception by 50×106 m3, annual water storage by 1×10⁶ m3, and water storage efficiency by 67.70%. By 2004, the ecological construction of soil and water conservation was completed, and vegetation coverage reached 37.00%. The increase in vegetation coverage intercepts and stores more runoff and increases the actual evapotranspiration in the watershed. In addition, reservoir construction plays a role in intercepting and storing runoff to a certain extent. Apart from the Naodehai Reservoir, dozens of reservoirs and dams have been built in upstream runoff-producing areas. The regulation of reservoirs has changed the distribution of runoff upstream during dry and flood seasons, significantly reducing the flood season runoff, with a reduction rate of 6×10⁶ m3/a at the watershed outlet. However, the construction of reservoirs directly increases the water surface area, and strong evaporation capacity results in increased water loss through evaporation. According to incomplete statistics, from 1983 to 2017, the cumulative area of soil and water conservation in the LRB reached 1844.70 km2, accounting for 33.00% of the total area. This has fundamentally changed the runoff characteristics and ecological environment of the LRB.
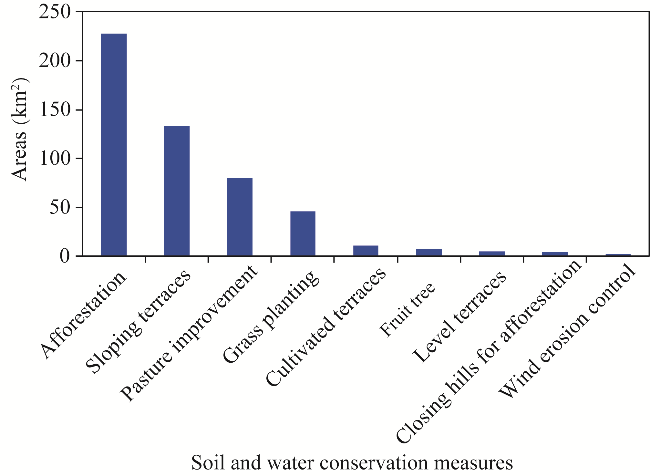
Fig. 10 Areas of soil and water conservation measures in the LRB during the ''ten-year management'' period
The FDC represents the relationship between magnitude and frequency of runoff and can fully reflect the characteristics of high and low flows, such as magnitude and frequency, and it is widely used to evaluate hydrological changes and the impacts of various human activities on runoff (Fennessey, 1995; Zhang et al., 2018). From the frequency distribution of the FDC in different periods (Fig. 11), it can be observed that both high and low flows significantly decreased, with a significant decrease in the frequency of high flow and a significant decrease in the frequency of low flow. However, by observing the frequency distribution of monthly precipitation, it was observed that the frequency of high precipitation was lower in AP1 and AP2 than in BP, which was one of the reasons for the decrease in runoff. However, the dominant driving factors for the decrease in runoff and changes in runoff frequency distribution were still soil and water conservation measures. Detailed reasons for this can be observed in the analysis of the two flood cases.
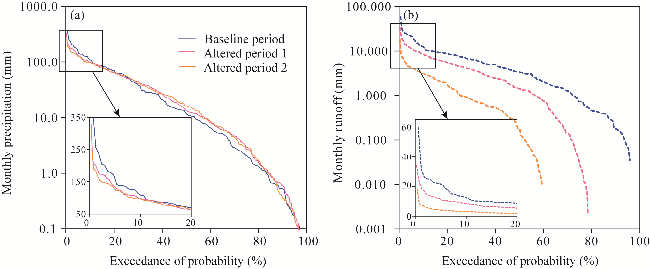
Fig. 11 Frequency distribution of monthly precipitation (a) and runoff (b) in different periods

4.3.3 Hydrological characteristics of two major floods before and after soil conservation measures

To demonstrate the comprehensive effects of soil and water conservation measures on runoff interception and flood peak reduction, we analyzed the measured data of the two major floods before and after implementing the ''ten-year management'' measures. The floods occurred on 20 July, 1963 (before management) and 13 July, 1994 (after management). Before these two floods, the basin had experienced more than 10 months of drought. Specific information is shown in Table 3. Precipitation from the flood in 1994 was 1.9 times that in 1963. However, the peak flow at all stations, except for the Baimiaozi Station, was only 7.00%-24.00% of that in 1963. According to the flood analysis results of the LRB, the daily precipitation during the flood in 1963 was a 20-a event (P=0.05), whereas the flood peak and volume were 100-a events (P=0.01). In contrast, the daily precipitation during the flood in 1994 after comprehensive soil and water conservation was a 100-a event (P=0.01); however, the flood peak and volume did not meet the 20-a standard (P>0.05). The peak flow and total flood volume in the upstream runoff-producing area decreased by 77.98% and 55.16%, respectively, despite a nearly doubling increase in precipitation. The differences in flood characteristics between the two events reflect the hydrological effects of soil and water conservation measures to a certain extent. However, it must be noted that the conditions of the two floods are different, after all, time span of the two floods is 31 a. Therefore, the difference between the two floods cannot be attributed entirely to soil and water conservation measures, as changes in the underlying surface of the basin, such as reservoir construction, urbanization, and flood control measures, all have an impact on the comparison.
Table 3 Comparison of flood characteristics before and after soil and water conservation measures in the LRB
Hydrological station Control area
(km2)
Flood in 1963 Flood in 1994
Rainoff
(mm)
Peak flow
(m3/s)
Flood volume
(108 m3)
Rainoff
(mm)
Peak flow
(m3/s)
Flood volume
(108 m3)
Shanjiazi 825 84.50 966 - 188.50 165 -
Baimiaozi 341 91.50 729 - 194.00 442 -
Shimenzi 2405 117.60 6780 - 213.60 1623 -
Naodehai 4051 105.17 8630 2.23 202.75 1900 1.00

Note: - means no value.

4.3.4 Hydrological response of sub-basins during the flood in 1994

We further analyzed the storage capacity changes of the three small reservoirs during the flood in 1994. These three reservoirs are located in the upstream area (Fig. 1), with similar topography, proximity, and precipitation, and thus possess good comparability. The soil and water conservation measures in the Zhaohubi and Woniushan reservoir areas are relatively high, with a runoff coefficient of less than 0.1 during the flood period and over 90.00% of the water being retained in the reservoir area (Table 4). In contrast, the runoff coefficient in the Hatu Reservoir, where no soil or water conservation measures were implemented, reached 0.4, which is 4.0 times higher than that in the conservation area. This indicates that the interception and retention effects of soil and water conservation measures on runoff are the fundamental reasons for the difference in runoff coefficients during the flood in 1994 and the significant contrast between floods in 1963 and 1994.
Table 4 Hydrologic characteristics of three small reservoirs during the flood in 1994
Reservoir Control area (km2) Degree of soil and water conservation (%) Total reservoir
capacity (×104 m3)
Increase in reservoir
capacity (×104 m3)
Precipitation
(mm)
Runoff coefficient
Zhaohubi 4.9 88 43.4 6.5 212 0.08
Woniushan 6.0 91 64.3 11.4 207 0.09
Hatu 6.6 0 132.4 62.8 240 0.40

4.4 Uncertainty analysis

We quantified the impacts of climate change, direct water resource extraction, and soil and water conservation measures on the runoff changes of the LRB. The quantitative assessment results are based on multiple assumptions, which bring non-negligible uncertainties to the results. We initially assumed that before the breakpoint, the basin was in a natural state, unaffected by human activities or the impact of human activities was negligible (Wang, 2014; Dey and Mishra, 2017). However, the reality is that most basins have been disturbed before the breakpoint. Considering this situation, it may lead to an underestimation of human activities. In addition, we assumed that human activities and climate change are independent of each other. In fact, studies have shown that large-scale land use change can change regional climate patterns (Trail et al., 2013; Findell et al., 2017). Moreover, under the broader context of global climate change, human activities are subtly influenced by climate change (Masson et al., 2021). For example, extraction may be greater in dry years. The feedback interaction between human activities and climate change is complex and nonlinear, often necessitating qualitative analysis or large-scale quantitative assessment. This further complicates and destabilizes the impact of changing environments on watershed hydrological cycles. Hence, runoff variation attribution analysis typically relies on the assumption that these two factors are independent (Dey and Mishra, 2017). With current observational and experimental methods, it remains challenging to incorporate the feedback between climate change and human activities into the research framework for runoff variation attribution. The hydrological models and sensitivity models used in this study have some uncertainties in meteorological data input, model structure, and parameters (Li et al., 2023), which we have discussed in the previous section. Finally, when comparing the flood characteristics before and after soil and water conservation in the LRB, although the flood characteristics before and after conservation differ greatly, it should be noted that the time span of the two floods is 31 a. Although soil and water conservation measures can serve as variables for comparison, differences in other flood conditions may affect the comparison results, such as urbanization and changes in the operation modes of upstream small reservoirs.

5 Conclusions

This study examined the hydrological effects of climate change, direct water abstraction, and soil and water conservation measures from the perspective of long-term runoff changes in the LRB. The annual runoff in the LRB showed a significant decreasing trend and was divided into BP and two APs. Using a SWAT model and sensitivity analysis based on the Budyko hypothesis, we found that human activities were the main cause of the decrease in runoff. The impact of climate change was mainly reflected in the decrease in flood volume caused by a decrease in precipitation during flood season, which reduced the accuracy of evaluation methods based on long-term average data. The contribution of soil and water conservation measures to the decrease in runoff has shown an increasing trend over decades, accounting for 66.00%-84.00% of the total impact. Soil and water conservation measures caused an overall shift in the monthly flow duration curve, leading to a significant decrease in the frequency of high flow and a significant reduction in the frequency of low flows. Further analysis of two typical flood cases demonstrated that soil and water conservation measures reduced the peak flow and total flood volume in the upstream runoff-producing area by 77.98% and 55.16%, respectively, even with nearly double the precipitation. The runoff coefficient in the small basins without soil and water conservation measures was 4.0 times higher than that in the highly conserved small basins. In summary, the fundamental reason for the significant decrease in runoff in the upstream of the watershed was the implementation of soil and water conservation measures. This study elucidated the comprehensive hydrological impacts of soil and water conservation measures in the LRB, offering substantial theoretical and practical insights for the optimal allocation of water resources and the preservation of the aquatic ecological environment.

Conflict of interest

The authors declare that they have no known competing financial interests or personal relationships that could have appeared to influence the work reported in this paper.

Acknowledgements

This research was funded by the Fundamental Research Funds for the Central Universities (ZY20230206) and Langfang City Science and Technology Research and Development Plan Self-raised Funds Project (2023013216). We also thank Professor XIAO Changlai and CAO Yuqing of Jilin University for their support in obtaining research data.

Author contributions

Conceptualization: LI Mingqian; Methodology: WANG He, DU Wei; Formal analysis: GU Hongbiao; Writing - original draft preparation: LI Mingqian, ZHOU Fanchao; Writing - review and editing: CHI Baoming; Funding acquisition: LI Mingqian. All authors approved the manuscript.
[1]
Allan J, Castillo U, Capps K A. 2021. Stream Ecology, Structure and Function of Running Waters. Switzerland: Springer Nature.

[2]
Allen R, Pereira L, Raes D, et al. 1998. Crop evapotranspiration guidelines for computing crop water requirements. In: FAO Irrigation and Drainage Paper 56. FAO, 1998. Rome.

[3]
Budyko M I. 1974. Climate and Life. London: Academic Press.

[4]
Camus P, Haigh I D, Nasr A, et al. 2021. Regional analysis of multivariate compound coastal flooding potential around Europe and environs: Sensitivity analysis and spatial patterns. Natural Hazards and Earth System Sciences, 21(7): 2021-2040.

[5]
Castellanos G, López A, Pérez J, et al. 2023. Disaggregated monthly SWAT+ model versus daily SWAT+ model for estimating environmental flows in Peninsular Spain. Journal of Hydrology, 623: 129837, doi: 10.1016/j.jhydrol.2023.129837.

[6]
Chang J, Zhang H, Wang Y, et al. 2016. Assessing the impact of climate variability and human activities on streamflow variation. Hydrology and Earth System Sciences, 20(4): 1547-1560.

[7]
Chen T, Zou L, Xia J, et al. 2022. Decomposing the impacts of climate change and human activities on runoff changes in the Yangtze River Basin: Insights from regional differences and spatial correlations of multiple factors. Journal of Hydrology, 615(1): 128649, doi: 10.1016/j.jhydrol.2022.128649.

[8]
Dey P, Mishra A. 2017. Separating the impacts of climate change and human activities on streamflow: A review of methodologies and critical assumptions. Journal of Hydrology. 548: 278-290.

[9]
Ding J. 1986. Statistical detection for transition point in flood time sequences. Engineering Journal of Wuhan University, 5: 36-41. (in Chinese)

[10]
Dong W, Cui B S, Liu Z H, et al. 2014. Relative effects of human activities and climate change on the river runoff in an arid basin in northwest China. Hydrological Processes, 28(18): 4854-4864.

[11]
Fennessey N. 1995. Flow duration curves II. Journal of the American Water Resources Association, 31: 1029-1039.

[12]
Findell K, Berg A, Gentine P, et al. 2017. The impact of anthropogenic land use and land cover change on regional climate extremes. Nature Communications, 8(1): 989, doi: 10.1038/s41467-017-01038-w.

[13]
Fu H B. 1981. On the calculation of the evaporation from land surface. Chinese Journal of Atmospheric Sciences, 5(1): 23-31. (in Chinese)

[14]
Gao G Y, Fu B J, Wang S, et al. 2016. Determining the hydrological responses to climate variability and land use/cover change in the Loess Plateau with the Budyko framework. Science of the Total Environment, 557-558: 331-342.

[15]
Gao G Y, Ning Z, Li Z W, et al. 2021. Prediction of long-term inter-seasonal variations of streamflow and sediment load by state-space model in the Loess Plateau of China. Journal of Hydrology, 600: 126534, doi: 10.1016/j.jhydrol.2021.126534.

[16]
Ghanghas A, Sharma A, Dey S, et al. 2023. How is spatial homogeneity in precipitation extremes changing globally? Geophysical Research Letters, 50(16): 103233, doi: 10.1029/2023GL103233.

[17]
Hu J Y, Wu Y P, Wang L J, et al. 2021. Impacts of land-use conversions on the water cycle in a typical watershed in the southern Chinese Loess Plateau. Journal of Hydrology, 593: 125741, doi: 10.1016/j.jhydrol.2020.125741.

[18]
Jiang S H, Ren L L, Yong B, et al. 2011. Quantifying the effects of climate variability and human activities on runoff from the Laohahe basin in northern China using three different methods. Hydrological Processes, 25(16): 2492-2505.

[19]
Jiang S H, Zhou L, Ren J, et al. 2021. Development of a comprehensive framework for quantifying the impacts of climate change and human activities on river hydrological health variation. Journal of Hydrology, 600(5): 126566, doi: 10.1016/j.jhydrol.2021.126566.

[20]
Kendall M. 1975. Rank Correlation Measures. London: Charles Griffin.

[21]
Lacombe G, Cappelaere B, Leduc C. 2008. Hydrological impact of water and soil conservation works in the Merguellil catchment of central Tunisia. Journal of Hydrology, 359(3-4): 210-224.

[22]
Li M Q. 2022. Watershed hydrological cycle under a changing environment-cases study in Liaoning Province. PhD Dissertation. Changchun: Jilin University. (in Chinese)

[23]
Li M Q, Gu H B, Wang H, et al. 2023. Quantifying the impact of climate variability and human activities on streamflow variation in Taoer River Basin, China. Environmental Science and Pollution Research, 30(19): 56425-56439.

[24]
Liu J Y, Zhang Q, Singh V P, et al. 2017. Contribution of multiple climatic variables and human activities to streamflow changes across China. Journal of Hydrology, 545: 145-162.

[25]
Liu X, Liu C, Yang S, et al. 2014. Influences of shrubs-herbs-arbor vegetation coverage on the runoff based on the remote sensing data in Loess Plateau. Acta Geologica Sinica, 69(11): 1595-1603.

[26]
Luan J K, Zhang Y Q, Ma N, et al. 2021. Evaluating the uncertainty of eight approaches for separating the impacts of climate change and human activities on streamflow. Journal of Hydrology, 601(1-4): 126605, doi: 10.1016/j.jhydrol.2021.126605.

[27]
Luo Y Y, Yang Y T, Yang D W, et al. 2020. Quantifying the impact of vegetation changes on global terrestrial runoff using the Budyko framework. Journal of Hydrology, 590(4): 125389, doi: 10.1016/j.jhydrol.2020.125389.

[28]
Ma Z M, Kang S Z, Zhang L, et al. 2008. Analysis of impacts of climate variability and human activity on streamflow for a river basin in arid region of northwest China. Journal of Hydrology, 352(3-4): 239-249.

[29]
Mann H B. 1945. Non-parametric test against trend. Econometrica, 13(3): 245-259.

[30]
Masson V, Zhai P, Pirani A, et al. 2021. Climate change 2021: The physical science basis. Contribution of working group I to the sixth assessment report of the intergovernmental panel on climate change. [2024-01-29]. https://www.ipcc.ch/report/ar6/wg1/.

[31]
Meng F C. 1994. The importance of soil and water conservation from the point of flooding control of Liaohe River. Water Resources & Hydropower of Northeast China, 126(12): 38-31, 37.

[32]
Milly P C D, Dunne K A. 2002. Macroscale water fluxes 2. Water and energy supply control of their interannual variability. Water Resources Research, 38(10): 24-1-24-9.

[33]
Moriasi D, Arnold J, Van M W, et al. 2007. Model evaluation guidelines for systematic quantification of accuracy in watershed simulations. Transactions of the Asabe, 50(3): 885-900.

[34]
Pettitt A N. 1979. A non-parametric approach to the change-point problem. Journal of the Royal Statistical Society: Series C ( Applied Statistics), 28(2): 126-135.

[35]
Qin Y, Abatzoglou J T, Siebert S, et al. 2020. Agricultural risks from changing snowmelt. Nature Climate Change, 10(5): 459-465.

[36]
Shi Y, Song J X, Zhang J L, et al. 2023. Hydrological response to climate change and human activities in the Bahe River, China. Journal of Hydrology, 617: 128762, doi: 10.1016/j.jhydrol.2022.128762.

[37]
Song X M, Zhang J Y, Zhan C S, et al. 2013. Review for impacts of climate change and human activities on water cycle. Journal of Hydraulic Engineering, 44(7): 779-790. (in Chinese)

[38]
Tabari H. 2021. Extreme value analysis dilemma for climate change impact assessment on global flood and extreme precipitation. Journal of Hydrology, 593(1): 125932, doi: 10.1016/j.jhydrol.2020.125932.

[39]
Tan M L, Gassman P, Yang X Y, et al. 2020. A review of SWAT applications, performance and future needs for simulation of hydro-climatic extremes. Advances in Water Resources, 143: 103662, doi: 10.1016/j.advwatres.2020.103662.

[40]
Trail M, Tsimpidi A, Liu P, et al. 2013. Potential impact of land use change on future regional climate in the Southeastern US: Reforestation and crop land conversion. Journal of Geophysical Research-atmospheres, 118(20): 11577-11588.

[41]
Uzun S, Tanir T, Coelho G, et al. 2021. Changes in snowmelt runoff timing in the contiguous United States. Hydrological Processes, 35(11): e14430, doi: 10.1002/hyp.14430.

[42]
Wang S P, Mcvicar T, Zhang Z Q, et al. 2020. Globally partitioning the simultaneous impacts of climate-induced and human-induced changes on catchment streamflow: A review and meta-analysis. Journal of Hydrology, 590(6): 125387, doi: 10.1016/j.jhydrol.2020.125387.

[43]
Wang X. 2014. Advances in separating effects of climate variability and human activity on stream discharge: An overview. Advances in Water Resources, 71(6): 209-218.

[44]
Yan S, Liu J Y, Gu X H, et al. 2021. Global runoff signatures changes and their response to atmospheric environment, GRACE water storage, and dams. Remote Sensing, 13(20): 4084, doi: 10.3390/rs13204084.

[45]
Yan Z H, Lei H M, Gao H D, et al. 2023. Simulating the hydrological impacts of intensive soil and water conservation measures in the Yellow River Basin using a distributed physically-based model. Journal of Hydrology, 625: 129936, doi: 10.1016/j.jhydrol.2023.129936.

[46]
Yin S H, Gao G Y, Ran L S, et al. 2023. Extreme streamflow and sediment load changes in the Yellow River Basin: Impacts of climate change and human activities. Journal of Hydrology, 619: 129372, doi: 10.1016/j.jhydrol.2023.129372.

[47]
Zhang Q, Zhang Z J, Shi P J, et al. 2018. Evaluation of ecological instream flow considering hydrological alterations in the Yellow River Basin, China. Global and Planetary Change, 160(9): 61-74.

[48]
Zhang X P, Zhang L, Zhao J, et al. 2008a. Responses of streamflow to changes in climate and land use/cover in the Loess Plateau, China. Water Resources Research, 44(7): W00A07, doi: 10.1029/2007WR006711.

[49]
Zhang Z L, Fan H M, Guo J C, et al. 2008b. The temporal and spatial variation of runoff and sediment discharge in Liuhe River Basin. Research of Soil and Water Conservation, 15(1): 229-231. (in Chinese)

[50]
Zhao G J, Tian P, Mu X, et al. 2014. Quantifying the impact of climate variability and human activities on streamflow in the middle reaches of the Yellow River Basin, China. Journal of Hydrology, 519: 387-398.

文章导航

/