
Spatiotemporal variation and influencing factors of desertification sensitivity on the Qinghai-Xizang Plateau, China
Received date: 2024-05-14
Revised date: 2024-10-22
Accepted date: 2024-10-28
Online published: 2025-08-13
PAN Meihui , CHEN Qing , LI Chenlu , LI Na , GONG Yifu . [J]. Journal of Arid Land, 2025 , 17(1) : 58 -73 . DOI: 10.1007/s40333-025-0002-1
Due to irrational human activities and extreme climate, the Qinghai-Xizang Plateau, China, faces a serious threat of desertification. Desertification has a detrimental effect on the ecological environment and socioeconomic development. In this study, the desertification sensitivity index (DSI) model was established by integrating the spatial distance model and environmentally sensitive area index evaluation method, and then the model was used to quantitatively analyze the spatial and temporal characteristics of desertification sensitivity of the Qinghai-Xizang Plateau from 1990 to 2020. The results revealed that: (1) a general increasing tendency from southeast to northwest was identified in the spatial distribution of desertification sensitivity. The low-sensitivity areas were mostly concentrated in the Hengduan and Nyaingqêntanglha mountains and surrounding forest and meadow areas. The high-sensitivity areas were located mainly in the Kunlun and Altun mountains and surrounding decertified areas. The center of gravity of all types of desertification-sensitive areas moved to the northwest, and the desertification sensitivity showed a decreasing trend as a whole; (2) the area of highly sensitive desertification areas decreased by 8.37%, with extreme sensitivity being the largest change among the sensitivity types. The desertification sensitivity transfer was characterized by a greater shift to lower sensitivity levels (24.56%) than to higher levels (2.03%), which demonstrated a declining trend; (3) since 1990, the change in desertification sensitivity has been dominated by the stabilizing type I (29.30%), with the area of continuously increasing desertification sensitivity accounting for only 1.10%, indicating that the management of desertification has achieved positive results in recent years; and (4) natural factors have had a more significant impact on desertification sensitivity on the Xizang Plateau, whereas socioeconomic factors affected only localized areas. The main factors influencing desertification sensitivity were vegetation drought tolerance and aridity index. Studying spatiotemporal variations in desertification sensitivity and its influencing factors can provide a scientific foundation for developing strategies to control desertification on the Qinghai-Xizang Plateau. Dividing different desertification-sensitive areas on the basis of these patterns of change can facilitate the formulation of more targeted management and protection measures, contributing to ecological construction and sustainable economic development in the area.
Table 1 Construction methods for various indices |
| Background index | Formula | Index composition | Index processing | Index description |
|---|---|---|---|---|
| Vegetation background index (VBI) | $\text{VBI=}\sqrt{\underset{i\text{=1}}{\overset{n}{\mathop \sum }}\,{{\text{(}{{V}_{i}}-{{V}_{i\text{-low}}}\text{)}}^{\text{2}}}}$ | Vegetation drought tolerance | + | Vegetation drought tolerance was determined by quantifying the types of vegetation (Li et al., 2018). |
| NDVI | - | |||
| Climatic background index (CBI) | $\text{CBI=}\sqrt{\underset{i\text{=1}}{\overset{n}{\mathop \sum }}\,{{\text{(}{{C}_{i}}-{{C}_{i\text{-low}}}\text{)}}^{\text{2}}}}$ | Annual average ground temperature (°C) | + | Aridity index=$P\text{/(}{{t}^{\text{0}}}\text{+10}$), where P is the mean annual precipitation (mm), and t0 is the annual mean temperature (°C) (Zhang, 1994). |
| Annual average wind speed (m/s) | + | |||
| Aridity index | - | |||
| Hydrological background index (HBI) | $\text{HBI=}\sqrt{\underset{i\text{=1}}{\overset{n}{\mathop \sum }}\,{{\text{(}{{H}_{i}}-{{H}_{i\text{-low}}}\text{)}}^{\text{2}}}}$ | Distance to glaciers (km) | + | The distances to glaciers, rivers, lakes, and reservoirs were calculated using the Euclidean distance tool in ArcGIS software (Wei et al., 2021). |
| Distance to rivers (km) | + | |||
| Distance to lakes and reservoirs (km) | + | |||
| Soil background index (SBI) | $\text{SBI=}\sqrt{\underset{i\text{=1}}{\overset{n}{\mathop \sum }}\,{{\text{(}{{S}_{i}}-{{S}_{i}}_{\text{-low}}\text{)}}^{\text{2}}}}$ | Soil organic matter content (%) | - | Soil organic matter content=soil organic carbon/0.58 (Wei et al., 2021). |
| Soil erosion intensity | + | |||
| Soil sand content (%) | + | |||
| Soil depth (cm) | + | |||
| Topographic background index (TBI) | $\text{TBI=}\sqrt{\underset{i\text{=1}}{\overset{n}{\mathop \sum }}\,{{\text{(}{{T}_{i}}-{{T}_{i\text{-low}}}\text{)}}^{\text{2}}}}$ | Slope (°) | - | Aspect is assigned values as follows: flat=1; west, northwest, and north=2; northeast and east=3; southeast, south, and southwest=4 (Xu et al., 2019). |
| Altitude (m) | - | |||
| Aspect | + |
Note: Vi, Ci, Hi, Si, and Ti are the constitutive factors of VBI, CBI, HBI, SBI and TBI, respectively; Vi-low, Ci-low, Hi-low, Si-low, and Ti-low are the lowest values of Vi, Ci, Hi, Si, and Ti, respectively; i is the constitutive factor; n is the total number of constitutive factors. ''+'' means the positive normalization, and ''-'' means the negative normalization. NDVI, normalized difference vegetation index. |
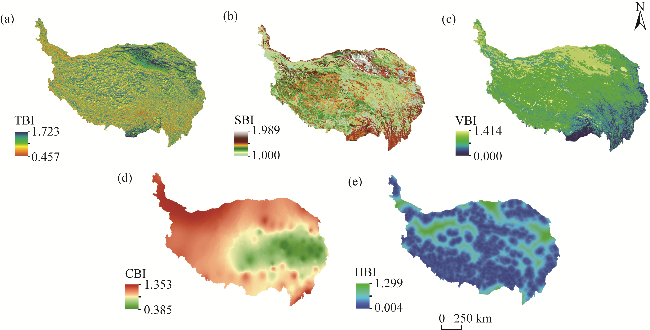
Fig. 1 Spatial distributions of the five background indices on the Qinghai-Xizang Plateau in 2020. (a), TBI (topographic background index); (b), SBI, (soil background index); (c), VBI (vegetation background index); (d), CBI (climatic background index); (e), HBI (hydrological background index). The abbreviations are the same in the following figures. |
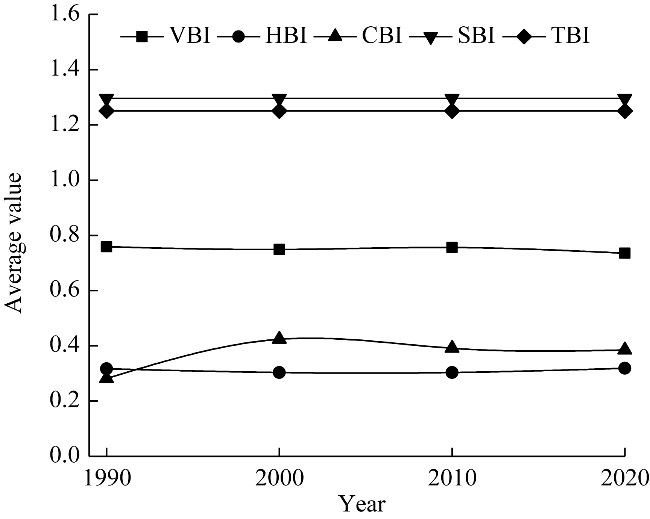
Fig. 2 Average values of the five background indices from 1990 to 2020. High values of the background index indicate poor quality. |
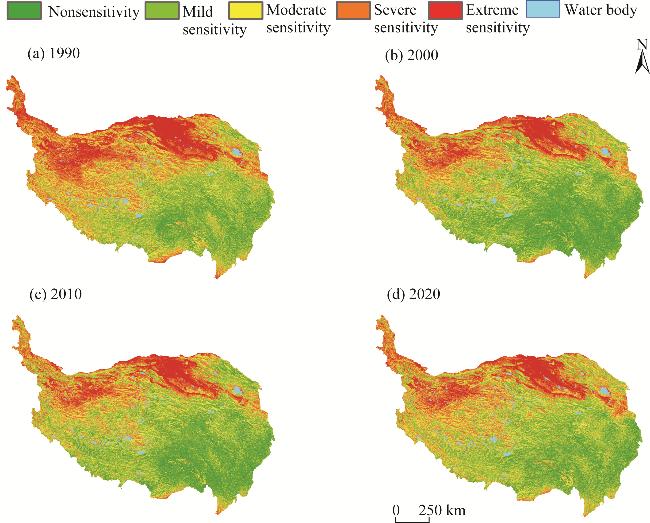
Fig. 3 Spatial distribution of desertification sensitivity index (DSI) on the Qinghai-Xizang Plateau from 1990 to 2020. (a), 1990; (b), 2000; (c), 2010; (d), 2020. |
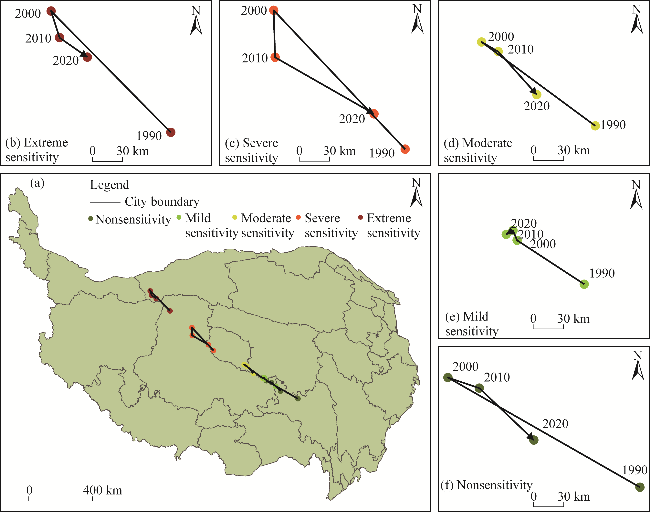
Fig. 4 Gravity center distribution of desertification sensitivity on the Qinghai-Xizang Plateau from 1990 to 2020. (a), overall distribution of desertification sensitivity; (b), extreme sensitivity; (c), severe sensitivity; (d), moderate sensitivity; (e), mild sensitivity; (f), nonsensitivity. The map is provided by the National Tibetan Plateau Data Center (http://data.tpdc.ac.cn/) and the boundary of the map is not modified. |
Table 2 Area proportion and dynamic degree of desertification sensitivity on the Qinghai-Xizang Plateau from 1990 to 2020 |
| Desertification sensitivity type | Area proportion (%) | Dynamic degree (%) | |||
|---|---|---|---|---|---|
| 1990 | 2000 | 2010 | 2020 | 1990-2020 | |
| Nonsensitivity | 8.74 | 19.66 | 16.55 | 10.88 | 0.66 |
| Mild sensitivity | 22.91 | 29.88 | 30.42 | 28.24 | 0.63 |
| Moderate sensitivity | 30.35 | 25.50 | 27.36 | 31.26 | 0.10 |
| Severe sensitivity | 24.04 | 16.30 | 17.05 | 20.29 | -0.62 |
| Extreme sensitivity | 13.95 | 8.67 | 8.62 | 9.33 | -1.65 |
Table 3 Transfer probability matrix of desertification sensitivity types on the Qinghai-Xizang Plateau from 1990 to 2020 |
| Desertification sensitivity type | Nonsensitivity | Mild sensitivity | Moderate sensitivity | Severe sensitivity | Extreme sensitivity |
|---|---|---|---|---|---|
| (%) | |||||
| Nonsensitivity | 92.10 | 7.89 | 0.00 | 0.00 | 0.00 |
| Mild sensitivity | 12.28 | 84.18 | 3.54 | 0.00 | 0.00 |
| Moderate sensitivity | 0.05 | 27.11 | 71.32 | 1.51 | 0.00 |
| Severe sensitivity | 0.00 | 0.12 | 36.56 | 63.01 | 0.31 |
| Extreme sensitivity | 0.00 | 0.00 | 0.03 | 33.56 | 66.41 |
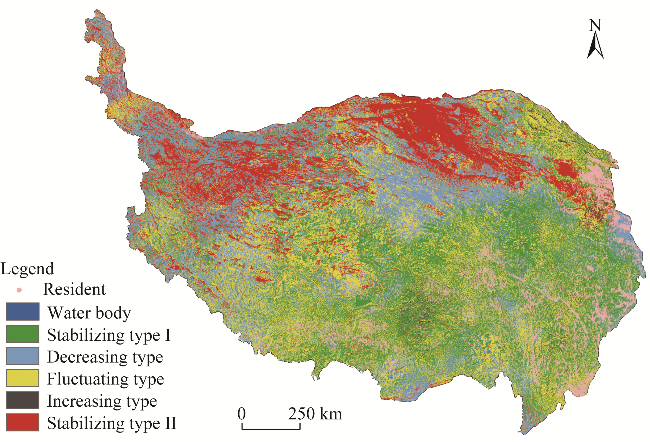
Table 4 Classification of change types in desertification sensitivity |
| Change type | Meaning |
|---|---|
| Stabilizing type I | Sensitivity was perennially non-sensitive, mildly sensitive, and moderately sensitive |
| Decreasing type | Desertification sensitivity continued to decrease |
| Fluctuating type | Sensitivity fluctuated |
| Increasing type | Desertification sensitivity continued to increase |
| Stabilizing type II | Sensitivity was perennially severe and extreme |
Fig. 5 Spatial distribution of change type in desertification sensitivity on the Qinghai-Xizang Plateau |
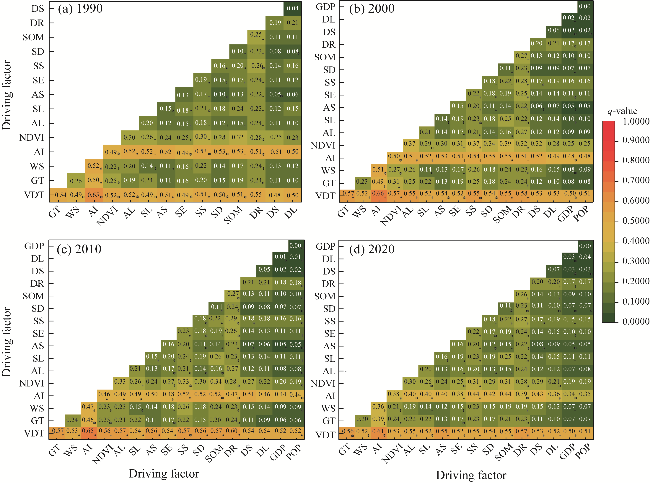
Table 5 q-values of interaction detector |
| Driving factor | 1990 | 2000 | 2010 | 2020 |
|---|---|---|---|---|
| VBI | 0.4680 | 0.5025 | 0.5204 | 0.5036 |
| NDVI | 0.1923 | 0.2497 | 0.1945 | 0.1864 |
| VDT | 0.4672 | 0.5025 | 0.5193 | 0.5036 |
| SBI | 0.1325 | 0.1760 | 0.1760 | 0.1588 |
| SOM | 0.0887 | 0.0993 | 0.0962 | 0.0946 |
| SE | 0.0900 | 0.1073 | 0.1096 | 0.1034 |
| SS | 0.1282 | 0.1596 | 0.1593 | 0.1519 |
| SD | 0.0602 | 0.0710 | 0.0962 | 0.0726 |
| TBI | 0.1022 | 0.1033 | 0.1073 | 0.1163 |
| AL | 0.0736 | 0.0883 | 0.0822 | 0.0735 |
| SL | 0.1089 | 0.0984 | 0.1087 | 0.1083 |
| AS | 0.0411 | 0.0452 | 0.0464 | 0.0543 |
| CBI | 0.4704 | 0.4271 | 0.3843 | 0.2599 |
| AI | 0.4733 | 0.4755 | 0.4430 | 0.3436 |
| WS | 0.0719 | 0.0832 | 0.0900 | 0.0663 |
| GT | 0.0648 | 0.0817 | 0.0616 | 0.0676 |
| HBI | 0.1361 | 0.1644 | 0.1620 | 0.1633 |
| DS | 0.0097 | 0.0175 | 0.0199 | 0.0257 |
| DR | 0.1752 | 0.1714 | 0.1787 | 0.1664 |
| DL | 0.0202 | 0.0171 | 0.0137 | 0.0340 |
| GDP | - | 0.0002 | 0.0000 | 0.0002 |
| POP | - | 0.0005 | 0.0000 | 0.0005 |
Note: VDT, vegetation drought tolerance; SOM, soil organic matter; SE, soil erosion intensity; SS, soil sand; SD, soil depth; AL, altitude; SL, slope; AS, aspect; AI, aridity index; WS, wind speed; GT, annual average ground temperature; DS, distance to glaciers; DR, distance to rivers; DL, distance to lakes and reservoirs; GDP, gross domestic product; POP, population density. ''-'' means no value. The abbreviations are the same in the following figure. |
Fig. 6 Results of the interaction detector on the Qinghai-Xizang Plateau from 1990 to 2020. (a), 1990; (b), 2000; (c), 2010; (d), 2020. * is two-factor enhanced and the rest are nonlinear enhanced. |
| [1] |
|
| [2] |
|
| [3] |
|
| [4] |
|
| [5] |
|
| [6] |
|
| [7] |
|
| [8] |
|
| [9] |
|
| [10] |
|
| [11] |
|
| [12] |
|
| [13] |
|
| [14] |
|
| [15] |
|
| [16] |
|
| [17] |
|
| [18] |
|
| [19] |
|
| [20] |
|
| [21] |
|
| [22] |
|
| [23] |
|
| [24] |
|
| [25] |
|
| [26] |
|
| [27] |
|
| [28] |
|
| [29] |
|
| [30] |
|
| [31] |
|
| [32] |
|
| [33] |
|
| [34] |
|
| [35] |
|
| [36] |
|
| [37] |
|
| [38] |
|
| [39] |
UNCCD (United Nations Convention to Combat Desertification). 1994. Intergovernmental Negotiating Committee for a Convention to Combat Desertification, Elaboration of an International Convention to Combat Desertification in Countries Experiencing Serious Drought and/or Desertification, Particularly in Africa. New York: United Nations.
|
| [40] |
|
| [41] |
|
| [42] |
|
| [43] |
|
| [44] |
|
| [45] |
|
| [46] |
|
| [47] |
|
| [48] |
|
| [49] |
|
| [50] |
|
| [51] |
|
| [52] |
|
| [53] |
|
/
| 〈 |
|
〉 |