• LI Junhao 1, 2 ,
  • WANG Ya , 1, * ,
  • SHI Gui 2, 3 ,
  • PEI Xiaodong 2, 3 ,
  • ZHANG Cong 2, 3 ,
  • ZHOU Lihua 2, 3 ,
  • YANG Guojing 1
展开

收稿日期: 2024-07-17

  修回日期: 2024-11-20

  录用日期: 2024-11-25

  网络出版日期: 2025-08-13

Ecological security pattern construction using landscape ecological quality: A case study of Yanchi County, northern China

  • LI Junhao 1, 2 ,
  • WANG Ya , 1, * ,
  • SHI Gui 2, 3 ,
  • PEI Xiaodong 2, 3 ,
  • ZHANG Cong 2, 3 ,
  • ZHOU Lihua 2, 3 ,
  • YANG Guojing 1
Expand
  • 1Key Laboratory of Ecological Safety and Sustainable Development in Arid Lands, Northwest Institute of Eco-Environment and Resources, Chinese Academy of Sciences, Lanzhou 730000, China
  • 2University of Chinese Academy of Sciences, Beijing 100049, China
  • 3Institutes of Science and Development, Chinese Academy of Sciences, Beijing 100190, China
*WANG Ya (E-mail: )

Received date: 2024-07-17

  Revised date: 2024-11-20

  Accepted date: 2024-11-25

  Online published: 2025-08-13

本文引用格式

LI Junhao , WANG Ya , SHI Gui , PEI Xiaodong , ZHANG Cong , ZHOU Lihua , YANG Guojing . [J]. Journal of Arid Land, 2025 , 17(1) : 19 -42 . DOI: 10.1007/s40333-025-0093-8

Abstract

Ecological security patterns are paramount to the advancement of an ecological civilization in China, aiming to enhance the stability and service functions of ecosystems to achieve sustainable regional development. However, current regional ecological protection efforts have not been effectively integrated into the regional development planning of ecological security pattern. This study systematically assessed the effectiveness of ecological protection projects in Yanchi County, Ningxia Hui Autonomous Region, China, through the evaluation of landscape ecological quality. Based on the evaluation results of landscape ecological quality, this study used morphological pattern analysis (MSPA), minimum cumulative resistance (MCR) model, and gravity model together to construct the ecological security pattern of Yanchi County. The findings revealed that from 1990 to 2020, with the implementation of ecological protection projects started from 2000, the landscape stability of Yanchi County first decreased and then increased, and the intensity of landscape disturbance first intensified but then decreased, indicating an improvement in the landscape ecological quality and a significant enhancement of the ecological environment in Yanchi County. The ecological security pattern of Yanchi County consisted of 10 ecological sources, 10 ecological source points, 23 ecological corridors, and 27 ecological nodes. The ecological security pattern of Yanchi County exhibited distinct spatial variations, with stronger ecological security observed in the southern part than in northern part of the county. The ecological sources were denser in the southern part than in the northern part of the county, and accordingly, the length of ecological corridors was shorter and denser in the southern than that in the northern part of the county. Based on the spatial distribution of landscape ecological quality and the characteristics of ecological security pattern of Yanchi County in 2020, we suggested Yanchi County to build four zones to optimize the ecological security pattern construction: the Haba Lake ecological conservation zone, the urban ecological planning zone, the ecological environment restoration zone, and the ecological security improvement zone. This study can provide essential guidance for the construction of ecological security pattern in farming-pastoral areas both in China and worldwide.

1 Introduction

The restoration and protection of the ecological environment are fundamental issues critical to the survival and development of humanity and therefore, have long been priorities for nations across the globe. For example, the United State Park System and the European Union Nature Reserve Network are prominent initiatives dedicated to ecological conservation (Liu et al., 2015). In recent decades, China has systematically implemented a series of ecological protection and construction initiatives within its territory. Prominent initiatives such as the Three-North Shelter Forest Program and the Reforestation Project, play a critical role in advancing ecological preservation efforts (Jia et al., 2014). Moreover, with the implementation of 'Transforming our World: The 2030 Agenda for Sustainable Development' advocated by the United Nations, which includes 17 sustainable development goals as its core, China has explicitly endorsed the 'ecological security pattern' as the primary theoretical foundation guiding the establishment of an ecological civilization. The ecological security pattern seeks to improve the quality and stability of ecosystem through the creation of ecological corridors and biodiversity conservation networks.
Landscape ecology stands as a distinctive science that is dedicated to assessing ecosystem functions to elucidate the intricate dynamics of ecosystem through comprehensive analyses of landscape structures and functions. It serves as a principal ecological theory for investigating ecological security pattern (Aragón et al., 2011; Mandal and Chatterjee, 2021). The landscape ecological quality reflects the ability of an ecosystem to maintain its own structural and functional stability, as well as resistance to external disturbances (Ye et al., 2018), and it can serve as an alternative indicator of ecological quality. Scholars frequently evaluate the landscape ecological quality in ecologically sensitive and vulnerable areas and ecological restoration engineering areas from the perspectives of stability and disturbance. For example, scholars have explored the evolution of regional ecological environments by assessing the landscape ecological quality of various areas such as agricultural landscapes (Luo and Li, 2021), urban fringe areas (Ren et al., 2016), coal mining areas (Xu et al., 2019), and desert grasslands (Gao et al., 2019). However, there remains a dearth of research on the determinants of ecological quality in small and medium scale landscapes, along with limited studies on spatial planning strategies for national lands. This gap diminishes the relevance and comprehensiveness of current research.
Ecological security pattern represents the spatial distribution of potential ecosystem within regional landscapes and plays a paramount role in maintaining or controlling specific ecological processes in designated areas (Benedict and McMahon, 2002; Cunha and Magalhães, 2019). Early research on ecological security pattern abroad focused mainly on biodiversity conservation and the spatial pattern and evolution of landscape. In contrast, contemporary studies on ecological security pattern are increasingly considering the coupled synergistic effects among society, economy, and nature (Blaikie et al., 2008). These studies emphasize a macro perspective, focus on national security, sustainable development, and globalization processes, and incorporate issues such as population, resources, and environment into national security governance (Yi et al., 2022). The study of ecological security pattern began in China in the 1990s. In recent years, ecological security pattern has increasingly become a research hotspot in the fields of ecological security application and management. In general, numerous scholars at home and abroad have studied the ecological security pattern, mainly concentrated on landscape pattern optimization (Montis et al., 2016; Zeng et al., 2024), green infrastructure (Benedict and McMahon, 2002), landscape connectivity (Field and Parrott, 2017; Xu et al., 2024), land use structure (Li et al., 2023), ecosystem sensitivity (Yang et al., 2024), and ecosystem services (Liquete et al., 2015; Qian et al., 2023). For the ecological security research in China, coastal areas and the ecologically fragile areas in Northwest China have been the primary focus. Studies on coastal areas are related mainly to land use change, pollution, and habitat loss due to urbanization, aiming to protect coastal ecosystems and their connectivity and enhance their capacity to withstand marine disasters (Qian et al., 2023; Guo et al., 2024). For example, Qian et al. (2023) constructed the ecological security pattern for Qingdao City, Shandong Province, China on the basis of land use, aiming to alleviate the contradiction between ecological security and economic development in this coastal city. Similarly, Xue et al. (2024) focused on the Yangtze River Delta, using ecosystem service supply and benefits to develop ecological security pattern, thereby addressing ecological challenges and ensuring sustainable economic growth in this region. In contrast, due to the fragility of ecosystems in Northwest China, research on ecological security pattern in this region has primarily focused more attention on ecological restoration and conservation. These studies aim to address severe ecological degradation caused by human disturbances, with objectives such as preventing further ecosystem deterioration and loss while providing targeted strategies for environmental protection (Yang et al., 2023; Zeng et al., 2024). Li et al. (2023) developed the ecological security pattern in the Hexi regions through an ecosystem service assessment, focusing on identifying ecological restoration priorities and strategies to improve ecosystem resilience. Zeng et al. (2024) conducted a landscape ecological risk analysis to construct the ecological security pattern for the alpine wetland grasslands in Ruoergai County, Sichuan Province, China, emphasizing measures to mitigate ecological risks and enhance environmental stability. In summary, research on the ecological security pattern in China not only commits to enhancing the stability and functionality of ecosystem but also places greater emphasis on practical applications within China's unique social and economic context, thereby striving for long-term sustainable development of ecological environment.
With the continuous development and application of new technologies such as 3S (remote sensing, geographic information systems, and global positioning systems), the methods for constructing ecological security pattern have become increasingly diverse, streamlined, and precise (Yang et al., 2021). Currently, the research framework of "source identification-resistance surface construction-corridor extraction" represents a typical paradigm for constructing ecological security pattern (Yang et al., 2023). Ecological network, i.e., ecological security pattern, constructed on the basis of this framework provides channels for species diffusion, migration, and exchange between habitat patches (Zhang et al., 2022a). Ecological sources refer to key areas that provide habitat and ecological services for species (Zeng et al., 2024). Previous studies have employed two primary methodologies for the selection of ecological sources. The first approach focuses on identifying ecological lands characterized by relatively stable ecosystem structures, including nature reserves (Gao et al., 2019), wetland parks (Yin et al., 2011), and large forested grasslands (Zhao et al., 2019). The second approach involves identifying ecological sources based on composite indices, such as ecological quality (Zhang et al., 2021), ecological service function value (Tang et al., 2021), ecological sensitivity (Tang et al., 2018), and ecological risk (Xu et al., 2021). Nevertheless, the reliance on these indices introduces subjective, which may lead to the omission of critical habitat patches. A more scientific method for identifying ecological sources within landscapes is morphological spatial pattern analysis (MSPA), which can quantitatively measure landscape structure and connectivity (Miao et al., 2019; Xiao et al., 2020). Therefore, this study used MSPA to identify ecological sources in Yanchi County. Ecological resistance surface represents barriers to species diffusion in landscapes, reflecting the "costs" or difficulties of species migration in heterogeneous landscapes (Ye et al., 2015). The spatial heterogeneity of resistance surfaces reflect ecological gradients and anthropogenic impacts, making it an indispensable tool for modelling ecological connectivity, identifying ecological corridors, and planning biodiversity conservation (Bai et al., 2022; Lai et al., 2024). Ecological corridors are pathways that connect ecological sources, facilitating species migration and gene flow (Li et al., 2023). The extraction of ecological corridors frequently utilizes methodologies such as minimum cumulative resistance (MCR) model (Tang et al., 2021) and circuit model (Ni et al., 2019). The MCR model offers the advantages of requiring low data volumes and providing explicit images (Zhang et al., 2021). By integrating landscape connectivity analysis with gravity model, map theory, and other methodologies, has become widely employed in the identification of ecological corridors (Zetterberg et al., 2010; Miao et al., 2019). Therefore, in this study, we used MCR model and gravity model to extract ecological corridors.
Yanchi County is located in the typical farming-pastoral area of northern China. Before the implementation of environmental policies, the ecological environment of this county was severely affected by both natural factors and human activities, resulting in grassland degradation, desertification, and a fragile ecological environment (Wang et al., 2019). After 2000, China gradually implemented the projects of natural forest protection and grazing prohibition (Wang et al., 2019). Additionally, the grassland ecological protection subsidy incentive mechanism was established, along with the designation of a national nature reserve at Haba Lake (Hou et al., 2018). Consequently, Yanchi County became one of the first areas in China to reverse desertification and achieve ecological environment improvement. To consolidate the achievement of ecological protection, the regulation and control of environmental policies should be optimized, sustainable ecological guidelines should be ensured, and ecological, social, and economic benefits should be coordinated.
This study used MSPA, MCR model, and gravity model to construct ecological security pattern of Yanchi County based on the assessment of landscape ecological quality. The aims of this study are as follows: (1) to evaluate the landscape ecological quality of Yanchi County; (2) to identify key ecological sources, corridors, and nodes, and then to build the ecological security pattern of Yanchi County in 2020; and (3) to propose optimization plans and policy recommendations based on the constructed ecological security pattern. This study provides new insights into evaluating the effectiveness of ecological conservation and environmental engineering projects by analyzing the temporal and spatial evolution of landscape ecological quality and constructs an ecological security pattern with planning recommendations for regional ecological protection and restoration. These recommendations enrich regional planning research and provide ecological planning references for countries and regions that are facing challenges related to ecological degradation.

2 Materials

2.1 Study area

Yanchi County (37°04′-38°10′N, 106°30′-107°47′E) is located in the eastern part of Ningxia Hui Autonomous Region, China. It encompasses 101 administrative villages across 8 townships, covering a total area of approximately 8522.20 km2. Situated in the middle reaches of Yellow River, Yanchi County serves as an ecological protection barrier and an area with critical ecological function at the national level (Wang and Zhou, 2016; Wei et al., 2020). The county's elevation varies from 1295 to 1951 m and is characterized by topography that is relatively higher in the southern part and relatively lower in the northern part of the county (Fig. 1). The climate is characterized by a typical continental monsoon climate, with an average annual temperature of 7.80°C. The annual precipitation ranges from 250.00 to 350.00 mm, while the average annual evaporation is 6-7 times greater than the average annual precipitation. The county is characterized by persistent drought conditions, low rainfall, high evaporation rates, strong winds, and sandstorms (Wang et al., 2019; Wang et al., 2021a). Before the implementation of ecological engineering, owing to deforestation, overgrazing, and poor grassland management, the desertification area reached 52.00% of the total land area of Yanchi County, rendering it one of most severely desertified areas in China (Wang et al., 2021a). In the past decade, extensive environmental protection measures have been instituted, leading to improvements in the ecological environment and a reversal of desertification trends (Wang et al., 2019). Nonetheless, Yanchi County continues to face ecological and environmental challenges, including regional land degradation and vegetation loss, which pose serious threats to ecosystem (Wang et al., 2019). The construction of ecological security pattern, the integration of natural environmental resources within county, and the optimization of spatial layout play significant roles in enhancing the function of natural ecosystem and promoting the sustainable development of Yanchi County.
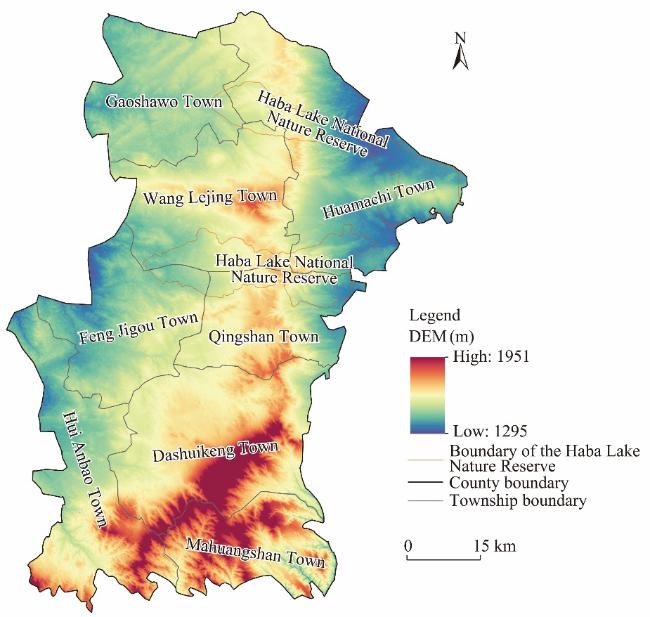
Fig. 1 Overview of terrain in Yanchi County. DEM, digital elevation model.

2.2 Data sources and processing

In this study, we obtained land use data from Resource and Environmental Science Data Center, Chinese Academy of Sciences (https://www.resdc.cn/), with a spatial resolution of 30 m, which can be reclassified into six categories: cultivated land, forest land, grassland, water body, construction land, and unused land using ArcGIS v.10.7 software (ESRI, Redlands, California, USA). The digital elevation model (DEM) data with a spatial resolution of 30 m were obtained from the Geospatial Data Cloud (https://www.gscloud.cn/) and served as an important indicator for creating ecological resistance surface in this study (Table 1).
Table 1 Detailed description of data used in the study
Data type Resolution Year Data source Reference
Land use type 30 m 1990, 2000, 2010, and 2020 Resource and Environmental Science Data Center, Chinese Academy of Sciences (https://www.resdc.cn/) Luo and Li (2021)
DEM 30 m 2020 Geospatial Data Cloud (https://www.gscloud.cn/) Yang et al. (2023)
Landsat TM 30 m 1990, 2000, and 2010 United States Geological Survey
(https://earthexplorer.usgs.gov/)
Yang et al. (2024)
Landsat 8 OLI 30 m 2020 United States Geological Survey
(https://earthexplorer.usgs.gov/)
Su et al. (2017)
County boundary - 2020 Resource and Environmental Science Data Center, Chinese Academy of Sciences (https://www.resdc.cn/) Wang et al. (2019)
Township boundary - 2015 Resource and Environmental Science Data Center, Chinese Academy of Sciences (https://www.resdc.cn/) Wei et al. (2020)
Administrative village boundary - 2013 Resource and Environmental Science Data Center, Chinese Academy of Sciences (https://www.resdc.cn/) Xu et al. (2019)
Distance to residential area 30 m 2020 National Geographic Information Resource Directory Service (https://www.webmap.cn/) Yang et al. (2021) and Li et al. (2022)
Distance to tertiary road 30 m 2020 National Geographic Information Resource Directory Service (https://www.webmap.cn/) Li et al. (2022)
Distance to ordinary railway 30 m 2020 National Geographic Information Resource Directory Service (https://www.webmap.cn/) Yin et al. (2011)

Note: "-" means no resolution. DEM, digital elevation model.

This study used normalized difference vegetation index (NDVI) to reflect vegetation coverage (Yang et al., 2024). To obtain the NDVI data in the vegetation growth season (May-September) of Yanchi County from 1990 to 2020, we obtained remote sensing images from Landsat TM and Landsat 8 OLI with a spatial resolution of 30 m and cloud cover less than 10.00%. Landsat TM satellite remote sensing data included information on vegetation cover of Yanchi County in 1990, 2000, and 2010, whereas the Landsat 8 OLI remote sensing image data exhibited the vegetation cover situation in 2020 due to the cessation of Landsat TM updates after 2013.
In this study, we used county boundary, township boundary, administrative village boundary, distance to residential area, distance to tertiary road, and distance to ordinary railway as socio-economic factors to ecological security. We used the Euclidean distance tool in ArcGIS v.10.7 software to construct ecological resistance surface by using the raster data exported with a spatial resolution of 30 m for the distance to residential area, distance to tertiary road, and distance to ordinary railway factors.

3 Methods

This study assessed the landscape ecological quality of Yanchi County, constructed an ecological security pattern (i.e., ecological network), and proposed optimization suggestions for the ecological security pattern. The specific framework showed that the process of this study can be divided into four steps: data collection, establishment of landscape ecological quality assessment system, ecological security pattern construction, and optimization of the ecological security pattern (Fig. 2).
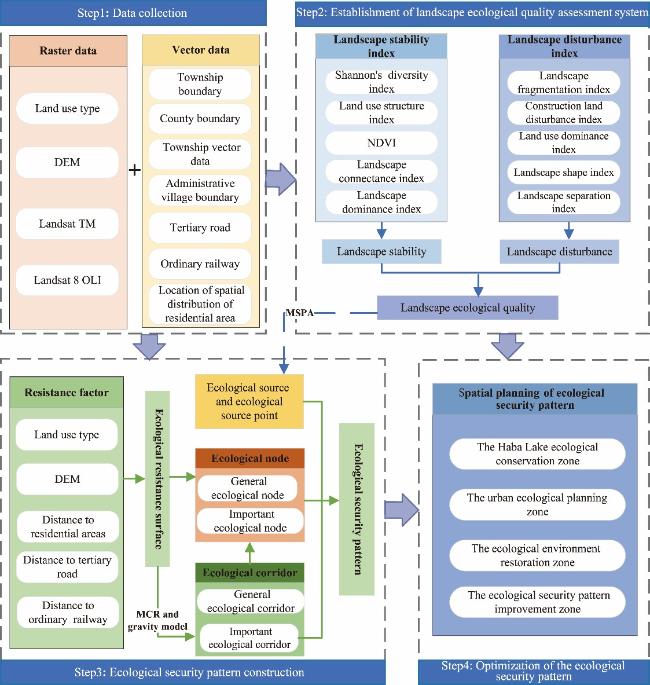
Fig. 2 Research framework of this study. NDVI, normalized difference vegetation index; MSPA, morphological spatial pattern analysis; MCR, minimum cumulative resistance.

3.1 Establishment of landscape ecological quality assessment model

3.1.1 Indicator selection and processing

The landscape ecological quality serves as an effective indicator reflecting the degree of ecosystem stability at landscape scale, which varies depending on ecological stability and external disturbance (Penteado, 2013). To construct a landscape ecological quality evaluation index system, we identified ten indictors from dimensions of landscape stability and disturbance (Ren et al., 2016; Xu et al., 2019; Luo and Li, 2021).
To comprehensively assess the landscape stability from multiple dimensions, including landscape structures, functions, and ecological processes, we selected key indicators, including Shannon's diversity index, land use structure index, NDVI, landscape connectivity index, and landscape dominance index (Table 2). Shannon's diversity index serves as an indirect measure of land use types and their complexity by quantifying the diversity and distribution patterns of land use within a given region (Qiao et al., 2023). Land use structure index reveals the proportions and spatial configurations of different land use types within landscape, which is directly related to landscape stability (Ren et al., 2016). Landscape connectivity index reflects the flow of materials and energy between different landscape patches (Xu et al., 2024). Large amounts of vegetation cover and strong connectivity contribute to enhancing the overall ecological stability of landscape. Landscape dominance index reflects the influence of dominant patches on the overall stability of landscape (Li et al., 2020).
Table 2 List of indicators used to establish landscape ecological quality assessment system
Dimension Indicator Subjective weight Objective weight Combined weight
Landscape stability Shannon's diversity index 0.25 0.20 0.22
Land use structure index 0.24 0.16 0.20
Normalized difference vegetation index (NDVI) 0.34 0.26 0.30
Landscape connectivity index 0.10 0.18 0.14
Landscape dominance index 0.07 0.21 0.14
Landscape disturbance Landscape fragmentation index 0.27 0.23 0.25
Construction land disturbance index 0.16 0.27 0.22
Land use dominance index 0.20 0.28 0.24
Landscape shape index 0.16 0.14 0.15
Landscape separation index 0.20 0.08 0.14
We subsequently considered the impacts of changes in landscape structures and human disturbances on ecological quality and selected five key indicators for evaluating landscape disturbance: landscape fragmentation index, construction land disturbance index, land use dominance index, landscape shape index, and landscape separation index. Landscape fragmentation index quantifies the division and isolation of patches; high fragmentation leads to ecosystem degradation (Su et al., 2017). Construction land disturbance index directly reflects the impact of human development on landscape, particularly the effects of urban expansion on ecosystem stability (Ren et al., 2016). Land use dominance index measures the degree of disturbance to dominant land use types; and the higher the level of disturbance to the dominant land use types, the weaker the overall resilience of the landscape (Gao et al., 2019). Landscape shape index assesses the complexity of patch boundaries; the patches with more complex shapes are more susceptible to disturbance (Xiao et al., 2022). Landscape separation index measures the degree of isolation among patches, and greater separation results in weaker ecosystem connectivity and resilience, indicating greater landscape disturbance (Gao et al., 2019; Xiao et al., 2022).
Then we used Fragstat v.4.2 software (McGarigal, Amherst, Massachusetts, USA) to calculate Shannon's diversity index, landscape connectivity index, landscape fragmentation index, landscape shape index, and landscape separation index based on reclassified land use data. And we utilized ArcGIS software to calculate land use structure index, landscape dominance index, construction land disturbance index, and land use dominance index by using the administrative village as the evaluation unit. Then, ordinary Kriging spatial interpolation was applied to spatially interpolate these indices (Xu et al., 2019; Li et al., 2020).
Since each indicator possesses different properties and scales, we applied extreme-range method to convert each indicator into a dimensionless number, making them comparable and ensuring the accuracy of results (Gao et al., 2019; Ma et al., 2020). The analytic hierarchy process (AHP) and entropy weight method were subsequently used to determine the subjective and objective weights of each index, respectively. The subjective and objective weights were each multiplied by 0.50 and then summed to derive the combined weight (Ma et al., 2020). The weights for each indicator are detailed in Table 2.

3.1.2 Evaluation of landscape ecological quality

In accordance with the definition of landscape ecological quality, the landscape stability (LSI), landscape disturbance (LDI), and overall landscape ecological quality (LEQ) were assessed using a multifactorial integrated evaluation approach (Ren et al., 2016).
$\text{LSI}=\sum\limits_{s=1}^{5}{{{w}_{s}}\times }{{r}_{s}}$,
$\text{LDI}=\sum\limits_{d=1}^{5}{{{w}_{d}}\times }{{r}_{d}}$,
$\text{LEQ}=\frac{\text{LSI}}{\text{LDI}}$,
where s and d are the sth and dth indicators of landscape stability and disturbance, respectively; ws is the combined weight of sth indicator of landscape stability; wd is the combined weight of dth indicator of landscape disturbance; rs is the value of sth indicator of landscape stability after standardization; and rd is the value of dth indicator of landscape disturbance after standardization.
After calculating the values of landscape stability, disturbance, and ecological quality of Yanchi County in 1990, 2000, 2010, and 2020, we categorized the value of landscape stability into five levels by natural break method: unstable (LSI<0.37), mildly stable (0.37≤LSI<0.44), moderately stable (0.44≤LSI<0.52), highly stable (0.52≤LSI<0.61), and extremely stable (LSI≥0.61). We also utilized natural break method to classify landscape disturbance into five levels: extremely mild disturbance (LDI<0.25), mild disturbance (0.25≤LDI<0.32), moderate disturbance (0.32≤LDI<0.40), severe disturbance (0.40≤LDI<0.49), and extremely severe disturbance (LDI≥0.49). Referring to Ren et al. (2016) and Xu et al. (2019), we classified the value of landscape ecological quality into five grades: poor (LEQ<0.50), fair (0.50≤LEQ<1.00), moderate (1.00≤LEQ<1.50), good (1.50≤LEQ<2.00), and excellent (LEQ≥2.00).

3.2 Construction of ecological security pattern

3.2.1 Identification of ecological source and ecological source point

Ecological sources facilitate material and energy exchanges between species and their surrounding environment, serving as a crucial foundation for constructing ecological networks. In this study, MSPA was employed to delineate the structures and types of ecological landscapes, as well as to identify ecological patches that are essential for regional connectivity. This methodology enables the scientific and objective selection of ecological sources (Tang et al., 2021; Zhang et al., 2022b). First, we established the foreground and background on the basis of the evaluations of the landscape ecological quality of Yanchi County in 2020. Subsequently, we utilized the Guidos Toolbox v.2.8 (Joint Research Centre, Ispra, Italy) to adjust the edge width to 1 m, following to the default setting, and to set the edge effect threshold at 30 m. Through MSPA analysis of raster binary data, following the eight-neighbourhood rule (Wei et al., 2022), seven distinct landscape patch types were identified, with no overlap, including core, islet, perforation, edge, bridge, branch, and loop. The core patches are crucial for maintaining landscape connectivity and ecological stability through their interactions with other landscape patch types. By connecting with bridge and branch patches, the core patches enhance the landscape's ecological function and help reduce the isolation effects of islet and perforation patches (Miao et al., 2019; Xiao et al., 2020).
To ascertain the requisite ecological sources of Yanchi County in 2020, we selected 30 core patches with large area. In the Conefor v.2.6 software (Universidad Politécnica de Madrid, Madrid, Spain), the connectivity distance threshold and connectivity probability were set to 2500.00 m and 50.00%, respectively. Then, representative landscape index values, including possible connectivity index (PCI) and patch importance index (PII), were computed to assess the degree of connectivity between core patches (Miao et al., 2019; Xu et al., 2021). A higher PII value indicates a higher connectivity between core patches and a more stable ecosystem within ecological sources (Xiao et al., 2020). Finally, we selected core patches with a PII value >2.00 and an area greater than 10.00 km2 as ecological sources (Table S1).
$\text{PCI}=\frac{\sum\limits_{i=1}^{n}{\sum\limits_{j=1}^{n}{{{a}_{i}}}\times {{a}_{j}}\times }{{p}_{ij}}}{A}$,
$\text{PII}=\frac{\text{PCI}\text{PC}{{\text{I}}_{\text{remove}}}}{\text{PCI}}$,
where n is the total number of core patches; ai and aj are the areas of core patches i and j, respectively (km2); A is the total area of the study area (km2); pij is the maximum probability of spreading between core patches i and j (%); and PCIremove is the value of PCI of the remaining patches after the removal of a patch.
Ecological source point is the geometric center of ecological source, which is convenient for showing the distance between ecological sources (Li et al., 2022). In this study, we employed ArcGIS v.10.7 software to extract ecological source points.

3.2.2 Construction of ecological resistance surface

The construction of an ecological resistance surface delineates the ease of species migration and spatial movement of species in different landscape units under environmental constraints and necessitates the integration of natural factors and human interference (Zhang et al., 2022b). Therefore, in light of the specific conditions in the study area and data availability, we systematically selected five resistance factors: land use type, DEM, distance to residential area, distance to tertiary road, and distance to ordinary railway (Table 3). Subsequently, this study referred to relevant research and consulted experts to grade and assign weights to each resistance factor (Shi et al., 2018). We classified the resistance factors using equal interval method, except for land use type, and divided each factor into six levels. The entropy weight method was applied to allocate weights to each resistance factor (Zhang et al., 2024). Ultimately, we got the ecological resistance surface by overlaying the weights using ArcGIS v.10.7 software.
Table 3 Weight of each resistance factor
Resistance factor Resistance value Weight
1.00 2.00 3.00 4.00 5.00 6.00
Land use type Forest land Water body Grassland Cultivated land Construction land Unused land 0.17
DEM (m) <1400 1400-1500 1500-1600 1600-1700 1700-1800 >1800 0.43
Distance to residential area (m) >20,000 16,000-20,000 12,000-16,000 8000-12,000 4000-8000 <4000 0.15
Distance to tertiary road (m) >2500 2000-2500 1500-2000 1000-1500 500-1000 <500 0.06
Distance to ordinary railway (m) >35,000 28,000-35,000 21,000-28,000 14,000-21,000 7000-14,000 <7000 0.19

3.2.3 Extraction of ecological corridor

The MCR model is a standard method used for simulating ecological corridors (Miao et al., 2019). In this study, we applied MCR model to compute the least-cost path between ecological source and target location using ecological resistance surface. This approach facilitates the simulation of optimal migration paths for species, thereby identifying all potential ecological corridors (Jia et al., 2017).
$\text{MC}{{\text{R}}_{\text{min}}}={{f}_{\min }}\sum\limits_{b=m'}^{c=m}{D{}_{cb}\times }{{R}_{c}}$,
where MCRmin is the minimum cumulative resistance value from ecological source point b to landscape unit c; Dcb is the spatial distance of a species from point b to target location landscape unit c (m); Rc is the resistance value of landscape unit c to the movement of species; m is the number of basic landscape units; and m' is the number of ecological source points.
The gravity model is a method for analyzing and predicting spatial interactions, allowing for the quantification of the intensity of actions and dependencies among objects in space. It has been utilized to compute the interaction matrix between ecological sources. The stronger the interaction force, the greater the significance of corridors between ecological sources (Zhang et al., 2021). To identify general and important ecological corridors, we applied gravity model to calculate the interaction strengths between ecological sources to assess the relative importance of these potential corridors (Table 4). Following the elimination of redundant corridors that were overlapping or similar, those with interaction strength exceeding 100.00 were categorized as important ecological corridors, whereas those with interaction strength below 100.00 were considered as general ecological corridors (Tang et al., 2018).
The formula for the gravity model is as follows:
${{G}_{\lambda \mu }}=\frac{{{N}_{\lambda }}{{N}_{\mu }}}{D_{\lambda \mu }^{2}}=\frac{\left[ {\ln \left( {{S}_{\lambda }} \right)}/{{{P}_{\lambda }}}\; \right]\left[ {\ln \left( {{S}_{\mu }} \right)}/{{{P}_{\mu }}}\; \right]}{{{\left( {{{L}_{\lambda \mu }}}/{{{L}_{\max }}}\; \right)}^{2}}}=\frac{L_{\max }^{2}\ln \left( {{S}_{\lambda }}{{S}_{\mu }} \right)}{L_{\lambda \mu }^{2}{{P}_{\lambda }}{{P}_{\mu }}}$,
where λ and µ are two different ecological sources; Gλµ is the interaction force between λ and µ; Nλ and Nµ are the corresponding weight values for λ and µ, respectively; Dλµ is the standard resistance value between λ and µ; Pλ and Pµ are the resistance values of λ and µ, respectively; Sλ and Sµ are the areas of λ and µ, respectively (km2); Lλµ is the resistance value of the corridor between λ and µ; and Lmax is the maximum resistance value of all corridors in one ecological security pattern.
Table 4 Interaction intensity between ecological sources
No. of ecological source No. of ecological source
1 2 3 4 5 6 7 8 9 10
1 0.00 100.61 66.41 61.43 19.08 18.99 16.05 11.99 10.56 23.64
2 115.19 47.50 13.79 18.47 11.48 8.44 7.65 16.15
3 164.48 37.05 72.85 27.48 17.34 17.86 32.03
4 83.53 93.24 59.55 35.72 32.55 86.63
5 249.04 1239.78 166.94 323.61 212.03
6 118.16 46.85 78.06 69.05
7 383.43 653.34 234.71
8 198.89 302.52
9 93.22
10 0.00

3.2.4 Extraction of ecological node

Ecological nodes represent critical points within an ecological network, often referred to as "stepping stones"; these nodes facilitate species movement and contribute to the stability of ecological corridors (Peng et al., 2018). The nodes form at the intersections of the least-cost path on the ecological resistance surface or at the crossing points of the maximum and minimum-cost paths. Therefore, this study considered the intersections of ecological corridors as ecological nodes (Yi et al., 2022). Additionally, using hydrological analysis tool in ArcGIS software, this study precisely identified the ridge lines of the ecological resistance surface in Yanchi County (i.e., the maximum-cost path of cumulative resistance value) and the intersections of these ridge lines within ecological corridors as ecological nodes. Ecological nodes influence the ecological connectivity between different ecological sources (Yang et al., 2024). In this study, we categorized ecological nodes into general and important ones. Nodes located on important ecological corridors and the intersections between important ecological corridors were defined as important ecological nodes, while nodes located on general ecological corridors and the intersections between general ecological corridors were classified as general ecological nodes (Tang et al., 2018). General ecological nodes within ecological corridors are more susceptible to disturbance than important ecological nodes.

4 Results

4.1 Spatial and temporal variations in landscape ecological quality

4.1.1 Spatial and temporal variations in landscape stability

The landscape stability in Yanchi County tended to weaken and then strengthen from 1990 to 2020 (Fig. 3). In 1990, the landscape in Yanchi County was primarily dominated by mildly and moderately stable areas. The unstable and extremely stable areas, on the other hand, were smaller in size and were generally distributed in east-west direction. The results indicated that the landscape stability of Yanchi County was not very stable and showed obvious regional differences. From 1990 to 2000, the areas of moderately, highly, and extremely stable levels all showed decreasing trends. Their reduced areas were mainly transformed into unstable and mildly stable landscapes, indicating a deteriorating trend in ecological environment and a significant decrease in stability. From 2000 to 2010, owing to the gradual implementation of ecological projects such as wind prevention and sand fixation, some cultivated land was transferred to forest land in Yanchi County. The area of moderately stable level increased 39.35%, contributing to an increase in landscape stability. From 2010 to 2020, the variations in the areas at different landscape stability levels were relatively small. However, the areas of moderately, highly, and extremely stable levels showed decreasing trends, indicating a potential weakening of landscape stability in Yanchi County.
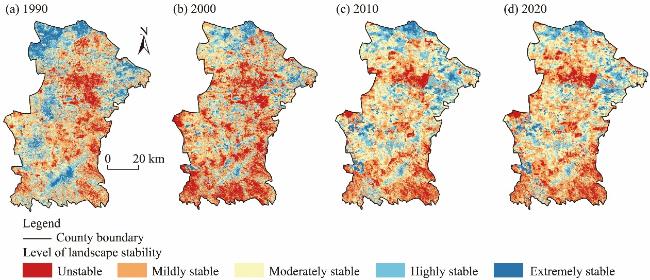
Fig. 3 Spatial distribution of landscape stability in Yanchi County in 1990 (a), 2000 (b), 2010 (c), and 2020 (d)

4.1.2 Spatial and temporal variations in landscape disturbance

The degree of landscape disturbance in Yanchi County exhibited a pattern of initial strengthening followed by a subsequent weakening from 1990 to 2020 (Fig. 4). In 1990, the area of moderate disturbance was 2137.71 km2, followed in descending order by the areas of light, severe, extremely severe, and extremely light disturbance levels. From 1990 to 2000, increased landscape disturbance originated from human activities such as grazing, land reclamation, and firewood collection led to the expansion of areas of moderate, severe, and extremely severe disturbance, intensifying landscape disruption. From 2000 to 2010, with the implementation of measures such as grazing ban, fencing enclosure, and the return of cultivated land to forest land and grassland, some extremely severe disturbance area gradually transitioned to severe disturbance area; but the areas of moderate, light, and extremely light disturbance decreased, showing quite serious disturbance. From 2010 to 2020, the areas of moderate, severe, and extremely severe disturbance all showed decreasing trends, particularly the area of severe disturbance, which decreased by 955.01 km2; while the areas of light and extremely light disturbance increased. This indicated an alleviation and improvement trend in the intensity of landscape disturbance in Yanchi County.
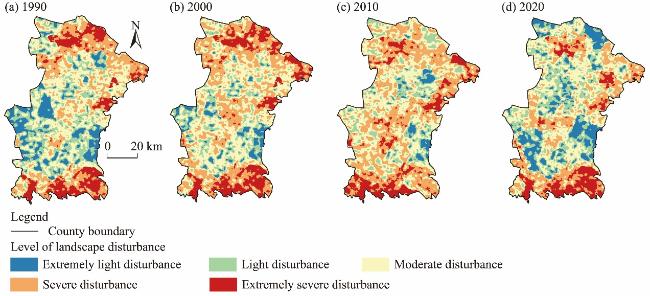
Fig. 4 Spatial distribution of landscape disturbance in Yanchi County in 1990 (a), 2000 (b), 2010 (c), and 2020 (d)

4.1.3 Spatial and temporal characteristics of changes in landscape ecological quality

Yanchi County's landscape ecological quality initially declined but then improved from 1990 to 2020 (Fig. 5). In 1990, the area of moderate grade was the largest, showing an interspersed spatial distribution, which indicated that ecological environment was relatively favorable in 1990. Owing to the increase in human disturbances in Yanchi County, from 1990 to 2000, the areas of good and excellent grades decreased, resulting in a decrease in ecological quality. From 2000 to 2010, the areas of moderate, good, and excellent grades increased. This improvement was attributed to the implementation of ecological projects such as fencing off grazing, returning cultivated land to forest land, and grassland subsidies, which reduced disturbances to ecological environment and enhanced ecosystem stability. From 2010 to 2020, the areas of good and excellent grades increased by 426.38 and 553.37 km2, respectively, indicating that the ecological environment of Yanchi County continuously improved.
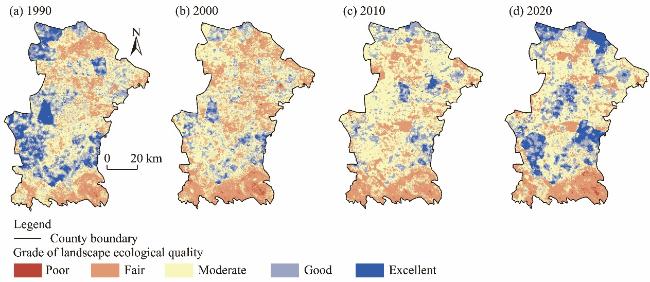
Fig. 5 Spatial distribution of landscape ecological quality in Yanchi County in 1990 (a), 2000 (b), 2010 (c), and 2020 (d)
An analysis of the changes in landscape ecological quality revealed that the area with degraded landscape ecological quality accounted for 41.19% of the entire area of the county from 1990 to 2000 (Fig. 6). The deterioration of these areas was attributed to disturbances caused by human activities, resulting in grassland degradation, land erosion, and overall deterioration of ecological conditions, thereby undermining the ecosystem stability. With the implementation of ecological projects from 2000 to 2010, the impacts of human activities diminished, leading to a slight increase in the areas of moderate and significant improvement and a decrease in the areas of slight and moderate degradation. From 2010 to 2020, the area of improved landscapes exceeded that of degraded landscapes by 74.38%, primarily consisting of slightly and moderately improved landscapes, which were scattered across most parts of the county. These changes indicated significant improvement in ecological environment and a gradual enhancement in ecosystem stability. In conclusion, the ecological environment of Yanchi County improved remarkably from 1990 to 2020. Nevertheless, a considerable number of landscapes that experienced environmental degradation persisted, highlighting the ongoing risk of environmental deterioration. Therefore, it is imperative to establish the ecological security pattern of Yanchi County and conduct territorial space planning to consolidate the achievements of ecological protection and further improve the ecological environment.
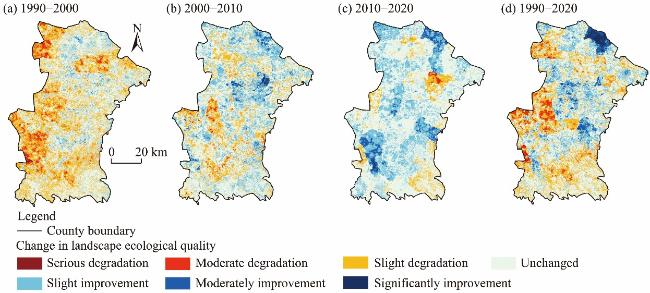
Fig. 6 Spatial distribution of changes in landscape ecological quality in Yanchi County from 1990 to 2020. (a), 1990-2000; (b), 2000-2010; (c), 2010-2020; (d), 1990-2020.

4.2 Ecological security pattern

4.2.1 Spatial distribution of ecological source

On the basis of the landscape ecological quality distribution in Yanchi County in 2020, the areas of good and excellent grades of landscape ecological quality were selected as the foreground, while all the other areas were designated as the background. The results of MSPA indicated that the proportion of core patches was the largest, accounting for 84.78% of the foreground area. These patches exhibited a relatively scattered distribution, high fragmentation, poor stability, and weak resistance to external disturbances (Fig. 7a). Ultimately, ten core patches were identified as ecological sources. As illustrated in Figure 7b, the ecological sources were distributed across the northern, northern-central, and southern-central parts of Yanchi County, and consisted of a total area of 1233.63 km2, accounting for 14.48% of the total area of the county (Table S1).
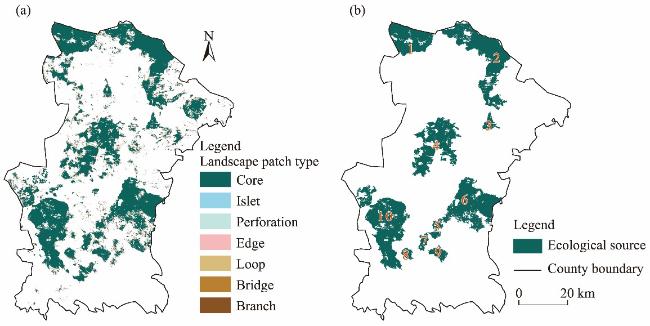
Fig. 7 Distribution of landscape patch type (a) and ecological source (b) in Yanchi County in 2020. The number in Figure 7b is the serial number of ecological source identified by this study.

4.2.2 Spatial distribution of ecological corridor

As shown in Figure 8a, the resistance values were relatively low in the northern part and relatively high in the southern part of the county. Notably, Mahuangshan Town presented high resistance values, largely attributable to high elevation that adversely impacted species survival adaptation and migration. In this study, 61 potential corridors with a total length of 1768.68 km were identified by employing MCR model. After eliminating overlapping or similar redundant corridors, we obtained 23 ecological corridors. A total of 12 important ecological corridors with a combined length of 243.97 km were predominantly distributed in the northern-central and southern parts of the source area. Among these corridors, the northern and central corridors, connected by three corridors linking the ecological sources of No. 1-No. 4, spanned a total length of 119.76 km. These corridors played crucial roles in facilitating the flow of materials and energy between northern and central parts. The southern corridors, characterized by their dense distribution and shorter lengths, were suitable for species migration and energy exchange. Additionally, 11 general ecological corridors, totaling 935.27 km in length, formed an arc-shaped grid distribution zone from south to north, facilitating communication among various ecological sources (Fig. 8b). These corridors presented a more complex and stable structure than the corridors that were identified as important for ecological connectivity.
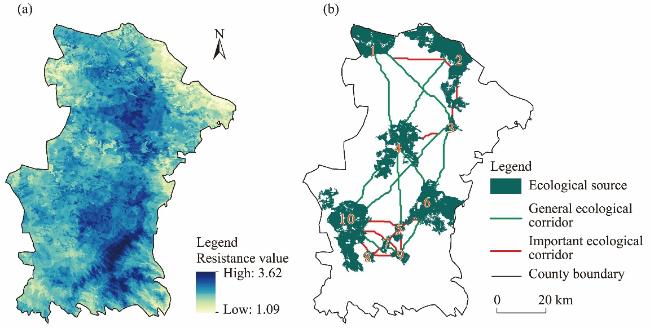
Fig. 8 Distribution of ecological resistance surface (a) and corridor (b) in Yanchi County in 2020. The number is the serial number of ecological source identified by this study.

4.2.3 Spatial distribution of ecological node

This study identified 27 ecological nodes, of which 9 were important ecological nodes and 18 were general ecological nodes. Important ecological nodes are critical for the communication and operation of ecological flows. Their distribution was characterized by a dense concentration in the southern part of the source area and a dispersed distribution in the central and northern parts of the source area. The general ecological nodes were evenly distributed along general ecological corridors, playing an essential role in facilitating communication between the northern and southern ecological sources.

4.2.4 Spatial distribution of ecological security pattern

The ecological security pattern of Yanchi County presented a strip-like network structure of source-corridor-node (Fig. 9). Overall, the dense network in the southern part of the source area was characterized by important ecological corridors and important ecological nodes, indicating robust interconnections among the ecological sources, along with a stable network structure that facilitated the free flow of materials and energy. The northern network was sparser, with fewer ecological sources, corridors, and nodes, making it challenging for independent material, energy, and information exchange in the northern part of the source area. The ecological source of No. 4 in the central part served as the cornerstone for communication between the northern and southern source areas. However, the network structure that facilitated communication between the northern and southern parts of the source area primarily consisted of general ecological corridors and general ecological nodes. This network was susceptible to fragmentation, resulting in landscape fragmentation and increased costs associated with species migration and dispersal, which in turn affected the operation and communication of ecological flows. Additionally, the southern and northeastern parts of Yanchi County lacked ecological sources and exhibited high ecological vulnerability.
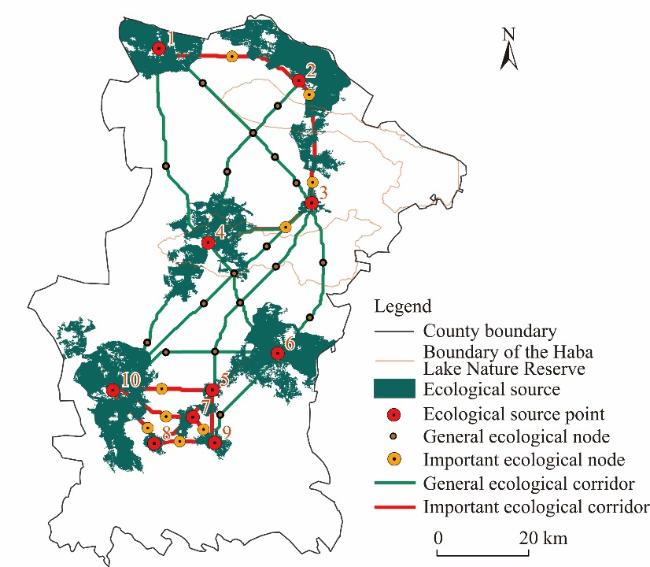
Fig. 9 Ecological security pattern of Yanchi County in 2020. The number is the serial number of ecological source identified by this study.

4.3 Spatial planning of ecological security pattern

The ecological environment of Yanchi County showed a trend of improvement from 1990 to 2020, but some areas still faced the risk of environmental degradation. For example, the southern part of Yanchi County had poor landscape ecological quality, lacked ecological sources and corridors, and had a fragile ecosystem. Therefore, to further improve the ecological environment, optimize the ecological security pattern, and enhance the quality of the living environment, this study considered factors such as the construction of natural ecological protection areas, urban development, landscape ecological quality, and the characteristics of the ecological security pattern of Yanchi County. Based on the spatial characteristics of the ecological network of Yanchi County in 2020, we divided the county into four subzones: the Haba Lake ecological conservation zone, the urban ecological planning zone, the ecological environment restoration zone, and the ecological security improvement zone (Fig. 10).
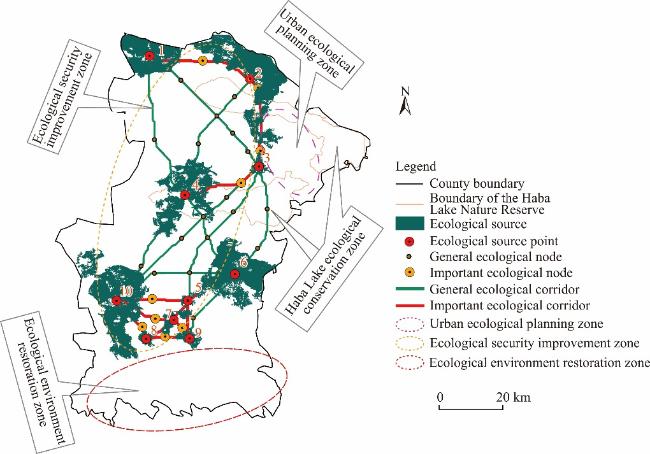
Fig. 10 Spatial planning for ecological security pattern of Yanchi County. The number is the serial number of ecological source identified by this study.
The Haba Lake Nature Reserve was designated as the Haba Lake ecological conservation zone. High ecological resistance within the nature reserve, coupled with the absence of ecological sources and corridors, continued to impede species migration and dispersal. Although large core patches were present, PII value was only 0.61, falling short of the threshold required to designate it as a new ecological source, indicating that the ecosystem remains under considerable threat. Therefore, this area was designated as an ecological conservation zone. The expansion of the landscape's core patches can be achieved by increasing the intensity of artificial afforestation, implementing sand sealing, enforcing grazing bans, and enhancing ecological management. Furthermore, the construction of ecological corridors between core patches and ecological sources of No. 2, 3, and 4 was advised to improve the channels for material and information exchange (Fig. 7a). The construction of these corridors would facilitate the connectivity between habitat patches in this area, increase the significance of the core patches, and establish new ecological sources.
The delineation of the urban ecological planning zone was grounded in the urbanization process of Yanchi County. Throughout urbanization process, the expansion of construction land has weakened the capacity of surrounding environments to provide ecosystem services. The presence of construction land, cultivated land, and desertified area surrounding the urban ecological planning zone occupies ecological niches, resulting in the scarcity of landscape core patches (Fig. 7a). Therefore, it is imperative to build small parks, greenways, and other green infrastructures within urban areas, which will serve as ecological corridors for the migration and dispersal of species and effectively improve the heterogeneity of urban habitats, thereby maintaining biodiversity and species richness at high levels. Outside the city, space should be reserved for ecological corridors and core patches, which can be utilized to establish ecological security barrier and enhance landscape connectivity within and beyond city limits. Simultaneously, proper control over urban construction and development practices is essential, alongside scientific management to curb urban sprawl.
The ecological environment restoration zone is situated at the southern end of Yanchi County. The area is located at a high altitude, and is dominated by agriculture, with frequent anthropogenic interference and limited forest land and grassland. The zone has increased ecological resistance and low landscape ecological quality. Consequently, increasing forest land and grassland cover to improve patch sizes, connectivity, and compatibility is imperative for this zone to expand its ecological source. Additionally, the construction of ecological corridors southwards from the source area, utilizing forest land and grassland patches, is essential to provide alternative migration routes for species. This approach will bolster the structural and functional resilience of the regional ecological network, contributing to an improved ecological security for Yanchi County.
The ecological security improvement zone can further develop the ecological security pattern constructed in this study. Its planning scheme integrates three dimensions, namely ecological nodes, ecological corridors, and ecological sources to develop a multi-level ecological security pattern construction strategy. The detailed planning proposals are as follows:
First, ecological nodes play a crucial role in maintaining and enhancing the stability of ecological corridors. The general ecological corridors in Yanchi County extend over long distances and are susceptible to cultivated land, construction activities, and sandy terrain, which results in constricted ecological corridor pathways. Therefore, the ecological significance of general ecological nodes is paramount. Efforts should focus on reinforcing existed ecological nodes to mitigate the influences of risk and to prevent disruptions in corridor connectivity.
Second, changes in the width of ecological corridor affect the proportions of different land use types within the corridor. When the widths of ecological corridors were between 30.00 and 60.00 m, the proportions of cultivated land, construction land, and unused were lower, whereas the proportion of forest land, water body, and grassland were higher, suggesting that the widths of 30.00 and 60.00 m are relatively suitable as bridges for species migration and energy flow (Table S2). Therefore, to optimize the ecological service functions of the security pattern in Yanchi County, this study defined the important ecological corridors and general ecological corridors as 30.00-60.00 m green buffer zones.
Third, the ecological sources in the southern part of the source area were relatively close to each other and exhibited a high degree of ecological relatedness. However, ecological sources of No. 5, 7, 8, and 9 were small in size. Therefore, enhancing the connectivity between these sources can be achieved by strengthening the construction of ecological nodes and ecological corridors. Alternatively, expanding the ecological source by merging ecological sources of No 5, 7, 8, and 9 into one ecological source with a larger area and a more stable ecosystem is recommended. In the central and northern parts of Yanchi County, the number of ecological sources was limited. The area of ecological land should be increased through afforestation and grass replenishment. These measures aim to gradually expand the number of ecological sources around the core patches of landscape to reduce the cost of ecological material and information interaction and exchange.

5 Discussion

5.1 Implications for building ecological security pattern

This study demonstrated the effectiveness of ecological projects for regional environmental protection and management from the perspectives of landscape stability, disturbance, and ecological quality. The results indicated that ecological project has contributed to environmental improvement. However, landscape stability is still at risk of weakening. To address this risk, this study constructed and optimized an ecological security pattern based on the ecological quality of the landscape in 2020. In the process of constructing ecological sources, compared with methods such as land use structures and ecosystem services (Li et al., 2023; Xue et al., 2023), the landscape ecological quality considers the degree of ecosystem disturbance, which can more comprehensively reflect the health of ecological sources and their ability to respond to external disturbances.
Presently, ecological security patterns emphasize ecological issues and social service objectives, becoming an important means to coordinate regional ecological protection and human social progress (Dong et al., 2022; Zou et al., 2022). A substantial amount of literature concentrates on constructing theoretical frameworks, strengthening indicator systems, and providing planning suggestions for ecologically fragile areas (Li et al., 2023; Wu et al., 2024). Nevertheless, the planning recommendations derived from these larger-scale ecological security model studies are constrained by administrative boundaries. Local governments need to consider equity between administrative boundaries such as cities and counties, and they need to establish interregional coordination mechanisms. This may pose constraints and challenges in the subsequent construction of ecological security pattern (Liu et al., 2024). This study constructed a small-scale ecological security pattern of Yanchi County, delineated four major planning zones, and proposed corresponding planning and construction recommendations. This study not only enriches the research on small scale landscape ecology, but also coordinates the conflicts of interest between different administrative divisions, optimizes the allocation of resources, and improves the efficiency of ecological security pattern construction.
The establishment and preservation of ecological corridors can, to a certain extent, alleviate the conflict between ecological conservation and economic development (Li et al., 2022). Existing studies typically assess the importance of ecological corridors using gravity model. Additionally, some studies classify the function of ecological corridors on the basis of the spatial distribution of endangered species and have developed an indicator system for assessing corridor significance (Gou et al., 2022; Yang et al., 2024). However, all these studies are deficient in their exploration of the width of the ecological corridors that are required for species migration, primarily due to a lack of detailed investigations and observational data. Currently, some scholars argue that wider ecological corridors are preferable, whereas others contend that the widths of biological corridors depend on factors such as species characteristics, corridor structures, and substrate compositions (Ni et al., 2019). By analyzing the compositions of land use types within ecological corridors of different widths, our study revealed that ecological land use types such as grasslands and forest lands did not show a significant downward trend when the widths of important and general ecological corridors were 30.00-60.00 m. The areas where they provide essential ecological services may impede the spread of ecologically sensitive areas such as deserts (Palmer and Ruhi, 2019; Wang et al., 2021b), thereby subjecting the corridors to relatively low ecological pressure and making them more suitable as bridges for species migration and energy flow (Li et al., 2022). Nevertheless, the width of corridor may be influenced by the surrounding topography, land use types, corridor functions, conservation goals, and ecological processes and functions (Dong et al., 2020). Determining the widths of regional ecological corridors quantitatively is a complex task, and future studies may require more detailed classifications and research tailored to different species.

5.2 Recommendations for constructing ecological security pattern

The construction of ecological security pattern requires the effective coordination of the conflicts between ecological protection and economic development goals and administrative management (Wang and Zhou, 2016; Wang et al., 2021b). Current research primarily emphasizes the construction and optimization of ecological security pattern, while studies regarding policy recommendations for their development are relatively insufficient. This study presented the following recommendations on the basis of the actual conditions of Yanchi County.
First, to strengthen the protection and construction of ecological sources and corridors, it is crucial to establish artificial ecological sources and corridors through measures such as afforestation, grassland restoration, and wetland conservation. These measures will create a connected network that enhances ecosystem stability in the region, particularly in areas severely affected by desertification. Additionally, it is necessary to establish ecological buffer zones around ecological sources and corridors to mitigate the impact of human activities on ecosystems.
Second, promoting the integration of sustainable agriculture and livestock farming with ecological security pattern construction, adjusting land use practices in Yanchi County, and implementing measures such as ecological livestock farming and water-saving agriculture (Wei et al., 2020; Yang et al., 2022). These methods aim to reduce grassland degradation and soil salinity, thereby alleviating pressure on ecosystems. Furthermore, agricultural and pastoral lands should be integrated organically with the construction of ecological corridors and sources to promote a rational layout and reduce the damage to ecological sensitive areas caused by land reclamation.
Third, to ensure the efficiency of ecological security pattern construction, an ecological regional geographic information system and an information-sharing platform should be established. Remote sensing, drones, and other technological means can monitor ecological corridors and sources in real-time, allowing for timely adjustments to planning and protective measures (Zhang et al., 2022b). In addition, the effectiveness of ecological security pattern construction should be evaluated regularly to ensure the efficacy of various policy measures and to optimize resource allocation and management strategies.

5.3 Research limitations

There are differences in indicator systems and methods for landscape ecological quality assessment due to the influence of regional characteristics (Penteado, 2013; Xu et al., 2019). Therefore, the establishment of an adaptable baseline standard for the landscape ecological quality indicator systems that are tailored to different environmental characteristics is crucial for improving landscape ecological quality assessments. Moreover, the current application of landscape ecological quality assessments in promoting sustainable development and accruing ecological, economic, and social benefits requires further refinements. It should be analyzed in conjunction with social, economic, and human-driven factors. In addition, to ensure the scientific validity of the results and based on the principle of data availability, this study examined only the landscape ecological quality index of Yanchi County from 1990 to 2020. Future research should extend the analysis to longer temporal scales to provide a more complete picture of landscape ecological dynamics.
Ecological sources form the foundation for ecological security pattern construction (Gou et al., 2022). To mitigate the subjectivity inherent in the artificial selection of ecological sources, this study employed MSPA and landscape connectivity analysis to identify ecological sources based on the evaluations of landscape ecological quality. However, during the process of identifying ecological sources, it is crucial to consider the thresholds for MSPA parameters, diffusion distances, and connectivity probabilities for landscape connectivity analysis, as well as the thresholds for PII and core patches, which may vary among scholars studying different regions (Tang et al., 2021). Consequently, further exploration of the relevant parameter criteria involved in MSPA and landscape connectivity analysis methods is necessary to accurately identify regional ecological sources at varying spatial scales.

6 Conclusions

From 1990 to 2020, the landscape ecological quality and stability in Yanchi County initially decreased but then increased, whereas the degree of landscape disturbance first intensified but then decreased. From 1990 to 2000, excessive cultivation, overgrazing, and overharvesting caused significant grassland degradation and severe desertification, leading to a decline in landscape ecological quality and severe deterioration of the ecological environment. After 2000, with the gradual implementation of ecological measures such as the establishment of nature reserves, grazing prohibition, and grassland ecological subsidy policy, the ecological quality of the landscape showed an improving trend. In summary, the implementation of the ecological project has contributed to the gradual improvement of the ecological environment in Yanchi County, but the landscape ecological quality of Yanchi County was still weak and needed to be improved. To consolidate the gains made in ecological protection and to ensure the sustainability of ecological projects, further optimizing the planning scheme for ecological construction, protection, and management is imperative.
The ecological security pattern of Yanchi County consisted of 10 ecological sources, 10 ecological source points, 12 important ecological corridors, 11 general ecological corridors, 9 important ecological nodes, and 18 general ecological nodes. Yanchi County's ecological security pattern exhibited instability and distinct spatial characteristics. Dense ecological sources and a stable network structure charactered the southern part of the ecological network, whereas the northern part featured sparse ecological sources and a simpler network structure. Thus, considering the characteristics of the spatial distribution of the landscape ecological quality, this study delineated four ecological security pattern construction zones: the Haba Lake ecological conservation zone, the urban ecological planning zone, the ecological environment restoration zone, and the ecological security improvement zone. The rational zoning based on the ecological security pattern of Yanchi County in 2020 would contribute to improving ecological environment and providing strong guidance and scientific support for spatial planning of Yanchi County.

Conflict of interest

The authors declare that they have no known competing financial interests or personal relationships that could have appeared to influence the work reported in this paper.

Acknowledgements

This work was funded by the National Natural Science Foundation of China (41807519) and the Open Fund Project of Key Laboratory of Deserts and Desertification, Chinese Academy of Sciences (KLDD-2018-002).

Author contributions

Conceptualization: LI Junhao, WANG Ya, SHI Gui, PEI Xiaodong ZHANG Cong, ZHOU Lihua, YANG Guojing; Methodology: LI Junhao, ZHANG Cong, ZHOU Lihua, YANG Guojing; Data curation: LI Junhao, SHI Gui, PEI Xiaodong; Resources: LI Junhao, WANG Ya, ZHOU Lihua, YANG Guojing; Formal analysis: LI Junhao, ZHOU Lihua; Writing - original draft preparation: LI Junhao; Writing - review and editing: LI Junhao, SHI Gui, PEI Xiaodong, ZHANG Cong; Funding acquisition: WANG Ya; Supervision: ZHOU Lihua. All authors approved the manuscript.

Appendix

Table S1 Patch importance index (PII) and area of each selected ecological source
No. of ecological source PII Area (km2)
1 4.97 139.72
2 21.79 271.54
3 2.49 18.01
4 12.69 203.78
5 18.96 11.12
6 31.41 228.62
7 20.47 26.03
8 16.00 13.80
9 3.78 24.01
10 37.36 297.00
Table S2 Area and percentage of each land use type in different widths of ecological corridors
Width (m) Type of corridor Item Cultivated land Forest land Grassland Water body Construction land Unused land
30.00 Important Area (km2) 1.90 1.44 8.65 0.04 0.09 0.45
Percentage (%) 15.12 11.46 68.81 0.32 0.72 3.58
General Area (km2) 3.47 4.66 15.42 0.27 0.23 1.49
Percentage (%) 13.59 18.25 60.38 1.06 0.90 5.83
60.00 Important Area (km2) 3.84 2.89 17.17 0.08 0.17 0.96
Percentage (%) 15.29 11.51 68.38 0.32 0.68 3.82
General Area (km2) 7.11 9.28 30.92 0.54 0.49 3.15
Percentage (%) 13.81 18.02 60.05 1.05 0.95 6.12
100.00 Important Area (km2) 6.52 4.72 28.20 0.13 0.33 1.77
Percentage (%) 15.65 11.33 67.67 0.31 0.79 4.25
General Area (km2) 12.20 15.03 51.16 0.84 0.85 5.80
Percentage (%) 14.21 17.50 59.57 0.98 0.99 6.75
200.00 Important Area (km2) 13.30 8.37 55.15 0.21 0.73 4.84
Percentage (%) 16.10 10.13 66.77 0.25 0.88 5.86
General Area (km2) 25.11 28.50 100.40 1.33 2.09 14.72
Percentage (%) 14.59 16.56 58.32 0.77 1.21 8.55
[1]
Aragón R, Oesterheld M, Irisarri G, et al. 2011. Stability of ecosystem functioning and diversity of grasslands at the landscape scale. Landscape Ecology, 26: 1011-1022.

[2]
Bai H, Li Z W, Guo H L, et al. 2022. Urban green space planning based on remote sensing and geographic information systems. Remote Sensing, 14(17): 4213, doi: 10.3390/rs14174213.

[3]
Benedict M A, McMahon E T. 2002. Green infrastructure: smart conservation for the 21st century. Renewable Resources Journal, 20(3): 12-17.

[4]
Blaikie P. 2008. Epilogue: Towards a future for political ecology that works. Geoforum, 39(2): 765-772.

[5]
Cunha N S, Magalhães M R. 2019. Methodology for mapping the national ecological network to mainland Portugal: A planning tool towards a green infrastructure. Ecological Indicators, 104: 802-818.

[6]
Dong J Q, Peng J, Liu Y X, et al. 2020. Integrating spatial continuous wavelet transform and kernel density estimation to identify ecological corridors in megacities. Landscape and Urban Planning, 199: 103815, doi: 10.1016/j.landurbplan.2020.103815.

[7]
Dong J Q, Jiang H, Gu T W, et al. 2022. Sustainable landscape pattern: a landscape approach to serving spatial planning. Landscape Ecology, 37: 31-42.

[8]
Field R D, Parrott L. 2017. Multi-ecosystem services networks: A new perspective for assessing landscape connectivity and resilience. Ecological Complexity, 32: 31-41.

[9]
Gao Y N, Zhao M L, Wang H L, et al. 2019. Analysis of spatial differentiation of grassland ecological quality and its affecting factors based on landscape ecology perspective: A case study of Siziwang Banner. Acta Ecologica Sinica, 39(14): 5288-5300. (in Chinese)

[10]
Gou M M, Li L, Ouyang S, et al. 2022. Integrating ecosystem service trade-offs and rocky desertification into ecological security pattern construction in the Daning River Basin of Southwest China. Ecological Indicators, 138: 108845, doi: 10.1016/j.ecolind.2022.108845.

[11]
Guo Z L, Hu Y C, Bai Y P. 2024. How to achieve ecological control zoning based on ecological security pattern (ESP)? A case study of China's coastal areas. Environmental Earth Sciences, 83(2): 57, doi: 10.1007/s12665-023-11362-8.

[12]
Hou C X, Zhou L H, Wen Y, et al. 2018. Evaluation of social-ecological systems resilience in ecological policy: a case study in Yanchi, Ningxia, China. China Population, Resources and Environment, 28(8): 117-126. (in Chinese)

[13]
Jia X Q, Fu B J, Feng X M, et al. 2014. The tradeoff and synergy between ecosystem services in the Grain-for-Green areas in northern Shaanxi, China. Ecological Indicators, 43: 103-113.

[14]
Jia Z Y, Chen C D, Tong X X, et al. 2017. Developing and optimizing ecological networks for the towns along the Three Gorges Reservoir: A case of Kaizhou New Town, Chongqing. Chinese Journal of Ecology, 36(3): 782-791. (in Chinese)

[15]
Lai J L, Li J S, Liu L. 2024. Optimization strategies for ecological security pattern based on the remote sensing ecological index in Yunnan Province, China. Land Degradation & Development, doi: 10.1002/ldr.5432.

[16]
Li L, Huang X J, Wu D F, et al. 2022. Optimization of ecological security patterns considering both natural and social disturbances in China's largest urban agglomeration. Ecological Engineering, 180: 106647, doi: 10.1016/j.ecoleng.2022.106647.

[17]
Li S C, Zhao Y L, Xiao Y, et al. 2020. Spatial and temporal differentiation of landscape ecological quality in Chaohu River Basin. Transactions of the Chinese Society for Agricultural Machinery, 51(1): 203-213. (in Chinese)

[18]
Li Y G, Liu W, Feng Q, et al. 2023. The role of land use change in affecting ecosystem services and the ecological security pattern of the Hexi Regions, Northwest China. Science of the Total Environment, 855: 158940, doi: 10.1016/j.scitotenv.2022.158940.

[19]
Liquete C, Kleeschulte S, Dige G, et al. 2015. Mapping green infrastructure based on ecosystem services and ecological networks: A Pan-European case study. Environmental Science & Policy, 54: 268-280.

[20]
Liu D, Lin N F, Zou C X, et al. 2015. Development of foreign ecological protected areas and linkages to ecological protection redline delineation and management in China. Biodiversity Science, 23(6): 708-715. (in Chinese)

[21]
Liu M L, Peng J, Dong J Q, et al. 2024. Trade-offs of landscape connectivity between regional and interregional ecological security patterns in a junction area of Beijing-Tianjin-Hebei region. Applied Geography, 167: 103272, doi: 10.1016/j.apgeog.2024.103272.

[22]
Luo M Y, Li T S. 2021. Spatial and temporal analysis of landscape ecological quality in Yulin. Environmental Technology & Innovation, 23: 101700, doi: 10.1016/j.eti.2021.101700.

[23]
Ma S C, Xie F F, Ding C, et al. 2020. Spatio-temporal change of landscape ecological quality and influencing factors based on four-quadrant model in overlapped area of cropland and coal production. Transactions of the Chinese Society of Agricultural Engineering (Transactions of the CSAE), 36(4): 259-268. (in Chinese)

[24]
Mandal M, Chatterjee N D. 2021. Forest landscape and its ecological quality: A stepwise spatiotemporal evaluation through patch-matrix model in Jhargram District, West Bengal State, India. Regional Sustainability, 2(2): 164-176.

[25]
Miao Z H, Pan L, Wang Q Z, et al. 2019. Research on urban ecological network under the threat of road networks—A case study of Wuhan. International Journal of Geo-Information, 8(8): 342, doi: 10.3390/ijgi8080342.

[26]
Montis A D, Caschili S, Mulas M, et al. 2016. Urban-rural ecological networks for landscape planning. Land Use Policy, 50: 312-327.

[27]
Ni Q L, Ding Z Y, Hou H P, et al. 2019. Ecological pattern recognition and protection based on circuit theory. Journal of Arid Land Resources and Environment, 33(5): 67-73. (in Chinese)

[28]
Palmer M, Ruhi A. 2019. Linkages between flow regime, biota, and ecosystem processes: Implications for river restoration. Science, 365(6459): eaaw2087, doi: 10.1126/science.aaw2087.

[29]
Peng J, Jia J L, Hu Y N, et al. 2018. Construction of ecological security pattern in the agro-pastoral ecotone based on surface humid index: A case study of Hangjin Banner, Inner Mongolia Autonomous Region, China. Chinese Journal of Applied Ecology, 29(6): 1990-1998. (in Chinese)

[30]
Penteado H M. 2013. Assessing the effects of applying landscape ecological spatial concepts on future habitat quantity and quality in an urbanizing landscape. Landscape Ecology, 28: 1909-1921.

[31]
Qian W Q, Zhao Y, Li X Y. 2023. Construction of ecological security pattern in coastal urban areas: A case study in Qingdao, China. Ecological Indicators, 154: 110754, doi: 10.1016/j.ecolind.2023.110754.

[32]
Qiao R R, Huang H T, Dong C Y, et al. 2023. Analysis of the influence of farmland pattern on landscape diversity in artificial oasis along the Yellow River in Ningxia: A case study in Zhongwei-Zhongning Plain Irrigation District. Journal of Desert Research, 43(2): 21-27. (in Chinese)

[33]
Ren G P, Liu L M, Zhuo D. 2016. Analysis of spatial differentiation of landscape ecological quality and its affecting factors in metropolitan suburbs. Transactions of the Chinese Society of Agricultural Engineering, 32(21): 252-263. (in Chinese)

[34]
Shi Y Y, Ji Y F, Zhang H J. 2018. Construction of suitability indicator system of Minqin oasis ecosystem. Agricultural Research in the Arid Areas, 36(6): 263-268. (in Chinese)

[35]
Su Q J, An Y L, Ma S B, et al. 2017. Landscape ecological quality of different lithological regions in karst mountains: A case study in the Luodian County of Guizhou Province. Carsologica Sinica, 36(4): 454-462. (in Chinese)

[36]
Tang F, Zhang P T, Zhang G J, et al. 2018. Construction of ecological corridors in Changli County based on ecological sensitivity and ecosystem service values. Chinese Journal of Applied Ecology, 29(8): 2675-2684. (in Chinese)

[37]
Tang F, Zhou X, Wang L, et al. 2021. Linking ecosystem service and MSPA to construct landscape ecological network of the Huaiyang Section of the Grand Canal. Land, 10(9): 919, doi: 10.3390/land10090919.

[38]
Wang T, Li H B, Huang Y. 2021a. The complex ecological network's resilience of the Wuhan metropolitan area. Ecological Indicators, 130: 108101, doi: 10.1016/j.ecolind.2021.108101.

[39]
Wang W W, Yang G J, Sun Y, et al. 2019. Linking prohibited grazing policy to farmers' subjective well-being: A case study in Yanchi County, China. Sustainability, 11(7): 2180, doi: 10.3390/su11072180.

[40]
Wang W W, Zhou L H, Sun Y, et al. 2021b. Influencing factors of farmers' life satisfaction under the background of grazing prohibition policy in Yanchi County, Ningxia Autonomous Region. Acta Ecologica Sinica, 41(23): 9282-9291. (in Chinese)

[41]
Wang Y, Zhou L H. 2016. Assessment of the coordination ability of sustainable social-ecological systems development based on a set pair analysis: A case study in Yanchi County, China. Sustainability, 8(8): 733, doi: 10.3390/su8080733.

[42]
Wei Q Q, Halike A, Yao K X, et al. 2022. Construction and optimization of ecological security pattern in Ebinur Lake Basin based on MSPA-MCR models. Ecological Indicators, 138: 108857, doi: 10.1016/j.ecolind.2022.108857.

[43]
Wei X, Zhou L H, Yang G J, et al. 2020. Assessing the effects of desertification control projects from the farmers' perspective: A case study of Yanchi County, Northern China. International Journal of Environmental Research and Public Health, 17(3): 983, doi: 10.3390/ijerph17030983.

[44]
Wu S Y, Zhao C, Yang L, et al. 2024. Spatial and temporal evolution analysis of ecological security pattern in Hubei Province based on ecosystem service supply and demand analysis. Ecological Indicators, 162: 112051, doi: 10.1016/j.ecolind.2024.112051.

[45]
Xiao L, Cui L, Jiang Q O, et al. 2020. Spatial structure of a potential ecological network in Nanping, China, based on ecosystem service functions. Land, 9(10): 376, doi: 10.3390/land9100376.

[46]
Xiao R, Cao W, Liu Y, et al. 2022. The impacts of landscape patterns spatio-temporal changes on land surface temperature from a multi-scale perspective: A case study of the Yangtze River Delta. Science of the Total Environment, 821: 153381, doi: 10.1016/j.scitotenv.2022.153381.

[47]
Xu J X, Zhao H, Yin P C, et al. 2019. Landscape ecological quality assessment and its dynamic change in coal mining area: a case study of Peixian. Environmental Earth Sciences, 78: 708, doi: 10.1007/s12665-019-8747-5.

[48]
Xu T, Nie W B, Wang Z G, et al. 2024. Research on the coupled mechanism of landscape connectivity simulation by integrating multi-level ecological security patterns and multi-scenario simulation: A case study of the main urban area of Hangzhou. Land Degradation & Development, 35(8): 2716-2737.

[49]
Xu W X, Wang J M, Zhang M, et al. 2021. Construction of landscape ecological network based on landscape ecological risk assessment in a large-scale opencast coal mine area. Journal of Cleaner Production, 286: 125523, doi: 10.1016/j.jclepro.2020.125523.

[50]
Xue F, Yang Y R, Hu Y N. 2024. Integrating supply and benefits of ecosystem services into ecological security pattern: A spatial flow perspective. Ecological Indicators, 166: 112455, doi: 10.1016/j.ecolind.2024.112455.

[51]
Xue J, Li Z X, Feng Q, et al. 2023. Construction of ecological conservation pattern based on ecosystem services of Three River Headwaters, Western China. Global Ecology and Conservation, 44: e02491, doi: 10.1016/j.gecco.2023.e02491.

[52]
Yang J, Xie B P, Wang T B, et al. 2023. Identification and optimization strategy of ecological security pattern in Maiji District of Gansu, China. Ecological Indicators, 157: 111309, doi: 10.1016/j.ecolind.2023.111309.

[53]
Yang J X, Deng W, Zhang G H, et al. 2024. Linking endangered species protection to construct and optimize ecological security patterns in the national ecological civilization construction demonstration zone: A case study of Yichang, China. Ecological Indicators, 158: 111579, doi: 10.1016/j.ecolind.2024.111579.

[54]
Yang Q K, Wang L, Li Y L, et al. 2021. Urban spatial expansion mode based on the construction of landscape ecological security pattern: A case of the coastal area of Jiangsu. Scientia Geographica Sinica, 41(5): 737-746. (in Chinese)

[55]
Yang X, Pu Y W, Weng S G, et al. 2022. Review of agricultural water-saving policies and measures in recent years—a case study of Jiangsu Province, China. Water Supply, 22(4): 3951-3967.

[56]
Ye X, Zou C X, Liu G H, et al. 2018. Main research contents and advances in the ecological security pattern. Acta Ecologica Sinica, 38(10): 3382-3392. (in Chinese)

[57]
Ye Y Y, Su Y X, Zhang H O, et al. 2015. Construction of an ecological resistance surface model and its application in urban expansion simulations. Journal of Geographical Sciences, 25: 211-224.

[58]
Yi L, Sun Y, Yin S H, et al. 2022. Construction of ecological security pattern: Concept, framework and prospect. Ecology and Environmental Sciences, 31(4): 845-856. (in Chinese)

[59]
Yin H W, Kong F H, Qi Y, et al. 2011. Developing and optimizing ecological networks in urban agglomeration of Hunan Province, China. Acta Ecologica Sinica, 31(10): 2863-2874. (in Chinese)

[60]
Zeng W T, He Z W, Bai W Q, et al. 2024. Identification of ecological security patterns of alpine wetland grasslands based on landscape ecological risks: A study in Zoigê County. Science of the Total Environment, 928: 172302, doi: 10.1016/j.scitotenv.2024.172302.

[61]
Zetterberg A, Mortberg U M, Balfors B. 2010. Making graph theory operational for landscape ecological assessments, planning, and design. Landscape and Urban Planning, 95(4): 181-191.

[62]
Zhang D C, Wang Z M, Li Y J, et al. 2024. Research on the index system and evaluation method for ecological services of river shorelines. Journal of Environmental Engineering Technology, 14(1): 289-297.

[63]
Zhang H T, Li J L, Tian P, et al. 2022a. Construction of ecological security patterns and ecological restoration zones in the city of Ningbo, China. Journal of Geographical Sciences, 32(4): 663-681.

[64]
Zhang R, Zhang Q P, Zhang L, et al. 2022b. Identification and extraction of a current urban ecological network in Minhang District of Shanghai based on an optimization method. Ecological Indicators, 136: 108647, doi: 10.1016/j.ecolind.2022.108647.

[65]
Zhang Y Z, Jiang Z Y, Li Y Y, et al. 2021. Construction and optimization of an urban ecological security pattern based on habitat quality assessment and the minimum cumulative resistance model in Shenzhen City, China. Forests, 12(7): 847, doi: 10.3390/f12070847.

[66]
Zhao S M, Ma Y F, Wang J L, et al. 2019. Landscape pattern analysis and ecological network planning of Tianjin City. Urban Forestry & Urban Green, 46: 126479, doi: 10.1016/j.ufug.2019.126479.

[67]
Zou S J, Zhang L, Huang X, et al. 2022. Early ecological security warning of cultivated lands using RF-MLP integration model: A case study on China's main grain-producing areas. Ecological Indicators, 141: 109059, doi: 10.1016/j.ecolind.2022.109059.

文章导航

/