
Runoff simulation and hydropower resource prediction of the Kaidu River Basin in the Tianshan Mountains, China
Received date: 2024-05-13
Revised date: 2024-11-17
Accepted date: 2024-11-25
Online published: 2025-08-13
ZHANG Jing , XU Changchun , WANG Hongyu , WANG Yazhen , LONG Junchen . [J]. Journal of Arid Land, 2025 , 17(1) : 1 -18 . DOI: 10.1007/s40333-025-0071-1
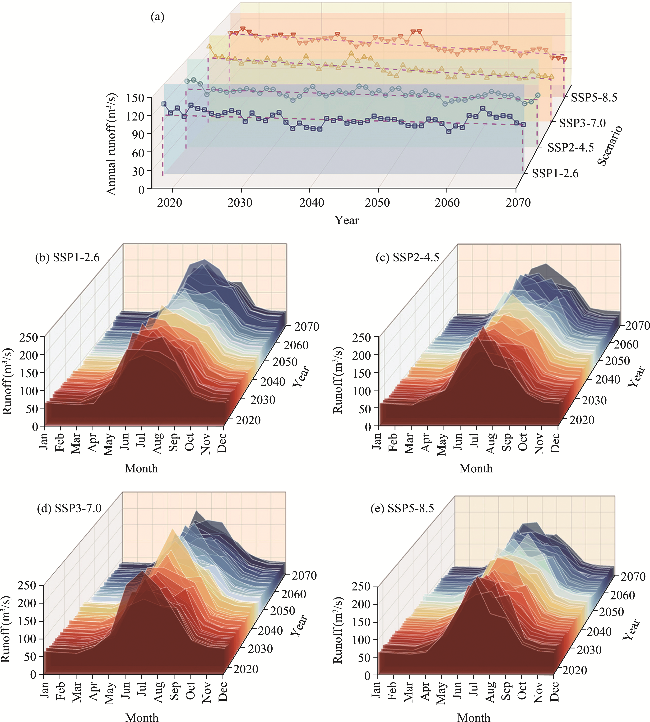
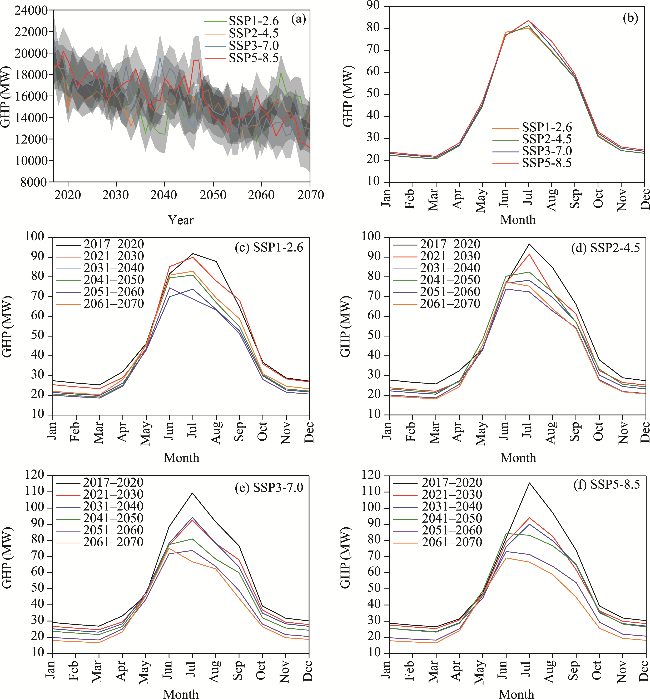
The Tianshan Mountains of Central Asia, highly sensitive to climate change, has been comprehensively assessed for its ecosystem vulnerability across multiple aspects. However, studies on the region's main river systems and hydropower resources remain limited. Thus, examining the impact of climate change on the runoff and gross hydropower potential (GHP) of this region is essential for promoting sustainable development and effective management of water and hydropower resources. This study focused on the Kaidu River Basin that is situated above the Dashankou Hydropower Station on the southern slope of the Tianshan Mountains, China. By utilizing an ensemble of bias-corrected global climate models (GCMs) from Coupled Model Intercomparison Project Phase 6 (CMIP6) and the Variable Infiltration Capacity (VIC) model coupled with a glacier module (VIC-Glacier), we examined the variations in future runoff and GHP during 2017-2070 under four shared socio-economic pathway (SSP) scenarios (SSP1-2.6, SSP2-4.5, SSP3-7.0, and SSP5-8.5) compared to the baseline period (1985-2016). The findings indicated that precipitation and temperature in the Kaidu River Basin exhibit a general upward trend under the four SSP scenarios, with the fastest rate of increase in precipitation under the SSP2-4.5 scenario and the most significant changes in mean, maximum, and minimum temperatures under the SSP5-8.5 scenario, compared to the baseline period (1980-2016). Future runoff in the basin is projected to decrease, with rates of decline under the SSP1-2.6, SSP2-4.5, SSP3-7.0, and SSP5-8.5 scenarios being 3.09, 3.42, 7.04, and 7.20 m³/s per decade, respectively. The trends in GHP are consistent with runoff, with rates of decline in GHP under the SSP1-2.6, SSP2-4.5, SSP3-7.0, and SSP5-8.5 scenarios at 507.74, 563.33, 1158.44, and 1184.52 MW/10a, respectively. Compared to the baseline period (1985-2016), the rates of change in GHP under the SSP1-2.6, SSP2-4.5, SSP3-7.0, and SSP5-8.5 scenarios are -20.66%, -20.93%, -18.91%, and -17.49%, respectively. The Kaidu River Basin will face significant challenges in water and hydropower resources in the future, underscoring the need to adjust water resource management and hydropower planning within the basin.
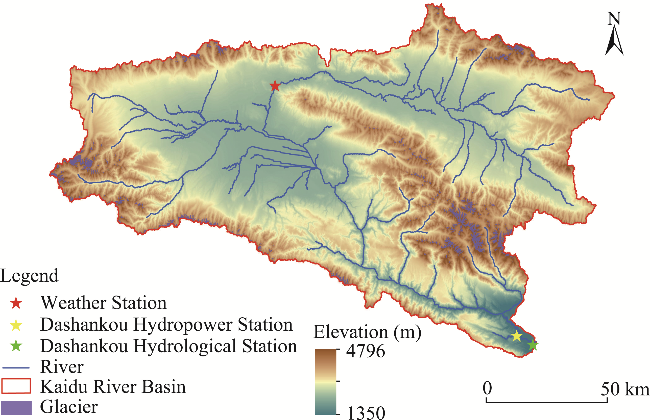
Fig. 1 Overview of river network and glacier distribution in the Kaidu River Basin. Elevation data are sourced from the Geospatial Data Cloud (https://www.gscloud.cn/), and glacier data are sourced from the National Cryosphere Desert Data Center (http://www.ncdc.ac.cn/portal/). |
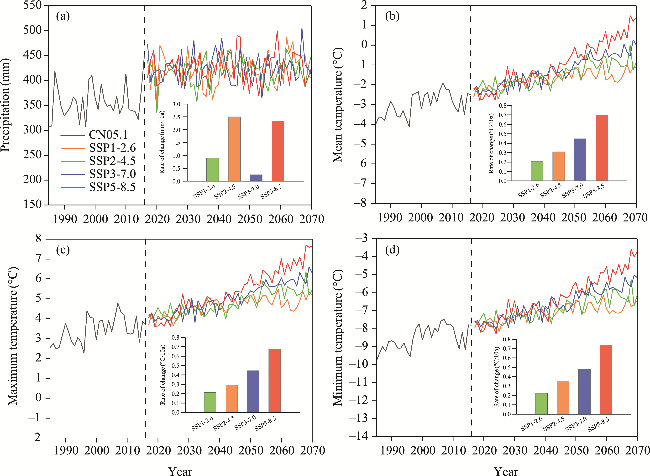
Fig. 2 Temporal variations in annual precipitation (a), mean temperature (b), maximum temperature (c), and minimum temperature (d) of the Kaidu River Basin during the baseline period (1980-2016) and future period (2017-2070) under four shared socio-economic pathway (SSP) scenarios (SSP1-2.6, SSP2-4.5, SSP3-7.0, and SSP5-8.5). The CN05.1 data were used during the baseline period. |
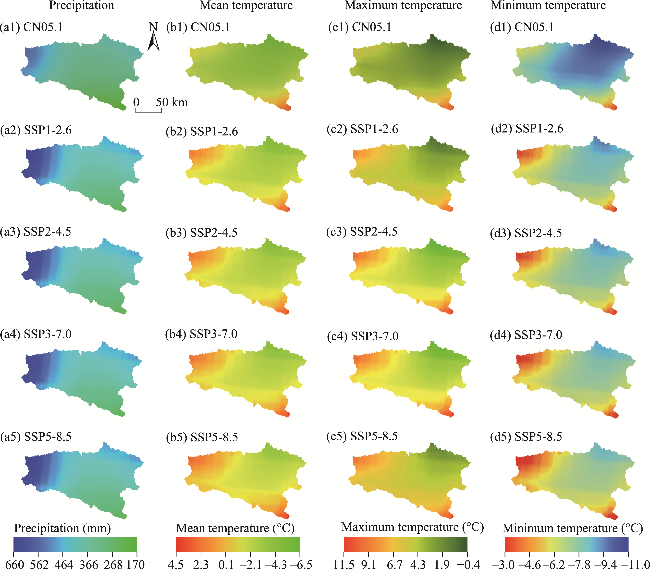
Fig. 3 Spatial distributions of multi-year average precipitation (a1-a5), mean temperature (b1-b5), maximum temperature (c1-c5), and minimum temperature (d1-d5) during the baseline period (1980-2016) and future period (2017-2070) under the four SSP scenarios (SSP1-2.6, SSP2-4.5, SSP3-7.0, and SSP5-8.5) |
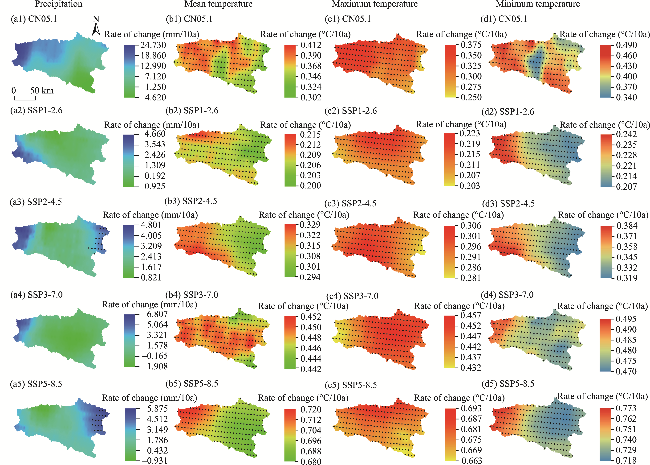
Fig. 4 Spatial distributions of trends in annual precipitation (a1-a5), mean temperature (b1-b5), maximum temperature (c1-c5), and minimum temperature (d1-d5) for the baseline period (1980-2016) and future period (2017-2070) under the four SSP scenarios (SSP1-2.6, SSP2-4.5, SSP3-7.0, and SSP5-8.5). Regions marked with dots indicate statistically significant trends in these variables (P<0.05). |
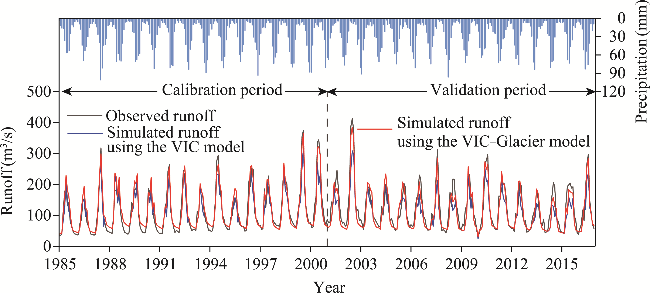
Fig. 5 Comparison of observed and simulated runoff using both the VIC model and VIC-Glacier model during the calibration (1985-2000) and validation (2001-2016) periods. VIC, Variable Infiltration Capacity; VIC-Glacier, the VIC model coupled with a glacier module. |
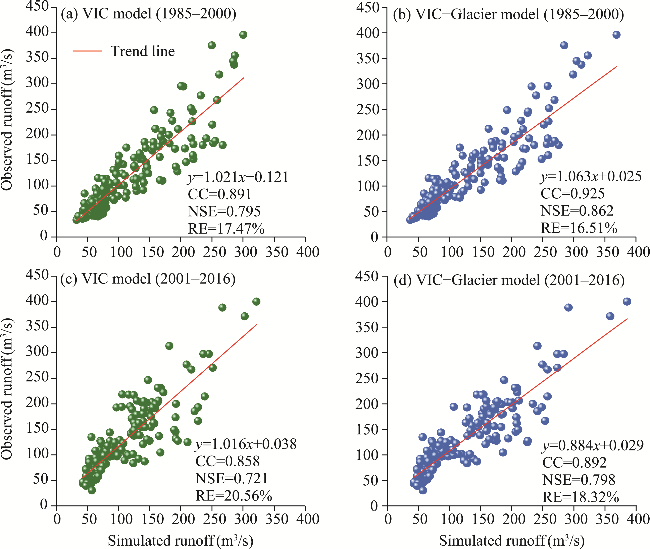
Fig. 6 Scatter plots showing the runoff simulation performance of the VIC (a and c) and VIC-Glacier (b and d) models during the calibration (1985-2000) and validation (2001-2016) periods. CC, correlation coefficient; NSE, Nash-Sutcliffe efficiency; RE, relative error. |
Fig. 7 Variations in annual runoff (a) and monthly runoff (b-e) from 2017 to 2070 under the SSP1-2.6, SSP2-4.5, SSP3-7.0, and SSP5-8.5 scenarios |
Fig. 8 Variations in annual total GHP (a), monthly average GHP (b), and segmented monthly average GHP (c-f) during 2017-2070 under the four SSP scenarios (SSP1-2.6, SSP2-4.5, SSP3-7.0, and SSP5-8.5) |
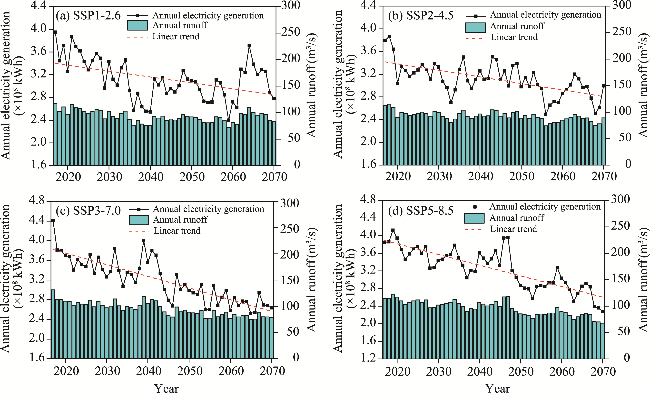
Fig. 9 Variations in electricity generation and runoff from 2017 to 2070 under the SSP1-2.6 (a), SSP2-4.5 (b), SSP3-7.0 (c), and SSP5-8.5 (d) scenarios |
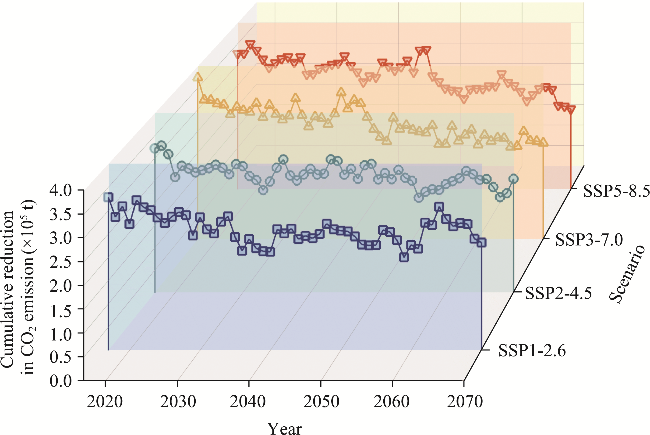
Fig. 10 Variations in CO2 emission reductions from 2017 to 2070 under the SSP1-2.6, SSP2-4.5, SSP3-7.0, and SSP5-8.5 scenarios |
| [1] |
|
| [2] |
|
| [3] |
|
| [4] |
|
| [5] |
|
| [6] |
|
| [7] |
|
| [8] |
|
| [9] |
|
| [10] |
|
| [11] |
|
| [12] |
|
| [13] |
|
| [14] |
IPCC
|
| [15] |
IPCC. 2023. Climate Change 2023:Synthesis Report. Contribution of Working Groups I, II and III to the Sixth Assessment Report of the Intergovernmental Panel on Climate Change. Geneva: IPCC.
|
| [16] |
|
| [17] |
|
| [18] |
|
| [19] |
|
| [20] |
|
| [21] |
|
| [22] |
|
| [23] |
|
| [24] |
|
| [25] |
|
| [26] |
|
| [27] |
|
| [28] |
|
| [29] |
|
| [30] |
|
| [31] |
|
| [32] |
|
| [33] |
|
| [34] |
|
| [35] |
|
| [36] |
|
| [37] |
|
| [38] |
|
| [39] |
|
| [40] |
|
| [41] |
|
| [42] |
|
| [43] |
|
| [44] |
|
| [45] |
|
/
| 〈 |
|
〉 |