
Soil ecological stoichiometry in varied micro- topographies of an alluvial fan at eastern Helan Mountains, Northwest China
Received date: 2024-03-29
Revised date: 2024-09-18
Accepted date: 2024-10-29
Online published: 2025-08-13
SHEN Aihong , ZHAO Na , SHI Yun , MI Wenbao , SHE Jie , ZHANG Fenghong , GUO Rui , WU Tao , LI Zhigang , LI Jianhua , ZHU Xiaowen , LI Hongxia , YUE Shaoli . [J]. Journal of Arid Land, 2024 , 16(12) : 1648 -1663 . DOI: 10.1007/s40333-024-0037-8
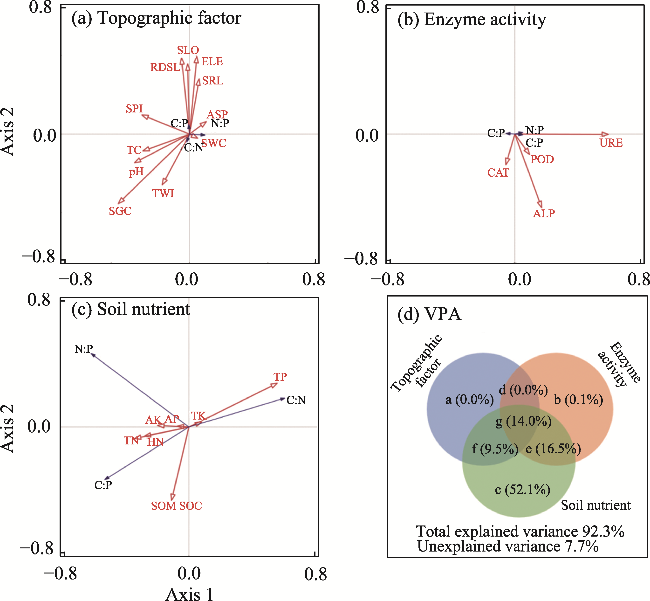
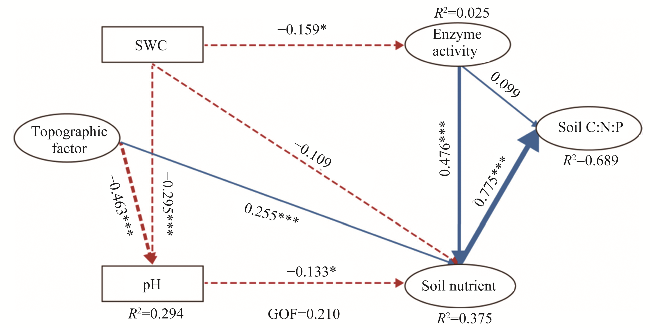
Alluvial fans possess diverse geomorphological features and have a significant impact on soil characteristics and variations in ecological stoichiometry. However, it remains unclear how alluvial fans in arid mountainous areas influence the changes in ecological chemical stoichiometry and, consequently, indirectly affect ecosystem function. Alluvial fan, with its diverse topographical features, exerts a multifaceted influence on soil formation and characteristics. Limited information exists regarding the ecological stoichiometric characteristics of the alluvial fan in arid mountainous areas. This study investigated the soil physical-chemical characteristics, enzyme activities, soil ecological stoichiometries, and its driving factors of four types of micro-topographies (alluvial mesas, high floodplain, groove beach, and striated groove) in the foothills of eastern Helan Mountains, China. Results showed that soil physical and chemical properties in the 0-20 cm soil depth was consistently higher than those in the 20-40 cm soil depth, with no changes in pH, total nitrogen, and total potassium. C:P and N:P ratios in alluvial mesas, high floodplain, and striated groove were significantly higher than those in groove beach. Redundancy analysis showed that soil nutrients played the most significant role in the variation of soil ecological stoichiometry characteristics. Topography influenced soil stoichiometry indirectly, primarily through impacts on enzyme activity and soil nutrient elements. These findings elucidate the intricate interplay between soil ecological stoichiometric characteristics and environmental factors across diverse micro-topographies in alluvial fan, contributing to our understanding of the formation and development of soil in dryland.
Key words: enzyme activity; soil layer; topography; soil physical-chemical property; dryland
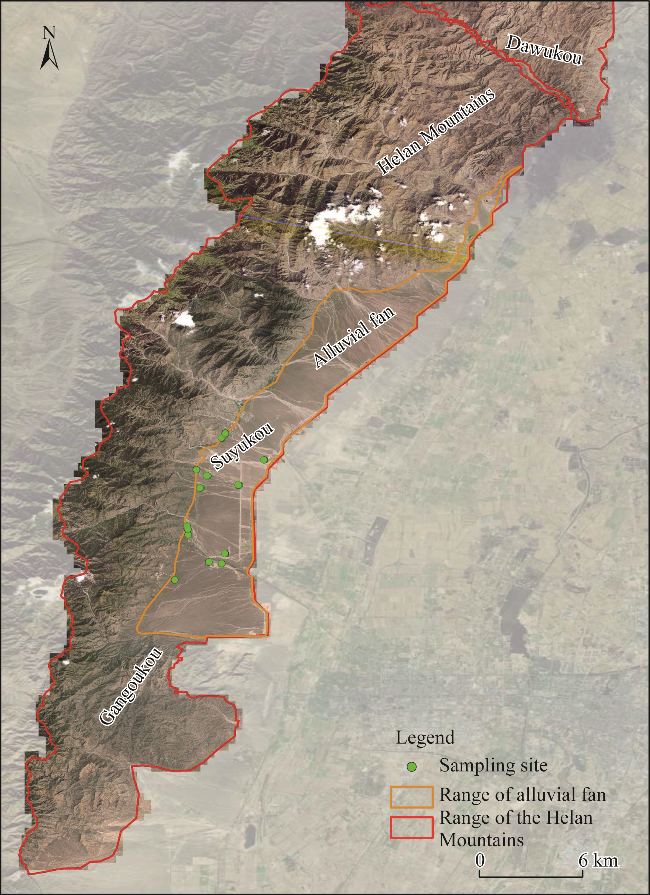
Fig. 1 Alluvial fan and sampling sites in the Helan Mountains |
Table 1 Types of micro-topography and characteristics |
| Micro-topography | Photograph | Feature | Community composition |
|---|---|---|---|
| Alluvial mesas | 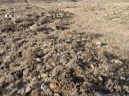 | Difference in relative height is the greatest; it mainly distributes coarse gravel and boulder sediments, flat terrain, well developed fan soil; and vegetation is mainly small shrubs. | Sophora laricifolia Maxim., Elymus rhytidosperma (Hook. f.) Pilg., Caragana tragacanthoides (Pall.) DC., Lespedeza davurica (Laxm.) Schindl., Caragana arborescens Lam., Stipa breviflora Griseb., and Glycyrrhiza glabra L. |
| High floodplain | 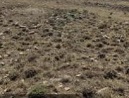 | Difference in relative height is significant; it irregularly distributes fine gravel and coarse gravel sediments; the fan area is in the early stages of soil development; and vegetation is mainly small shrubs. | C. spinifera, Sophora laricifolia Maxim., Euphorbia maculata L., and Stipa breviflora Griseb. |
| Striated groove | 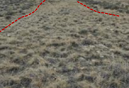 | Relatively low and flat terrain exists with fine-grained gravel sediments in a narrow strip and thick soil layer and vegetation is mainly herbs. | S. breviflora, Caragana inermis Kom., Polygonatum multiflorum (L.) All., Camellia japonica L., and Allium leek L. |
| Groove beach | 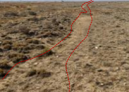 | Low and flat terrain exists and vegetation is mainly herbs. | S. breviflora, Reaumuria alashanica Maxim., and Ammopiptanthus mongolicus (Maxim. ex Kom.) |
Table 2 Effects of micro-topography and soil depth on soil physical-chemical parameters and ecological stoichiometry |
| Factor | SWC | Gravel content | pH | TK | HN | AP | AK |
|---|---|---|---|---|---|---|---|
| Micro-topography | <0.001 | <0.001 | 0.020 | <0.010 | <0.001 | 0.070 | <0.001 |
| Soil depth | 0.420 | 0.460 | 0.170 | 0.080 | <0.001 | 0.330 | <0.001 |
| Micro-topography×soil depth | 0.850 | 0.120 | 0.910 | 0.680 | 0.640 | 0.790 | 0.510 |
| Factor | SOC | TN | TP | C:N | C:P | N:P | |
| Micro-topography | <0.001 | <0.001 | <0.001 | 0.460 | <0.001 | <0.001 | |
| Soil depth | 0.040 | <0.010 | 0.670 | 0.010 | 0.210 | 0.020 | |
| Micro-topography×soil depth | 0.850 | 0.710 | 0.620 | 0.630 | 0.680 | 0.590 |
Note: SWC, soil water content; TK, total potassium; HN, hydrolysable nitrogen; AP, available phosphorus; AK, available potassium; SOC, soil organic carbon; TN, total nitrogen; TP, total phosphorus; C:N, carbon:nitrogen; C:P, carbon:phosphorous; N:P, nitrogen:phosphorous. The abbreviations are the same in the following tables and figures. |
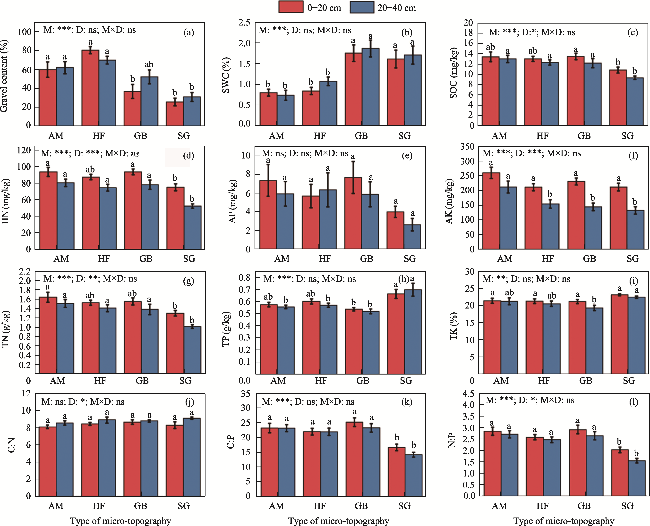
Fig. 2 Soil physical-chemical parameters (a-i) and stoichiometric ratios (j-l) in different micro-topographies and soil depths. M, micro-topography; D, soil depth; M×D, interaction between micro-topography and depth. AM, alluvial mesas; HF, high floodplain; GB, groove beach; SG, striated groove. Different lowercase letters represent significant differences in the same soil depth among different micro-topography at P<0.050 level. ***, P<0.001 level; **, P<0.010 level; *, P<0.050 level; ns, no significant difference. The abbreviations are the same as in the following figures. |
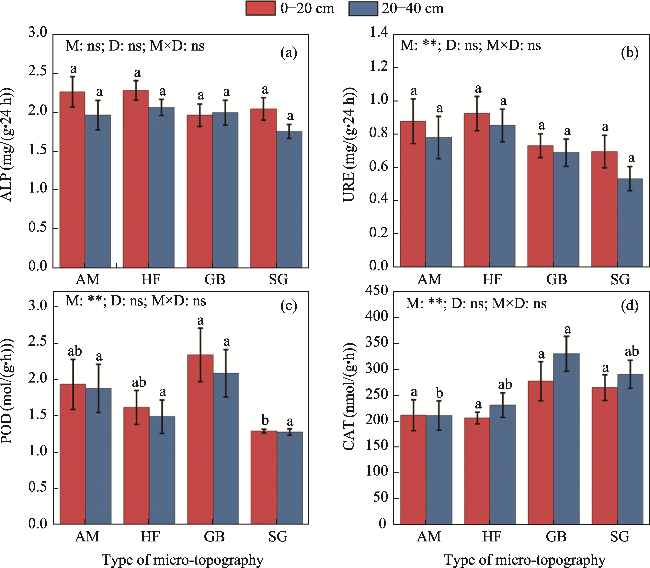
Fig. 3 Soil enzyme activity in different micro-topographies and soil depths. (a), ALP (alkaline phosphatase); (b), URE (urease); (c), POD (peroxidase); (d), CAT (catalase). Different lowercase letters represent significant differences at the same soil depth among different micro-topographies at P<0.050 level. **, P<0.010 level; ns, no significant difference. |
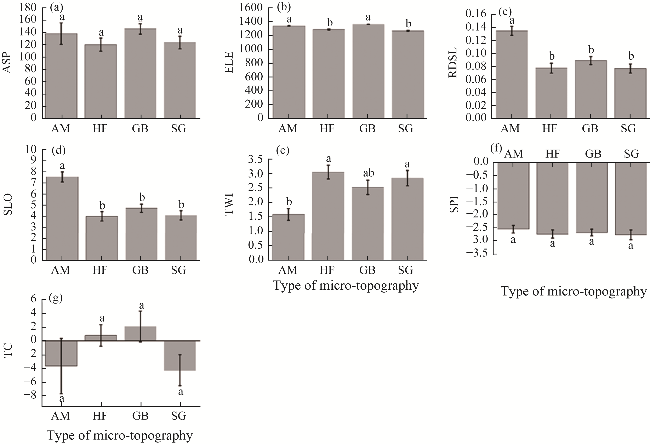
Fig. 4 Differences of topographic factors among different micro-topographies. (a), ASP (slope aspect); (b), ELE (elevation); (c), RDSL (relief degree of land surface); (d), SLO (slope); (e), TWI (topographic wetness index); (f), SPI (stream power index); (g), TC (terrain curvature). Different lowercase letters represent significant differences in environmental indicators among different micro-topographies at P<0.050 level. The abbreviations are the same in the following figures. |
Fig. 5 Redundancy analysis (RDA) and variance partitioning analysis (VPA) between soil ecological stoichiometry and their influencing factors. (a), topographic factor; (b), enzyme activity; (c), soil nutrient; (d), VPA. In Figure 5d, a, b, and c are topographic factor, enzyme activity, and soil nutrient, respectively; d is the interaction between a and b; e is the interaction between b and c; f is the interaction between a and c; and g is the interaction among a, b, and c. |
Table 3 Effects of influencing factors and their interaction on soil ecological stoichiometry |
| Tested fraction | F | P | Tested fraction | F | P |
|---|---|---|---|---|---|
| Topographical factor (a) | 1.000 | 0.402 | b×e | 10.900 | 0.002 |
| Enzyme activity (b) | 1.400 | 0.184 | c×f | 171.000 | 0.002 |
| Soil nutrient (c) | 134.000 | 0.002 | a×b×c×d×e×f×g | 83.900 | 0.002 |
| a×d | 1.000 | 0.434 |
Note: d is the interaction between a and b; e is the interaction between b and c; f is the interaction between a and c; and g is the interaction among a, b, and c. |
Fig. 6 Partial least squares structural equation model (PLS-SEM) result for influencing factors on soil chemical stoichiometry. GOF, goodness-of-fit; *, P<0.050 level, ***, P<0.001 level. |
| [1] |
|
| [2] |
|
| [3] |
|
| [4] |
|
| [5] |
|
| [6] |
|
| [7] |
|
| [8] |
|
| [9] |
|
| [10] |
|
| [11] |
|
| [12] |
|
| [13] |
|
| [14] |
|
| [15] |
|
| [16] |
|
| [17] |
|
| [18] |
|
| [19] |
|
| [20] |
|
| [21] |
|
| [22] |
|
| [23] |
|
| [24] |
|
| [25] |
|
| [26] |
|
| [27] |
|
| [28] |
|
| [29] |
|
| [30] |
|
| [31] |
|
| [32] |
|
| [33] |
|
| [34] |
|
| [35] |
|
| [36] |
|
| [37] |
|
| [38] |
|
| [39] |
|
| [40] |
|
| [41] |
|
| [42] |
|
| [43] |
|
| [44] |
|
| [45] |
|
| [46] |
|
| [47] |
|
| [48] |
|
| [49] |
|
| [50] |
|
| [51] |
|
| [52] |
|
| [53] |
|
| [54] |
|
| [55] |
|
| [56] |
|
| [57] |
|
| [58] |
|
| [59] |
|
| [60] |
|
| [61] |
|
| [62] |
|
| [63] |
|
/
| 〈 |
|
〉 |