• WANG Xiaochen 1, 2 ,
  • LI Zhi , 1, * ,
  • CHEN Yaning 1 ,
  • ZHU Jianyu 1, 3 ,
  • WANG Chuan 1, 2 ,
  • WANG Jiayou 1, 2 ,
  • ZHANG Xueqi 1 ,
  • FENG Meiqing 1, 2 ,
  • LIANG Qixiang 1, 2
展开

收稿日期: 2024-08-28

  修回日期: 2024-12-04

  录用日期: 2025-02-05

  网络出版日期: 2025-08-12

Impact of extreme weather and climate events on crop yields in the Tarim River Basin, China

  • WANG Xiaochen 1, 2 ,
  • LI Zhi , 1, * ,
  • CHEN Yaning 1 ,
  • ZHU Jianyu 1, 3 ,
  • WANG Chuan 1, 2 ,
  • WANG Jiayou 1, 2 ,
  • ZHANG Xueqi 1 ,
  • FENG Meiqing 1, 2 ,
  • LIANG Qixiang 1, 2
Expand
  • 1State Key Laboratory of Desert and Oasis Ecology, Key Laboratory of Ecological Safety and Sustainable Development in Arid Lands, Xinjiang Institute of Ecology and Geography, Chinese Academy of Sciences, Urumqi 830011, China
  • 2University of the Chinese Academy of Sciences, Beijing 100049, China
  • 3Chifeng Institute of Agricultural and Animal Husbandry Science, Inner Mongolia, Chifeng 024000, China
*LI Zhi (E-mail: )

Received date: 2024-08-28

  Revised date: 2024-12-04

  Accepted date: 2025-02-05

  Online published: 2025-08-12

本文引用格式

WANG Xiaochen , LI Zhi , CHEN Yaning , ZHU Jianyu , WANG Chuan , WANG Jiayou , ZHANG Xueqi , FENG Meiqing , LIANG Qixiang . [J]. Journal of Arid Land, 2025 , 17(2) : 200 -223 . DOI: 10.1007/s40333-025-0094-7

Abstract

The Tarim River Basin (TRB) is a vast area with plenty of light and heat and is an important base for grain and cotton production in Northwest China. In the context of climate change, however, the increased frequency of extreme weather and climate events is having numerous negative impacts on the region's agricultural production. To better understand how unfavorable climatic conditions affect crop production, we explored the relationship of extreme weather and climate events with crop yields and phenology. In this research, ten indicators of extreme weather and climate events (consecutive dry days (CDD), min Tmax (TXn), max Tmin (TNx), tropical nights (TR), warm days (Tx90p), warm nights (Tn90p), summer days (SU), frost days (FD), very wet days (R95p), and windy days (WD)) were selected to analyze the impact of spatial and temporal variations on the yields of major crops (wheat, maize, and cotton) in the TRB from 1990 to 2020. The three key findings of this research were as follows: extreme temperatures in southwestern TRB showed an increasing trend, with higher extreme temperatures at night, while the occurrence of extreme weather and climate events in northeastern TRB was relatively low. The number of FD was on the rise, while WD also increased in recent years. Crop yields were higher in the northeast compared with the southwest, and wheat, maize, and cotton yields generally showed an increasing trend despite an earlier decline. The correlation of extreme weather and climate events on crop yields can be categorized as extreme nighttime temperature indices (TNx, Tn90p, TR, and FD), extreme daytime temperature indices (TXn, Tx90p, and SU), extreme precipitation indices (CDD and R95p), and extreme wind (WD). By using Random Forest (RF) approach to determine the effects of different extreme weather and climate events on the yields of different crops, we found that the importance of extreme precipitation indices (CDD and R95p) to crop yield decreased significantly over time. As well, we found that the importance of the extreme nighttime temperature (TR and TNx) for the yields of the three crops increased during 2005-2020 compared with 1990-2005. The impact of extreme temperature events on wheat, maize, and cotton yields in the TRB is becoming increasingly significant, and this finding can inform policy decisions and agronomic innovations to better cope with current and future climate warming.

1 Introduction

According to the Sixth Assessment Report of the United Nations Intergovernmental Panel on Climate Change (IPCC), frequent extreme weather and climate events can have a significant impact on global food security (Bhatt et al., 2022). Extreme weather and climate events can be defined as unusual hydrometeorological conditions and include extreme temperature and precipitation, as well as drought and windy weather. These events, along with their derivative disasters, are becoming more and more destructive to society and economy (Newman and Noy, 2023) and are expected to further intensify in the future (Zhao, 2020).
In the context of global warming, the increasing frequency of extreme weather and climate events has posed significant challenges to agricultural development and has emerged as a prominent research focus in the field of food security. Changes in temperature directly affect crop yields (Bhatt et al., 2022), threatening the availability of agricultural products and global food security, which in turn impacts socio-economic development and stability (Meerburg et al., 2009; Rezaei et al., 2023). Previous studies have demonstrated that rainfall, as well as maximum and minimum temperatures, significantly affect the yields of major crops. For instance, increased temperatures may shorten the growing period of crops and reduce the yields of many grain crops, while positively impacting the yield of seed cotton (Mahato, 2014; Guntukula, 2020; Daloz et al., 2021; Wu et al., 2021; Li et al., 2024). The impact of extreme weather and climate events on crop yields should not be overlooked. In particular, extreme temperature events are occurring more frequently, extreme nighttime temperature events are becoming more dramatic, and global nighttime temperatures are rising at 1.4 times the rate of daytime temperatures (Sadok and Jagadish, 2020). It is worth noting that each 1.0°C increase in minimum nighttime temperature increases late rice yields by 8.99%-11.28% (Wei et al., 2010). In addition to extreme temperature events, extreme precipitation and drought can also have an impact on crop yields in some regions. According to Schmitt et al. (2022), a single dry day can reduce winter wheat yields by as much as 0.36%. In the eastern United States, the combination of extreme precipitation and extreme heat is the most damaging climate pattern for crops (Eck et al., 2020). Moreover, studies have shown that wind plays a dominant role in sorghum growth and significantly affects sorghum maturity (Zhang and Liu, 2022). However, current research primarily focuses on the response of individual crop yields to meteorological hazards, lacking an analysis of the integrated response of multiple crop yields to climate change. Moreover, C3 and C4 crops respond differently to factors such as temperature extremes and water availability, which means that further research is warranted to compare the similarities and differences in yield trends of different crop types at the same spatial and temporal timescales. The specific extreme weather and climatic factors that affect the yields of different crops also need to be identified.
Current methods for studying extreme weather and climate impacts on crop growth include crop models (Chen et al., 2019) and statistical analyses (Ureta et al., 2020). Agricultural mathematical models (e.g., tiller dynamics, leaf area, and crop growth period models) and agricultural computer models (e.g., Agricultural Production Systems sIMulator (APSIM), Decision Support Systems for Agrotechnology Transfer (DSSAT), and AquaCrop) have been widely adopted in agricultural research for their ability to better capture the true mechanisms of factors affecting crop growth (Adhikari et al., 2016). For example, Li et al. (2024) used AquaCrop model to quantitatively analyze and identify the main climatic factors affecting cotton growth and found that climate change and increased CO2 levels have a positive impact on cotton production. However, the usability of crop models is greatly limited by the fact that they usually require data as inputs from a broad range of sources, such as crop parameters, management practices, soil properties, and climatic data, which are difficult to collect at the regional scale. In addition, validation of the modelling results often needs to be done in the context of field experiments. Recently, introduced statistical analyses are mainly used to analyze the relationship between actual observed historical long time series climate elements and crop growth indicators. This approach has the advantage of quantifying the factors affecting crop growth using a smaller dataset, whereas traditional linear fitting often fails to fully elucidate the complex relationships between crop yields and extreme weather and climate events (Li et al., 2016). With the development of computer technology, machine learning is gaining in popularity in the field of meteorology and agriculture. Machine learning approaches, particularly Random Forest (RF) model, have been used to directly explore the relationship between extreme weather and climate events and crop yields (Luan et al., 2020). The key advantage of RF technique is that it can investigate complex and hierarchical relationships between the predictors and the response using an ensemble learning strategy. Kuradusenge et al. (2023) predicted maize and potato yields using RF, polynomial regression, and support vector regression and found that RF model displayed superior performance on the data, as shown by its R2, mean absolute error (MAE), and residual mean square error (RMSE) values for both crops. Bowden et al. (2023) used RF to capture the key drivers affecting crop yield, while Zhang and Liu (2022) combined statistical modeling and machine learning to differentiate the effects of climate change on sorghum, peanut, and canola. Zhang et al. (2023) later applied RF model to analyze the importance of meteorological factors (precipitation, temperature and solar radiation) on the key months of double cropping rice yield, which can be a good assessment of the complex relationship between the variables. Given the excellent results of RF in related studies, this study employed RF approach to comprehensively consider the impacts of various extreme weather and climate events on wheat, maize, and cotton crop yields in the Tarim River Basin (TRB) and to explore the quantitative relationship between extreme weather and climate events and crop yields, which is key to targeting the maintenance of food security in irrigated agricultural areas.
The TRB is China's largest inland river basin. It is located in an extreme arid area characterized by little precipitation, strong evaporation, water scarcity, ecological fragility, and a sensitive and drastic response to climate change. Despite its natural aridity, the TRB has a predominantly agricultural economy, leaving it vulnerable to sudden-onset agricultural disasters and water damage caused by extreme weather and climate events (Wang et al., 2013; Hou et al., 2022). Being constrained by climatic and geographic conditions, the agricultural development in the basin is highly dependent on irrigation, with nearly all agricultural production in the region being irrigated (Zhu et al., 2023). It is worth noting, however, that irrigated agriculture adapts better to climate change conditions during the planting season than does rainfed agriculture, making it somewhat less sensitive to changing environmental circumstances (Troy et al., 2015). Yet, despite being less affected by climate change than non-irrigated regions, irrigated agricultural land can still sustain serious negative impacts on crop yields caused by extreme weather and climate events.
Therefore, in this study, RF was used to quantify the importance of ten indicators of extreme weather and climate events (tropical nights (TR), warm nights (Tn90p), max Tmin (TNx), frost days (FD), min Tmax (TXn), warm days (Tx90p), summer days (SU), consecutive dry days (CDD), very wet days (R95p), and windy day (WD)) on wheat, maize and cotton yields in the TRB. The main objectives of the research are: (1) to calculate and analyze the spatial and temporal characteristics of extreme weather and climate events in the TRB from 1990 to 2020 by collecting meteorological data (temperature, precipitation, and wind speed); (2) to analyze the spatial and temporal variation patterns of crop yields based on agricultural production data (the yields of the three selected crops); (3) to explore the extent of the impact of different extreme weather and climate events on yields changes over time, using RF to assess the importance of three different time periods (1990-2005, 2005-2020, and 1990-2020) on crop yields; and (4) to explore the response of different phenological periods of crops to extreme weather and climate events.

2 Materials and methods

2.1 Study area

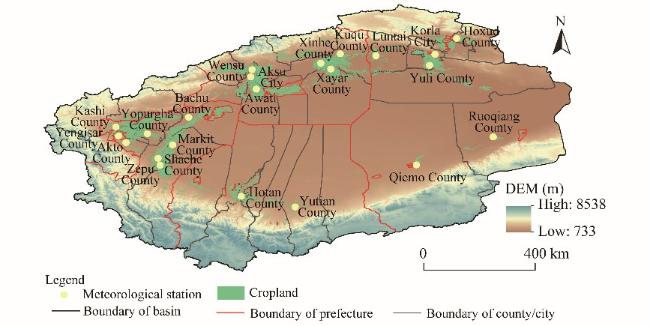
The TRB is China's largest inland river basin, covering an area of about 1.02×10⁸ hm2 (Fig. 1). It is located in the mid-latitude of the hinterland of Eurasia (35°-43°N, 74°-90°E; 1524 m a.s.l.). The TRB has a typical continental climate characterized by sparse precipitation, strong evaporation, and abundant heat and light resources. Annual temperatures range from -35.0°C to 40.0°C, annual precipitation varies from 20 to 600 mm, annual evaporation measures approximately 1800-2900 mm, and annual sunshine hours total around 2550-3500 h. Over the course of an average year, the length of the frost-free period is 190-220 d. Because of its abundant light and heat uptake, the TRB has become an important cotton and grain crop production area within China. From 1990 to 2020, the area of cultivated land increased from 2.46×10⁶ to 4.24×10⁶ hm2, with a corresponding rise in crop production. Cotton is the main cash crop in the basin and accounts for more than 40.00% of the total planting area, while wheat and maize account for around 20.00% and 15.00%, respectively (Statistic Bureau of Xinjiang Uygur Autonomous Region, 1991-2021). In this study, 22 sites in the region were selected and the detailed information is shown in Table 1.
Fig. 1 Overview of the Tarim River Basin (TRB) in 2020. DEM, digital elevation model.
Table 1 Details of the 22 meteorological stations used in this study
No. Station Prefecture Coordinate No. Station Prefecture Coordinate
1 Aksu City Aksu Prefecture 41°07′61′′N, 80°22′54′′E 2 Xinhe County Aksu Prefecture 41°32′36′′N, 82°38′57′′E
3 Awati County Aksu Prefecture 40°38′32′′N, 80°23′31′′E 4 Wensu County Aksu Prefecture 41°06′26′′N, 80°13′36′′E
5 Kuqa County Aksu Prefecture 41°43'27′′N, 82°58′13′′E 6 Xayar County Aksu Prefecture 41°15′01′′N, 82°46′09′′E
7 Korla City Bayingol Mongolian Autonomous Prefecture 41°43′49′′N, 85°49′05′′E 8 Hoxud County Bayingol Mongolian Autonomous Prefecture 42°15′57′′N, 86°51′61′′E
9 Luntai County Bayingol Mongolian Autonomous Prefecture 41°49′20′′N, 84°16′02′′E 10 Yuli County Bayingol Mongolian Autonomous Prefecture 41°20′48′′N, 86°15′47′′E
11 Ruoqiang County Bayingol Mongolian Autonomous Prefecture 39°01′26′′N, 88°11′00′′E 12 Qiemo County Bayingol Mongolian Autonomous Prefecture 38°07′59′′N, 85°32′13′′E
13 Zepu County Kashi Prefecture 38°12′00′′N, 77°15′39′′E 14 Kashi City Kashi Prefecture 39°29′09′′N, 75°45′16′′E
15 Yopurgha County Kashi Prefecture 39°14′21′′N, 76°46′04′′E 16 Yengisar County Kashi Prefecture 38°56′07′′N, 76°10′26′′E
17 Shache County Kashi Prefecture 38°25′40′′N, 77°14′30′′E 18 Markit County Kashi Prefecture 38°54′39′′N, 77°38′26′′E
19 Bachu County Kashi Prefecture 39°47′50′′N, 78°34′15′′E 20 Hotan City Hotan Prefecture 37°07′14′′N, 79°55′29′′E
21 Yutian County Hotan Prefecture 36°51′25′′N, 81°39′00′′E 22 Akto County Kizilsu Kirgiz Autonomous Prefecture 39°08′07′′N, 75°56′39′′E

2.2 Data sources

This study used meteorological observation data from 22 meteorological stations in the TRB from 1990 to 2020 (Fig. 1). The data were obtained from the China Meteorological Administration (http://data.cma.cn/). The main meteorological factors extracted from the data were maximum air temperature, minimum air temperature, average air temperature, average wind speed, maximum wind speed, and relative humidity. These meteorological elements were daily-scale data that have been used by other crop climate modeling institutes and show good continuity and good quality, while missing only a few values.
The production data for wheat, maize, and cotton were obtained from Statistic Bureau of Xinjiang Uygur Autonomous Region (https://tjj.xinjiang.gov.cn/), which covers a long-term dataset for these crops. Data on the sowing area of wheat, maize, and cotton for 22 sites from 1990 to 2020 were sourced from the Xinjiang Statistical Yearbook (Statistic Bureau of Xinjiang Uygur Autonomous Region, 1991-2021).
Phenological period data for wheat, maize, and cotton were obtained from agrometeorological experiment stations located in Hotan City. After preprocessing the collected data, we found that crop phenology data had more missing values and poorer data quality prior to 2016; therefore, this study investigated phenology changes in wheat, maize, and cotton based on phenology data from 2016 onward.
To verify whether the effects of extreme weather and climate events on crop yields and phenology are valid, this study collected Climate Bulletin data of Hotan City from the Xinjiang Uygur Autonomous Region Meteorological Service (http://xj.cma.gov.cn/) from 2016 to 2020. The data were then used to cross-check and verify the impact of extreme weather and climate events on crops.

2.3 Methodology

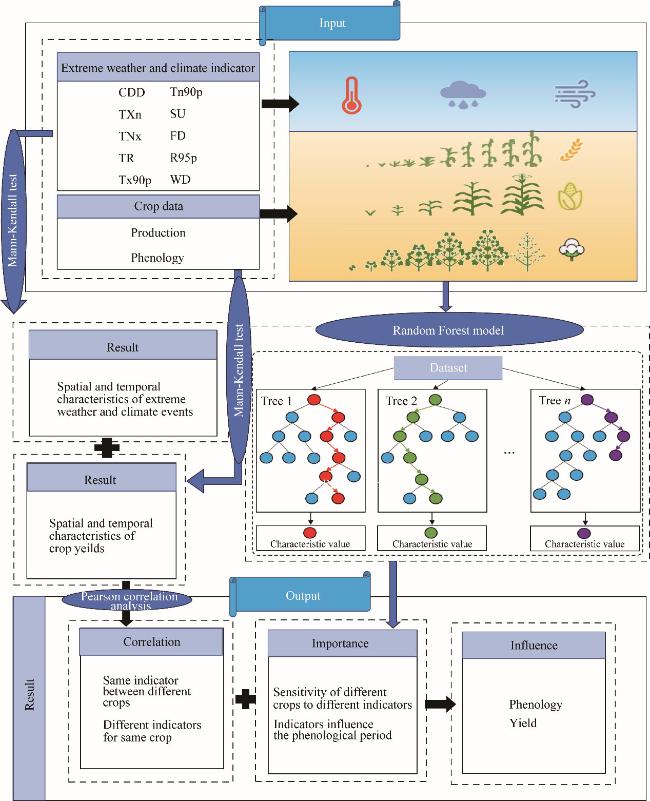
The main steps of this study included data collection, analysis of the spatial and temporal characteristics of extreme weather and climate events, analysis of the spatial and temporal variation of crop yields, correlation analysis, importance assessment, and exploration of crop phenological responses. The specific process is shown in Figure 2.
Fig. 2 Flowchart of this study. CDD, consecutive dry days; TXn, min Tmax; TNx, max Tmin; TR, tropical nights; Tx90p, warm days; Tn90p, warm nights; SU, summer days; FD, frost days; R95p, very wet days; WD, windy days.

2.3.1 Identification of extreme weather and climate events

Nine extreme temperature and precipitation indices and one wind indicator were used in this study, many of which are commonly employed to climate model simulations (Peterson and Manton, 2008). Table 2 presents a detailed description of the indices and indicators, which include TR, Tn90p, TNx, FD, TXn Tx90p, SU, CDD, R95p, and WD. Extreme indices representing temperature and precipitation were calculated from daily scale meteorological data. According to a previous study, extreme precipitation in China's northwestern arid area is mainly distributed in the mountainous areas, whereas precipitation is relatively low in the plains (Shen et al., 2020). Moreover, because crop yields in the irrigated agricultural areas of the plains appear to be less affected by precipitation, only two extreme precipitation indicators (CDD and R95p) were selected for comparative study. Depending on the meaning of the selected extreme temperature indicators, we can classify the temperature indicators that represent daily minimum temperature as extreme nighttime temperature indicators (TNx, Tn90p, TR, and FD) and the temperature indicators that represent daily maximum temperature as extreme daytime temperature indicators (TXn, Tx90p, and SU). In the TRB, high wind events mostly occur during the crop growing season. The indicator of WD was thus chosen as one of the extreme wind event indicators.
Table 2 Typical extreme weather and climate event indices
Category Indicator Description Unit
Extreme nighttime temperature event Tropical nights (TR) Number of days with daily minimum temperature (TN)>20.0°C d
Warm nights (Tn90p) Percentage of days with TN>90th percentile %
max Tmin (TNx) Highest value of TN °C
Frost days (FD) Number of days with TN<0.0°C d
Extreme daytime temperature
event
min Tmax (TXn) Lowest value of daily maximum temperature (TX) °C
Warm days (Tx90p) Percentage of days with TX>90th percentile %
Summer days (SU) Number of days with TX>25.0°C d
Extreme precipitation event Consecutive dry days (CDD) Largest number of consecutive days with daily precipitation (PR)<1 mm d
Very wet days (R95p) Total precipitation of very wet days with PR>95th percentile mm
Extreme wind event Windy days (WD) Number of days with maximum wind speed>10.6 m/s d
Due to the different growing seasons of the different crops, we categorized the calculation of extreme weather and climate indices based on these differences. We preprocessed the raw climate data according to the average growing season of crops in the historical period, and then calculated the extreme weather and climate indices for different crop growing seasons.

2.3.2 Mann-Kendall trend test

The Mann-Kendall trend test is used to detect temporal trends in extreme weather and climate events and yield-related variables (Mann, 1945; Kendall, 1973; Yue and Wang, 2002). The method takes into account the effect of autocorrelation in the time series. Compared with parametric statistics, its advantage is less sensitive to outliers and does not need normality or linearity assumptions. The magnitude of the trends was determined using Theil-Sen's slope (Sen, 1968; Gilbert, 1987), which is both effective and robust, as it excludes the influence of outliers. The significance level (α) was set at 0.05 in the current study, and the trends were classified into five categories: significant increasing trends (Sen's slope> 0 and α<0 .05), insignificant increasing trends (Sen's slope>0 and α>0.05), significant decreasing trends (Sen's slope<0 and α<0.05), insignificant decreasing trends (Sen's slope<0 and α>0.05), and stationary trends (Sen's slope=0).

2.3.3 Pearson correlation analysis

Pearson correlation analysis is a conventional method for finding the relationship between two variables and can be used to exclude features that are poorly correlated with the target variable. Correlation coefficient values basically indicate which climate variables are significant for crop yield at a certain level of significance (Li et al., 2024). The Pearson correlation test was used to analyze the relationship between two variables at a 0.05 level of significance.

2.3.4 RF

In this study, RF was used to determine the extent of the importance of different extreme weather and climate events on the yields of three crops. RF is an integrated learning algorithm developed by Breiman (2001) and is a nonparametric technique based on classification and regression trees. Using RF, we can explore complex and hierarchical relationships between predictors and responses. RF has been extensively applied in agricultural research, showing high accuracy and the ability to model complex interactions between variables (Jeong et al., 2016). However, this method behaves like a black box, as the trees cannot be examined individually and it does not compute regression coefficients or confidence intervals (Cutler et al., 2007). The RF does nonetheless produce a variable importance list that can be compared with other regression models. The relative importance of variables is estimated using the increase in mean squared error (%IncMSE) values. The %IncMSE represents the average increase in the mean square error when the values of the variables are randomized at the nodes where the variables are used in RF model (Feng et al., 2018). In order to investigate whether there is a difference in the extreme weather and climate events that have a major impact on crop yields before and after 2005, we divided the study period (1990-2020) time series into two parts: 1990-2005 and 2005-2020. The %IncMSE is based on the out-of-bag (OOB) regression prediction error (Zhang et al., 2023):
MS E OOB = 1 n i = 1 N D i D OOB , i 2,
where MSEOOB is the mean square error; N is the total number of samples, indicating the number of samples used in the OOB calculation; n is the number of observations; Di is the actual value of the ith sample; and DOOB,i is the average of all OOB predictions across all trees in RF.
To estimate the variance of yield anomalies explained by extreme weather and climate events, we computed RMSE and consistency coefficient (d) from cross-validated out-of-sample predictions for evaluating the accuracy of model fit, as follows (Zhang and Liu, 2022):
RMSE= 1 n i = 1 N y i y ^ 2,
d = 1 i = 1 N y ^ y i 2 i = 1 N y ^ y ¯ + y i y ¯ 2,
where yi is the predicted value of crop production; y ^ is the actual value of crop production; and   y - is the average value of crop production. The smaller the RMSE value, the more stable the model and the better the prediction ability (Jacovides and Kontoyiannis, 1995). Here, the value of d is 0-1, with values closer to 1 indicating a better simulation (Legates and McCabe Jr., 1999).

3 Results

3.1 Spatial and temporal changes of typical extreme weather and climate events in the TRB

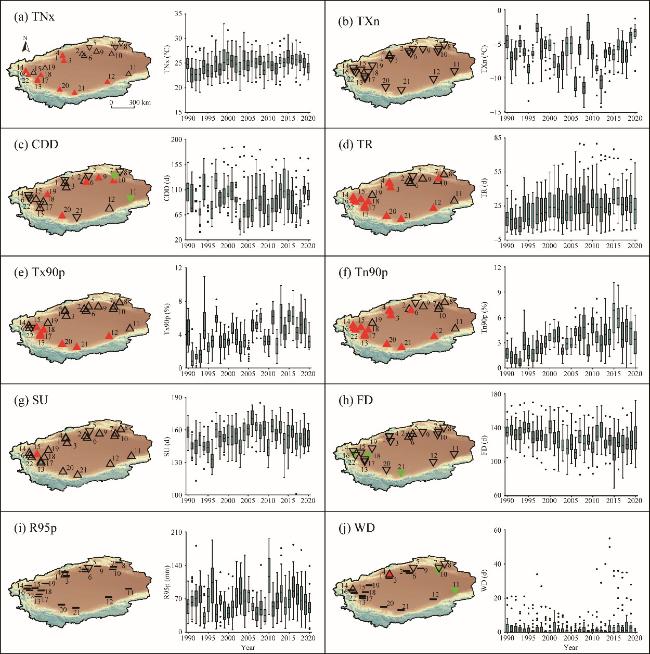
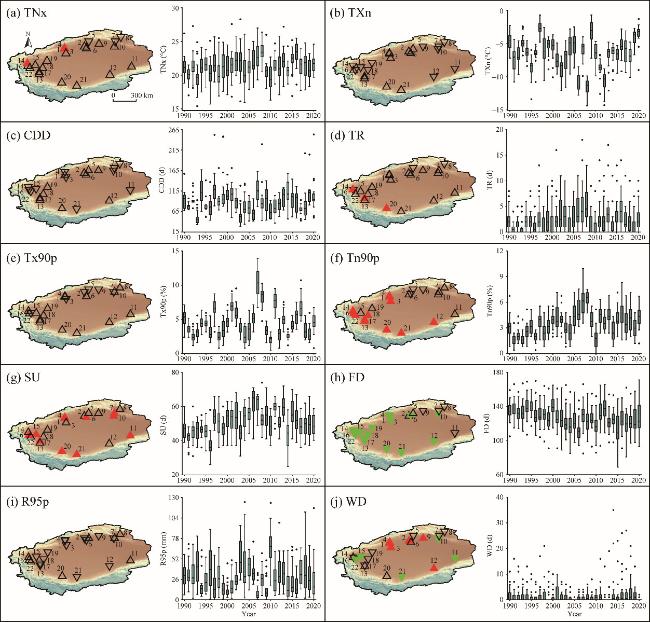
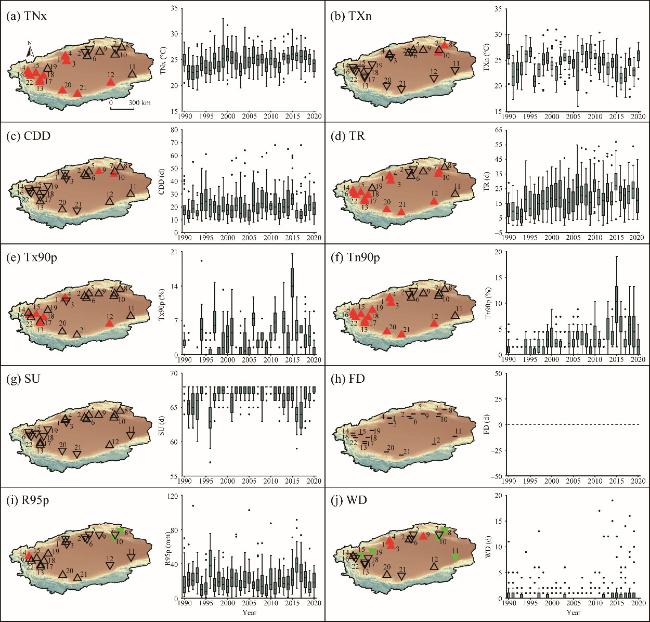
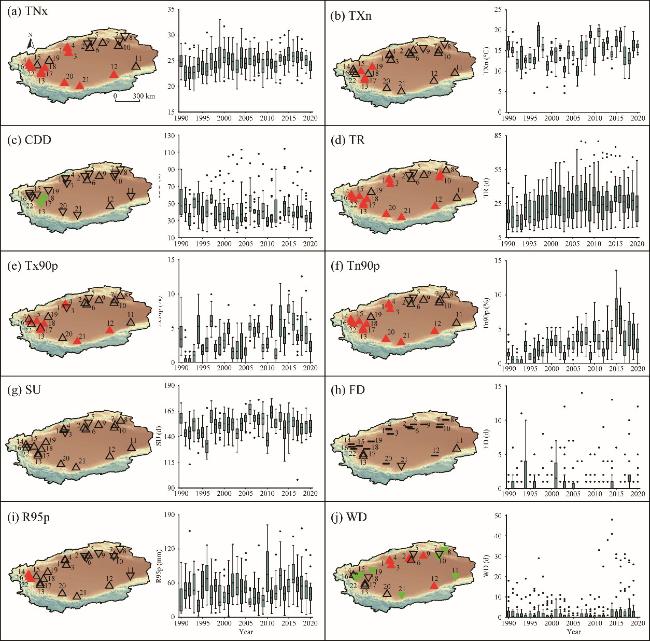
The spatial and temporal variations of the ten selected extreme weather and climate indicators (CDD, TXn, TNx, TR, Tx90p, Tn90p, SU, FD, R95p, and WD) at 22 sites in the TRB from 1990 to 2020 are shown in Figure 3. Figures S1, S2, and S3 illustrate the spatial and temporal variations in the same ten indicators during the growing seasons of different crops. We calculated the sowing and harvest dates for the three crops based on historical average values. Specifically, the growing season for wheat is from 3 October to 13 June of the following year, for maize is from 24 June to 1 September, and for cotton is from 11 April to 20 October.
Fig. 3 Temporal and spatial distribution of trends and index changes of typical extreme weather and climate events in the TRB from 1990 to 2020. (a), TNx; (b), TXn; (c), CDD; (d), TR; (e), Tx90p; (f), Tn90p; (g), SU; (h), FD; (i), R95p; (j), WD. In the left figures, positive triangles indicate increase, inverted triangles represent decrease, and the symbol "-" denotes no change. Hollow triangles indicate no significant trend, and red and green colors signify a significant increase and a significant decrease, respectively. In the right figures, the black horizontal line represents the median, the boundaries of the boxed line correspond to the 25th and 75th percentiles (quartiles), and black dots denote outliers. 1, Aksu City; 2, Xinhe County; 3, Awati County; 4, Wensu County; 5, Kuqa County; 6, Xayar County; 7, Korla City; 8, Hoxud County; 9, Luntai County; 10, Yuli County; 11, Ruoqiang County; 12, Qiemo County; 13, Zepu County; 14, Kashi City; 15, Yopurgha County; 16, Yengisar County; 17, Shache County; 18, Markit County; 19, Bachu County; 20, Hotan City; 21, Yutian County; 22, Akto County.

3.1.1 Changes in extreme daytime temperature events

Most of the indicators (except for TXn) showed an increasing trend for extreme daytime temperature, with a more pronounced increasing trend in southeastern TRB. Across most of the TRB (except Aksu City and Wensu County), TXn had a non-significant decreasing trend, with changes ranging from -14.4°C to -0.7°C (Fig. 3b). For the maize growing season, TXn exhibited an increasing trend in the northeastern part of the TRB, with two sites showing a significant increase (Fig. S2), while for the cotton growing season, TXn showed an increasing trend in the western region, with three western sites showing a significant increase (Fig. S3).
For Tx90p, the changes ranged from 2.42% to 25.09% and trended overall upward from 1990 to 2020. A very significant upward trend was displayed in the southwestern part of the study area, where the maximum Tx90p reached 43.90%, while minimum Tx90p was mostly found in the eastern and northern TRB (Fig. 3e). For the wheat growing season, the trend in Tx90p was not significant, moving only slightly upward in the northeastern region and downward elsewhere spatially (Fig. S1).
The range of SU varied from 113 to 185 d, and its overall changes displayed a slow upward trend from 1990 to 2020. In contrast, Yopurgha County, located in the western part of the study area, showed a major upward trend (Fig. 3g). For the wheat growing season, SU had a significant upward trend in most sites (Fig. S1), whereas the maize and cotton growing seasons showed no significant upward trend in SU (Figs. S2 and S3). This suggested that the daytime warming trend in the TRB was more pronounced in spring and winter.

3.1.2 Changes in extreme nighttime temperature events

For the extreme temperature indices representing nighttime temperatures, the warming trend was obvious in most areas, but especially in southwestern TRB. TNx varied between 19.1°C and 33.0°C and showed upward movement, with the southwestern part of the basin trending substantially higher. The northern part of the region, however, displayed a slight downward trend (Fig. 3a). TNx during the growing season for maize and cotton revealed a significant upward trend in most parts of the southwest (Figs. S2 and S3).
The variations in Tn90p ranged from 2.07% to 34.82% and were markedly upward, except for northeastern TRB (e.g., Xinhe County and Kuqa County), where the upward trend was not very pronounced (Fig. 3f). During the growing seasons of the three different crops, Tn90p showed a significant increasing trend in most of the western and southern parts of the study area (Figs. S1-S3). It is worth noting that the increase in Tn90p was larger than that of Tx90p, which indicates a more pronounced rise in the percentage of days of extreme nighttime temperatures over most areas.
Meanwhile, changes in TR ranged from 0 to 80 d and exhibited an overall upward trend, except for Xinhe County in the northeast. The annual count of daily minimum temperatures exceeding 20.0°C was as high as 80 d for Hotan City (southern TRB) in 2007 and 2011 (Fig. 3d). There was an obvious upward trend in TR during the maize and cotton growing seasons at most of the sites (Figs. S2 and S3), suggesting a gradual warming during the summer nights in the TRB.
Variations in FD ranged from 74 to 166 d and exhibited a decreasing trend, with a significant drop in Yutian County, Zepu County, and Akto County (southwestern TRB). Hoxud County (northeastern TRB) had the highest number of FD in 1996, while Hotan City (southern TRB) had the lowest in 2015 (Fig. 3h). The decreasing trend in FD during the wheat growing season was significant at most sites (Fig. S1), suggesting progressively warmer nights in spring and winter.

3.1.3 Changes in extreme precipitation events

On a temporal scale, CDD had a slight downward trend in the TRB from 1990 to 2020, showing an average rate of decline of 4.7 d/10a. Spatially, however, CDD had a clear increasing trend in northern TRB, insignificant changes in western TRB, and an obvious downward trend in eastern TRB (Fig. 3c). For the different crop growing seasons, CDD charted a slight downward trend in most areas, though the trend was not significantly characterized (Figs. S1-S3).
Similarly, changes in R95p across the entire region were generally insignificant, showing only a slight tendency to increase (at a rate of 0.10%/10 a) while remaining constant at most sites. Total precipitation for very wet days was likewise mostly low, mainly because the TRB is an arid area that has remained largely constant over the 30-a period at most of the examined sites, other than for a slight downward trend in the northern areas (Fig. 3i). This situation was also reflected in the R95p of different crop growing seasons, with no significant trend emerging (Figs. S1-S3). Overall, the TRB experienced a decrease in persistent drought and a slight increase in rainfall over a 30-a period, particularly in the mountainous northwest.

3.1.4 Changes in extreme wind event

Although the number of WD from 1990 to 2020 was mostly unchanged, there has been an increasing trend in recent years. From April to August of 2001 crop growing season, WD increased slightly. Then, from 2014 to 2020, WD increased substantially. In terms of spatial scale, WD also remained basically unchanged, other than for an increasing trend in northwestern TRB and a decreasing trend in the northeast (Fig. 3j). In terms of different crop growing seasons, an increasing WD trend was obvious in the northern part of the study area (Aksu City) while there was a clear downward trend in some counties in the west and east part of the study area (Figs. S1-S3).
On the whole, all the extreme indicators related to warmth were trending upward, with TR trending upward the most. By comparison, the trend of increasing temperature extremes at night was higher than increased extremes during the day, with these events showing some differences in location, with a more pronounced increase in western and southern TRB and a slower increase in the eastern and northern areas. The extreme precipitation indicators also revealed a drying trend across the study area, mainly in the form of a slight increase in the number of sustained dry days, with the trend particularly pronounced in the north. Meanwhile, changes in the average number of WD also showed an increasing trend across the basin, with the weather changes becoming more and more unstable. Furthermore, although the extreme indices showed roughly similar trends in the different crop growing seasons as they did throughout the year, we noted a major increasing trend in SU and a significant decreasing trend in FD during the wheat growing season compared with the growing seasons of the other two crops. These changes suggested that there was a more pronounced warming trend in the TRB during the spring and winter seasons.
At the same time, we found that the increasing trend of many extreme weather and climate indicators (such as TNx, TR, and Tn90p) only existed in the first half of the study period (1990-2005), as they weakened in the second half (2005-2020). Next, we will focus on whether the same trend is reflected in the yield changes of the three studied crops.

3.2 Characterizing changes in yields of major crops in the TRB

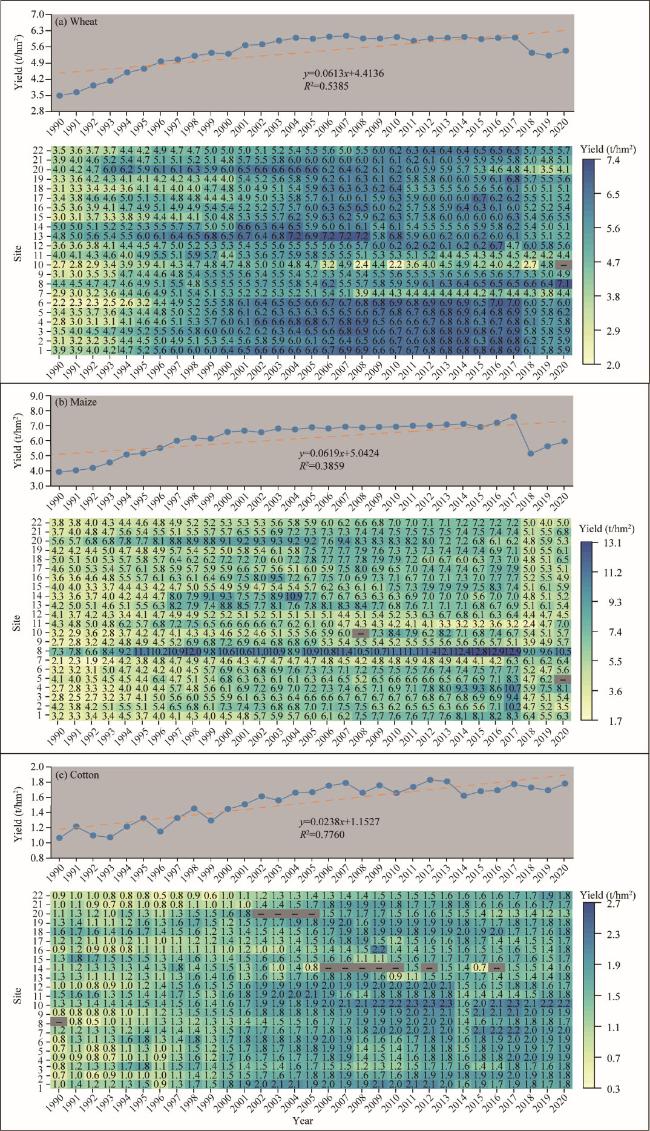
The TRB is a vast area dominated by irrigated agriculture. However, due to the basin's geographical location, the various regions within the TRB are subject to different rainfall and heat conditions and extreme weather and climate events, resulting in significant spatial heterogeneity of crop yields. For example, wheat is a major crop in the basin. As can be seen in Figure 4a, wheat yield was higher in the Aksu Prefecture (northern TRB) than in the other regions, while wheat yield in the Byingol Mongolian Autonomous Prefecture (southeastern TRB) was the lowest among the five prefectures. The entire region had been showing an increasing trend in wheat yield since 1990, but there was a sudden decrease in 2018, with an average yield 11.07% below that in 2017 and continued lower wheat yield in 2019 and 2020. Specifically, in 2018, wheat yields in Aksu, Kizilsu, Hotan, and Kashi prefectures were reduced, though no similar trend of reduction was found in the Byingol Mongolian Autonomous Prefecture for that year. Overall, wheat production in the region demonstrated a significant increasing trend from 1990 to 2020 despite yield differences and variations in individual regions (Fig. 4a).
Fig. 4 Graphs of wheat (a), maize (b), and cotton (c) yields and their variation trends from 1990 to 2020. The yellow dashed line indicates the trend, and the gray area in the heat map represents missing data.
Maize is also widely planted in the TRB. From Figure 4b, we can see that per-unit-area maize yields in Hoxud County, which is located in the Byingol Mongolian Autonomous Prefecture in northeastern TRB, were more than twice as high as those in some other regions. Like wheat, maize yields across the basin suddenly declined by 32.46% in 2018. Although they recovered slightly in 2019 and 2020 compared with 2018, the yields were still much lower than before. However, since 1990, maize yields across the basin have been trending upwards (Fig. 4b).
Cotton is an important cash crop in the TRB. It accounted for more than 50.00% of the total sown area in Byingol and Aksu prefectures (northeastern TRB) and for more than 35.00% of Kashi Prefecture's total sown area (southern TRB). From Figure 4c, we can see that cotton yield was higher in the Byingol and Aksu prefectures than anywhere else in the study area. Furthermore, from the line graph, we can see that cotton yield showed a significant negative anomaly in 2014. However, unlike wheat and maize, cotton did not display a significant downward in 2018. On the whole, cotton unit area yield has shown an increasing trend since 1990 (Fig. 4c).
Wheat, maize, and cotton yields have all been reduced to varying degrees in particular years during the study period due to extreme weather and climate events. Based on our collected data, we found that typical extreme weather and climate events primarily occurred in the southwestern part of the TRB. We also found that the highest crop yields were mainly in the northeastern part of the TRB. Additionally, we discovered that the yields of the three major crops showed a clear upward trend prior to 2005 and then slowed matching the trend of extreme weather and climate events in the results of Section 3.1. In order to explore this issue and to clarify what kind of extreme weather and climate affects which crops in different time periods, we carried out a follow-up study.

3.3 Impacts of extreme weather and climate events on major crop yields

3.3.1 Correlation analysis between yields of major crops and extreme meteorological factors

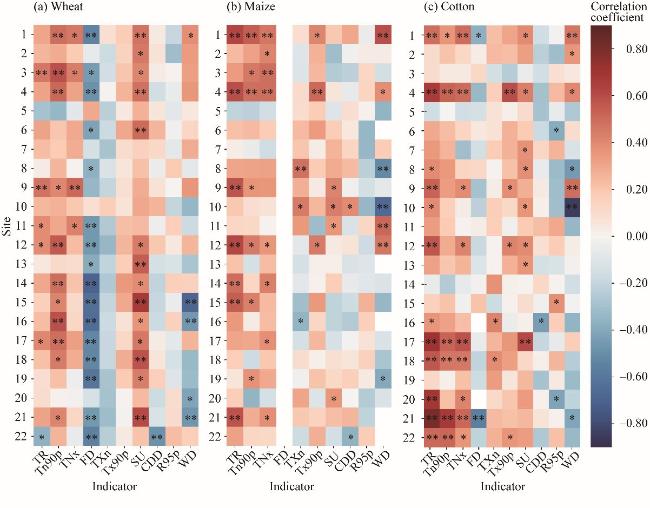
Figure 5 presents the Pearson correlation coefficients between the yields of wheat, maize, and cotton and the extreme weather and climate events of their corresponding growing seasons. We found that extreme nighttime temperature indices (TR, Tn90p, TNx, and FD) in the TRB had a positive effect on wheat yield. Among them, TR showed a positive correlation with wheat yield at 20 sites and significant positive correlation at 5 sites, while Tn90p and TNx showed a positive correlation at 21 and 18 sites, respectively, and a significant positive correlation at 11 and 4 sites, respectively. FD displayed a significant negative correlation with wheat yield at 16 sites. For wheat, higher extreme nighttime temperature and a decrease in the number of cold-night days at most sites resulted in higher yields. Among the extreme daytime temperature indices, SU was significantly and positively correlated with wheat yield at 14 sites, and TXn and Tx90p, exhibited positive correlations with wheat yield. Higher extreme daytime temperature and a higher number of warm days resulted in higher wheat yields. Extreme precipitation (CDD and R95p) and windy day (WD) indices were only weakly correlated with wheat yield and varied across sites.
Fig. 5 Pearson correlation coefficients of wheat (a), maize (b), and cotton (c) yields with extreme weather and climate indices at 22 sites in the TRB from 1990 to 2020. *, significance at P≤0.05 level; **, significance at P≤0.01 level.
For maize, the extreme nighttime temperature indices (TR, Tn90p, and TNx) were positively correlated with yield at 21, 17, and 19 sites, respectively, reaching significant positive correlations at 7, 7, and 8 sites, respectively. The lack of correlation between FD and maize yield was likely due to the fact that the maize growing season is in the summertime, when frost days do not exist. Extreme daytime temperature indices (TXn, Tx90p, and SU) varied in their correlation with maize yield at different sites, being positively correlated with maize yield in the northern part of the TRB and negatively correlated with maize yield in the southeastern part. The correlation between extreme daytime temperature and maize yield was weak and varied (positively or negatively) from site to site. This is due to the smaller trend of change in extreme daytime temperature during the summertime. Similar to wheat, the extreme precipitation (CDD and R95p) and WD indices were weakly correlated with maize yield.
For cotton, the yield was positively correlated with TR, Tn90p, and TNx at 20, 20, and 17 sites, respectively, with significant positive correlations reaching at 12, 6, and 9 sites, respectively. Similar to wheat yield, cotton yield was negatively correlated to FD at most sites, whereas extreme daytime temperature indices (TXn, Tx90p, and SU) were positively correlated to cotton yield. This indicated that rising extreme daytime temperature and days in the spring and summer increase cotton yields. Extreme precipitation indices (CDD and R95p) were weakly positively correlated with cotton yield, as they were with wheat and maize yields, but WD was negatively correlated with cotton yield at most sites.
Overall, increases in extreme nighttime temperatures and decreases in the number of cold-night days increased the yields of the three studied crops. However, extreme precipitation indicators were not strongly correlated with the yields of these crops, and WD affected cotton yields more strongly than those of the other two crops.

3.3.2 Importance analysis between crop yields and extreme meteorological factors

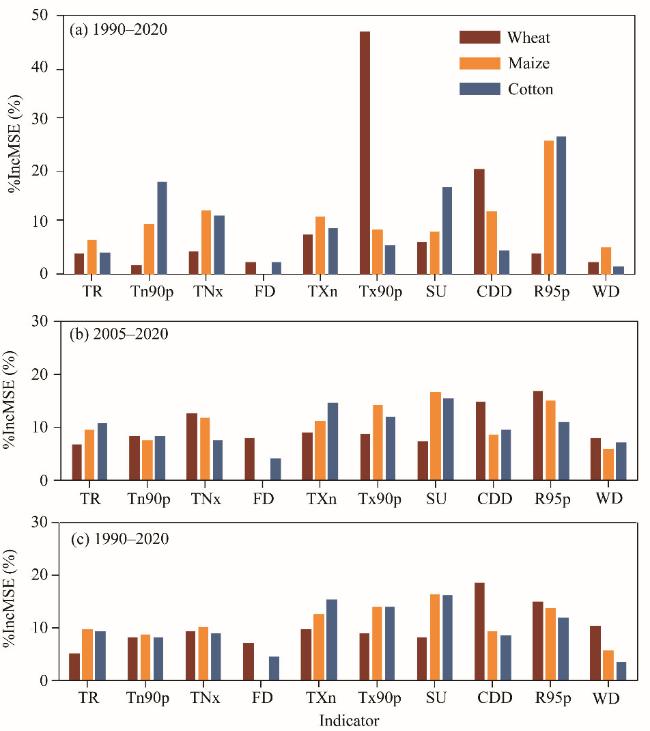
To ensure the credibility of the study, we evaluated the results of RF model. In the validation, the values of RMSE for wheat during 1990-2005, 2005-2020, and 1990-2020 were 87.8, 230.3, and 208.5 kg/hm2 with d-values of 0.63, 0.87, and 0.89, respectively. The values of RMSE for maize during 1990-2005, 2005-2020 and 1990-2020 were 64.8, 617.7, and 479.1 kg/hm2 with d-values of 0.89, 0.75, and 0.83, respectively. The values of RMSE for cotton during 1990-2005, 2005-2020, and 1990-2020 were 159.3, 97.3 and 122.6 kg/hm2, with d-values of 0.60, 0.87, and 0.84, respectively. Although there were some variations in model accuracy across periods and crops, these were within acceptable limits. As the yields of these crops were affected by a variety of extreme weather and climate events, RF provided importance weights to better measure the importance of the variables in the complex model and to identify the key extreme meteorological factors. The results of the importance of each extreme meteorological factor corresponding to different crops for different time series are shown in Figure 6.
Fig. 6 Variable importance of typical extreme weather and climate events for different crops after standardization. (a), 1990-2005; (b), 2005-2020; (c), 1990-2020.
During 1990-2005, for wheat, Tx90p had the largest effect on yield, with the %IncMSE of 46.95%, followed by CDD with the %IncMSE of 20.28%, while extreme nighttime temperature indices had a relatively small effect. For maize and cotton, R95p had the greatest impact on their yields, with the %IncMSE both reaching 25.00%. The SU and Tn90p were also relatively important for cotton yields, with both the %IncMSE of about 18.00%. Over time, the importance of Tx90p for wheat yield decreased significantly and the importance of CDD decreased slightly, whereas the importance of extreme nighttime temperature indices (TR, Tn90p, TNx, and FD) increased, as did the importance of extreme precipitation index R95p. However, there was a decrease in the effect of R95p for maize and cotton yields and an increase in the effect of extreme daytime temperature indices (TXn, Tx90p, and SU) for maize and cotton yields. The importance of TR for the yields of all three crops increased only slightly. Overall, the extreme daytime temperature indices (TXn, Tx90p, and SU) had the greatest impact on maize and cotton yields, and the extreme precipitation index (R95p) had a significant effect on the yield of all three crops.

3.4 Impact of extreme weather and climate events on crop phenology

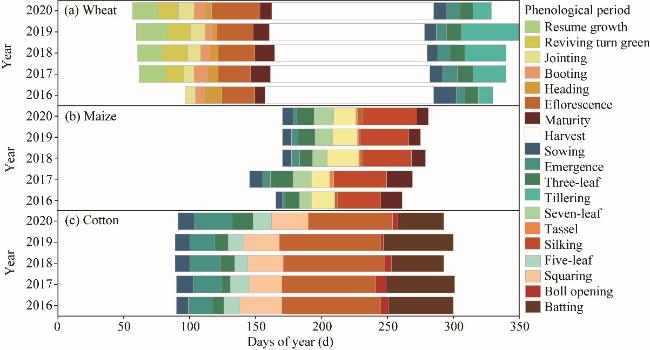
In order to investigate exactly which phenological period of the crops is affected by extreme weather and climate events, we mapped the climatic periods based on the last five years of the phenological periods of the three crops (Fig. 7) and investigated the relationships in conjunction with the current year's Climate Bulletin. According to the extreme weather and climate events in the previous section and in combination with the Climate Bulletins of previous years, we found that high temperatures appeared early in the summer of 2016, so the phenological period of crops showed an earlier trend than in previous years. In August 2017, however, temperatures across the entire study area plunged, detrimentally affecting agricultural production. This was the first time in ten-years that the average temperature in August was so low. The result was a prolonging of the onset of the maize silking period, as maize is a crop that requires high caloric conditions.
Fig. 7 Intra-annual distribution of the phenological periods for wheat (a), maize (b), and cotton (c) in Hotan City from 2016 to 2020
Strong cold air activity continued into 2018, and the lack of heat reduced the wheat and maize yields. The year of 2018 also marked the coldest autumn in Xinjiang Uygur Autonomous Region (hereinafter abbreviated as Xinjiang) in the past 18 a, and the unusually early first frost had a serious negative impact on the winter wheat seedling three-leaf and tillering periods. A further consequence of the abnormally early cold temperatures was the delay in the reviving turn green period of wheat at the beginning of 2019. This, combined with unseasonably cool temperatures, rainfall, and high winds in late spring, led to a significant reduction in wheat yields.
Moreover, hailstorms across the TRB in May 2019 caused severe damage to cotton in numerous locations, resulting in a decrease in cotton yields in that year compared with previous years. In addition, rare heavy rainfall occurred in June, when maize was at the emergence and three-leaf stage. The untimely torrents led to a prolongation of the emergence and three-leaf stage, and maize yields again reduced. The temperature rise in February-March 2020 led to an earlier resumption of the wheat growing period compared with 2017-2019. Late spring, however, was characterized by extreme rainfall in the western portion of the southern TRB, which lengthened the spring phenological period for cotton. In 2020, summer temperatures were the lowest in nearly a decade, lengthening the phenological period for maize and delaying the harvest date.
By combining the above reported the extreme weather and climate events, we found that they affected the crops mainly by prolonging the phenological period and reducing crop yields. Further, we found that low temperatures and rainstorms lengthened the phenological period of crops, which then prolonged the harvesting period and resulted in loss of time and manpower. Damage to crop yields mostly occurred from extreme weather and climate events such as extreme winds and hailstorms. We also noted, through examples from previous years, that such extreme weather and climate events can cause very serious damage to crop yields.
However, each type of crop responded differently to extreme weather and climate events. For instance, maize, as a C4 crop, was more tolerant to high temperatures than wheat and cotton, which are C3 crops. Being high temperature-tolerant, maize did not respond as obviously and negatively to increases in Tn90p as the other two crops. Moreover, at certain ranges of high temperatures, maize may even increase yields and its phenological period will be shortened.

4 Discussion

4.1 Changes in extreme weather and climate events during different crop growing seasons

Our study found a significant increasing trend in the extreme index representing warmth in the TRB, while the extreme indices representing cold showed a robust decline, findings which were emphasized by previous studies (Khan et al., 2021; Guan et al., 2022; Yang and Chang, 2024). Furthermore, although extreme precipitation and drought events in the TRB showed no significant time-scale trends from 1990 to 2020, but there was strong spatial heterogeneity, which is consistent with the results of other studies on arid areas (Xu et al., 2021). The reasons for this phenomenon may be related to anthropogenic forcing in different regions (Zou et al., 2021). Meanwhile, this study also found that the corresponding changes in extreme weather and climate event indicators varied in different crop growing seasons, and that increases in TR were more pronounced during the maize and cotton growing seasons. Similar conclusions were drawn in a study by Tao et al. (2017), who found that high summer temperatures in Xinjiang coincided with El Niño events. In addition, our study discovered a significant increasing trend in SU along with a significant decreasing trend in FD during the wheat growing season, which may be due to the fact that the rate of temperature increase in winter in Xinjiang is greater than that in other seasons (Yin et al., 2020; Li et al., 2021).
The increasing frequency of extreme weather and climate events is mainly influenced by the large-scale circulation of Earth's atmosphere (Horton et al., 2015). Research indicates that the occurrence of extreme temperature events in parts of Asia and Europe is caused by an increase in anticyclonic circulation (Zhang et al., 2012b), while the increase in extreme precipitation in Xinjiang is driven by a combination of high-, mid-, and low-latitude atmospheric circulation systems in Central Asia, whose main sources of water vapor are the North Atlantic and Arctic Oceans (Guan et al., 2019; Guan et al., 2022).

4.2 Impact of extreme weather and climate events on the growth and yield of three crops

Our study analyzed the response of wheat, maize, and cotton yields to different typical extreme weather and climatic events. We found that the crop yields were primarily related to extreme temperature events, as was also found by previous studies (Li et al., 2020; Zhang and Liu, 2022). Vogel et al. (2019) discovered that temperature-related weather extremes were more strongly correlated with yield anomalies in crops (wheat, maize, soybean, and rice) than precipitation-related factors, while our study noted that crop yields were particularly sensitive to extreme nighttime temperatures, with yields of wheat, maize, and cotton positively correlated with increased extreme nighttime temperature. With results similar to ours, Zheng et al. (2017) conducted field-warming experiments at four sites and analyzed 36 a of winter wheat yield data, uncovering that daily minimum temperatures were positively correlated with wheat yields, and that the increase in yield due to warming was attributed to an increase in grain weight. Extreme precipitation and drought affect crop yields differently for different regions (irrigated and rainfed agriculture areas). Meanwhile, researchers concluded that drought is the most relevant climate extreme for crop production in Germany (Schmitt et al., 2022) and precipitation and CDD were the main causes of soybean yield variability in the rainfed agricultural region of northeastern China (Guo et al., 2022). Conversely, our study found that the correlations between extreme precipitation and drought and the yields of the three selected crops were low. This is because the TRB is an irrigated agricultural area and is less affected by extreme precipitation and drought. Another reason why the impacts on crop yields are lower is that irrigated agricultural zones adjust the amount of water used for irrigation, which moderates the negative impacts of extreme precipitation and drought (Zhang et al., 2012a). In addition to temperature and precipitation, we found that wind also has an impact on crops. Through our study, we discovered that cotton yields are more responsive to wind compared with the yields of the other two crops. Windy weather in the TRB mainly occurs in late May, during the true-leaf growth period of cotton, when cotton may lose leaves and stems due to damage caused by strong winds (Abdullaev and Sokolik, 2020). Combined with the data collected from Climate Bulletins, we found that frequent extreme wind events occurred during the cotton growing season in 2014. These events had a significant impact on the growth, yield, and quality of the cotton in northeastern and northern TRB, showing a reduction of 10.00% in yields compared with the previous year. A study by Zhang and Liu (2022) also found that wind dominated sorghum heading dates and had a negative impact on the reproductive growth period of that crop. Losses of wheat per hectare from extreme weather and climate events, such as severe storms, amounted to 1604.94 kg (Elahi et al., 2022). The effects of specific extreme events on crop growth, however, require further research.
Furthermore, this study found that the yields of different crops subjected to extreme weather and climate events responded in different ways. According to a previous study, wheat and cotton are C3 crops and maize is a C4 crop (Srinivasarao et al., 2016) and that under drought stress, elevated CO2 only had a compensatory effect on the yield of C4 crops (maize, millet, and sorghum) compared with C3 crops (wheat and rice) (Rezaei et al., 2023). This is because temperature changes have a greater negative impact on C3 crops than on C4 crops, i.e., C4 crops are more tolerant of high temperatures (Wang et al., 2023). At the same time, other research suggested that warmer extreme nighttime temperature may have extended the growing season for maize, allowing more time for maize to grow and build yield (Mueller et al., 2015). In non-irrigated areas, crops tend to have an increased rate of evaporation of soil moisture due to higher nighttime temperatures. This may lead to an increased need for irrigation, which could have a negative impact on yields if there is an insufficient supply of water. However, the TRB is highly irrigated, so water supply is adequate and increases in extreme nighttime temperature have less negative impact on crop yields (Zhu et al., 2022). The general conclusion is that C4 crops (e.g., maize) are more tolerant to high temperatures than C3 crops (e.g., wheat and cotton), and therefore, in the context of increased temperature extremes in irrigated areas, C4 crop yields increase compared with those of C3. Further detailed studies on C3 and C4 crops are needed to determine growth mechanisms and to pinpoint exactly how temperature affects the internal changes within the crop.
Overall, our findings clearly revealed the complex sensitivity and spatial variability of crop yields to multiple meteorological factors within the TRB's irrigated agriculture zone, exposing the need to develop appropriate agricultural management and adaptation measures to mitigate future negative impacts on agricultural productivity and risk of extreme weather and climate events.

4.3 Strengths and limitations of the research

This study used a machine-learning approach to determine the effects of extreme weather and climate events on the yields of three typical crops in the TRB. Our results showed that RF model was able to identify and attribute the relationship between extreme weather and climate events and changes in yield of wheat, maize, and cotton, which is consistent with studies on other crops in different regions (Jeong et al., 2016; Hoffman et al., 2020). Additionally, our RF model simulations captured the complex effects of extreme weather and climate events on wheat, maize, and cotton, and uncovered new patterns in the TRB related to crop yields corresponding to extreme weather and climate events that are difficult to identify using traditional parametric regression analyses (Wang et al., 2014; Li et al., 2016). Overall, our results showed that different crops responded in different ways to the various extreme weather and climate events occurring in the TRB, with extreme nighttime temperatures having a particularly strong impact on yields.
However, statistical models have inherent limitations, as they do not include all potential factors affecting crop yields. The impact of complex interactions between climate factors on crop yields still needs to be further clarified. In the future, our research will focus on the combined effects of climate change and extreme weather and climate change on agricultural production, along with the effects of extreme weather and climate events on different climatic periods of crops.

5 Conclusions

In this paper, we studied the changes in ten indicators of extreme weather and climate events in the TRB from 1990 to 2020, describing the characteristics of climate change in the study area and analyzing the 30-a variations in yield of wheat, maize, and cotton. We also examined correlations of these changes with extreme weather and climate events. The RF approach was adopted to focus on the extent of the impact of different indices on yield and on the variations in the extent of their impact at different time periods. Our conclusions are as follows: the TRB experienced an increasing trend in extreme heat events, summer temperatures, and extreme nighttime temperatures. It also experienced a higher warming trend in the southwestern part of the study area and a significant decrease in the number of days with daily minimum temperatures lower than 0.0°C. This reflected the intensification of extreme weather and climate events over the past 30 a, especially extreme nighttime temperatures (TNx, Tn90p, and TR). There were significant spatial differences in wheat, maize, and cotton yields across the TRB. The Byingolr and Aksu prefectures (northeastern TRB) had higher yields than the other regions. In terms of the effects of temporality on yields, wheat and maize showed significant yield reductions in 2018 and cotton in 2014. However, since 1990, all three crop yields have generally shown an upward trend. Extreme nighttime temperatures (TR, Tn90p, and TNx) were positively correlated with wheat, maize, and cotton yields. The number of WD was mainly negatively correlated with yields. For maize and cotton yields, the extreme daytime temperature indices (TXn, Tx90p, and SU) had the greatest impact, while for wheat yield, the extreme nighttime temperature indices (Tn90p and FD) had the most effect. Over time, there was a clear decrease in the importance of the extreme precipitation indices (CDD and R95p) for crop yields. By identifying the key extreme weather and climate indicators that affect crop yield, this study provided valuable information for regional agricultural planning and climate adaptation strategies. The findings can support decision-making on crop management practices, irrigation scheduling, and the development of resilient agricultural systems in the TRB.

Conflict of interest

Chen Yaning is an editorial board member of Journal of Arid Land and was not involved in the editorial review or the decision to publish this article. All authors declare that there are no competing interests.

Acknowledgements

This research was funded by the Tianshan Yingcai Program of the Xinjiang Uygur Autonomous Region (2022TSYCCX0038), the Youth Innovation Promotion Association of the Chinese Academy of Sciences (Y2022108), and the Postdoctoral Fellowship Program of Chinese Postdoctoral Science Foundation (CPSF) (GZC20232962).

Author contributions

Conceptualization: WANG Xiaochen, LI Zhi, CHEN Yaning; Methodology: WANG Xiaochen; Software: WANG Xiaochen, ZHU Jianyu, WANG Jiayou; Validation: WANG Xiaochen, WANG Chuan, FENG Meiqing, LIANG Qixiang; Writing - original draft preparation: WANG Xiaochen; Funding acquisition: LI Zhi, ZHANG Xueqi. All authors approved the manuscript.

Appendix

Fig. S1 Temporal and spatial distribution of trends and index changes of typical extreme weather and climate events during the wheat growing season in the TRB. (a), TNx; (b), TXn; (c), CDD; (d), TR; (e), Tx90p; (f), Tn90p; (g), SU; (h), FD; (i), R95p; (j), WD. In the left figures, positive triangles indicate an increase, inverted triangles represent a decrease. Hollow triangles indicate no significant trend, and red and green colors signify a significant increase and a significant decrease, respectively. In the right figures, the black horizontal line represents the median, the boundaries of the boxed line correspond to the 25th and 75th percentiles (quartiles), and black dots denote outliers.
Fig. S2 Temporal and spatial distribution of trends and index changes of typical extreme weather and climate events during the maize growing season in the TRB. (a), TNx; (b), TXn; (c), CDD; (d), TR; (e), Tx90p; (f), Tn90p; (g), SU; (h), FD; (i), R95p; (j), WD. In the left figures, positive triangles indicate an increase, inverted triangles represent a decrease, and the symbol "-" denotes no change. Hollow triangles indicate no significant trend, and red and green colors signify a significant increase and a significant decrease, respectively. In the right figures, the black horizontal line represents the median, the boundaries of the boxed line correspond to the 25th and 75th percentiles (quartiles), and black dots denote outliers.
Fig. S3 Temporal and spatial distribution of trends and index changes of typical extreme weather and climate events during the cotton growing season in the TRB. (a), TNx; (b), TXn; (c), CDD; (d), TR; (e), Tx90p; (f), Tn90p; (g), SU; (h), FD; (i), R95p; (j), WD. In the left figures, positive triangles indicate an increase, inverted triangles represent a decrease, and the symbol "-" denotes no change. Hollow triangles indicate no significant trend, and red and green colors signify a significant increase and a significant decrease, respectively. In the right figures, the black horizontal line represents the median, the boundaries of the boxed line correspond to the 25th and 75th percentiles (quartiles), and black dots denote outliers.
[1]
Abdullaev S F, Sokolik I N. 2020. Assessment of the influences of dust storms on cotton production in Tajikistan. In: Gutman G, Chen J Q, Henebry G M, et al. Landscape Dynamics of Drylands across Greater Central Asia: People, Societies and Ecosystems. Landscape Series, Vol. 17. Cham: Springer, 87-105.

[2]
Adhikari P, Ale S, Bordovsky J P, et al. 2016. Simulating future climate change impacts on seed cotton yield in the Texas High Plains using the CSM-CROPGRO-Cotton model. Agricultural Water Management, 164(Part 2): 317-330.

[3]
Bhatt I, Deryng D, Farrell A, et al. 2022. Food, fibre, and other ecosystem products. In: Climate Change 2022:Impacts, Adaptation and Vulnerability. Contribution of Working Group II to the Sixth Assessment Report of the Intergovernmental Panel on Climate Change. Cambridge: Cambridge University Press, 713-906.

[4]
Bowden C, Foster T, Parkes B. 2023. Identifying links between monsoon variability and rice production in India through machine learning. Scientific Reports, 13: 2446, doi: 10.1038/s41598-023-27752-8.

[5]
Breiman L. 2001. Random forests. Machine Learning, 45: 5-32.

[6]
Chen X P, Qi Z M, Gui D W, et al. 2019. Simulating impacts of climate change on cotton yield and water requirement using RZWQM2. Agricultural Water Management, 222: 231-241.

[7]
Cutler D R, Edwards Jr. T C, Beard K H, et al. 2007. Random forests for classification in ecology. Ecology, 88(11): 2783-2792.

[8]
Daloz A S, Rydsaa J H, Hodnebrog Ø, et al. 2021. Direct and indirect impacts of climate change on wheat yield in the Indo-Gangetic Plain in India. Journal of Agriculture and Food Research, 4: 100132: doi: 10.1016/j.jafr.2021.100132.

[9]
Eck M A, Murray A R, Ward A R, et al. 2020. Influence of growing season temperature and precipitation anomalies on crop yield in the southeastern United States. Agricultural and Forest Meteorology, 291: 108053, doi: 10.1016/j.agrformet.2020.108053.

[10]
Elahi E, Khalid Z, Tauni M Z, et al. 2022. Extreme weather events risk to crop-production and the adaptation of innovative management strategies to mitigate the risk: A retrospective survey of rural Punjab, Pakistan. Technovation, 117: 102255, doi: 10.1016/j.technovation.2021.102255.

[11]
Feng P Y, Wang B, Liu D L, et al. 2018. Impacts of rainfall extremes on wheat yield in semi-arid cropping systems in eastern Australia. Climatic Change, 147: 555-569.

[12]
Gilbert R O. 1987. Statistical Methods for Environmental Pollution Monitoring. Chichester: John Wiley & Sons, 26-57.

[13]
Guan J Y, Yao J Q, Li M Y, et al. 2022. Historical changes and projected trends of extreme climate events in Xinjiang, China. Climate Dynamics, 59: 1753-1774.

[14]
Guan X F, Yang L M, Zhang Y X, et al. 2019. Spatial distribution, temporal variation, and transport characteristics of atmospheric water vapor over Central Asia and the arid region of China. Global and Planetary Change, 172: 159-178.

[15]
Guntukula R. 2020. Assessing the impact of climate change on Indian agriculture: Evidence from major crop yields. Journal of Public Affairs, 20(1): e2040, doi: 10.1002/pa.2040.

[16]
Guo S B, Guo E J, Zhang Z T, et al. 2022. Impacts of mean climate and extreme climate indices on soybean yield and yield components in Northeast China. Science of the Total Environment, 838(Part 3): 156284, doi: 10.1016/j.scitotenv.2022.156284.

[17]
Hoffman A L, Kemanian A R, Forest C E. 2020. The response of maize, sorghum, and soybean yield to growing-phase climate revealed with machine learning. Environmental Research Letters, 15: 094013, doi: 10.1088/1748-9326/ab7b22.

[18]
Horton D E, Johnson N C, Singh D, et al. 2015. Contribution of changes in atmospheric circulation patterns to extreme temperature trends. Nature, 522(7557): 465-469.

[19]
Hou Y F, Chen Y N, Ding J L, et al. 2022. Ecological impacts of land use change in the arid Tarim River Basin of China. Remote Sensing, 14(8): 1894, doi: 10.3390/rs14081894.

[20]
Jacovides C P, Kontoyiannis H. 1995. Statistical procedures for the evaluation of evapotranspiration computing models. Agricultural Water Management, 27: 365-371.

[21]
Jeong J H, Resop J P, Mueller N D, et al. 2016. Random forests for global and regional crop yield predictions. PLoS ONE, 11(6): e0156571, doi: 10.1371/journal.pone.0156571.

[22]
Kendall M G. 1973. Rank correlation methods. International Statistical Review, 41(3): 399-400.

[23]
Khan A A, Zhao Y J, Khan J, et al. 2021. Spatial and temporal analysis of rainfall and drought condition in Southwest Xinjiang in Northwest China, using various climate indices. Earth Systems and Environment, 5: 201-216.

[24]
Kuradusenge M, Hitimana E, Hanyurwimfura D, et al. 2023. Crop yield prediction using machine learning models: case of Irish potato and maize. Agriculture, 13(1): 225, doi: 10.3390/agriculture13010225.

[25]
Legates D R, McCabe Jr. G J. 1999. Evaluating the use of "goodness-of-fit" measures in hydrologic and hydroclimatic model validation. Water Resources Research, 35(1): 233-241.

[26]
Li C, Wang R H, Ning H S, et al. 2016. Changes in climate extremes and their impact on wheat yield in Tianshan Mountains region, Northwest China. Environmental Earth Sciences, 75: 1228, doi: 10.1007/s12665-016-6030-6.

[27]
Li M Y, Yao J Q, Guan J Y, et al. 2021. Observed changes in vapor pressure deficit suggest a systematic drying of the atmosphere in Xinjiang of China. Atmospheric Research, 248: 105199, doi: 10.1016/j.atmosres.2020.105199.

[28]
Li N, Lin H X, Wang T X, et al. 2020. Impact of climate change on cotton growth and yields in Xinjiang, China. Field Crops Research, 247: 107590, doi: 10.1016/j.fcr.2019.107590.

[29]
Li N, Li Y, Yang Q L, et al. 2024. Simulating climate change impacts on cotton using AquaCrop model in China. Agricultural Systems, 216: 103897, doi: 10.1016/j.agsy.2024.103897.

[30]
Luan J, Zhang C L, Xu B D, et al. 2020. The predictive performances of random forest models with limited sample size and different species traits. Fisheries Research, 227: 105534, doi: 10.1016/j.fishres.2020.105534.

[31]
Mahato A. 2014. Climate change and its impact on agriculture. International Journal of Scientific and Research Publications, 4(4): 2250-3153.

[32]
Mann H B. 1945. Non-parametric tests against trend. Econometrica, 13(3): 245, doi: 10.2307/1907187.

[33]
Meerburg B G, Verhagen A, Jongschaap R E E, et al. 2009. Do nonlinear temperature effects indicate severe damages to U.S. crop yields under climate change? Proceedings of the National Academy of Sciences, 106(43): E120, doi: 10.1073pnas.0910618106.

[34]
Mueller B, Hauser M, Iles C, et al. 2015. Lengthening of the growing season in wheat and maize producing regions. Weather and Climate Extremes, 9: 47-56.

[35]
Newman R, Noy I. 2023. The global costs of extreme weather that are attributable to climate change. Nature Communications, 14: 6103, doi: 10.1038/s41467-023-41888-1.

[35]
Peterson T C, Manton M J. 2008. Monitoring changes in climate extremes: a tale of international collaboration. Bulletin of the American Meteorological Society, 89(9): 1266-1271.

[37]
Rezaei E E, Webber H, Asseng S, et al. 2023. Climate change impacts on crop yields. Nature Reviews Earth & Environment, 4: 831-846.

[38]
Sadok W, Jagadish S V K. 2020. The hidden costs of nighttime warming on yields. Trends in Plant Science, 25(7): 644-651.

[39]
Schmitt J, Offermann F, Söder M, et al. 2022. Extreme weather events cause significant crop yield losses at the farm level in German agriculture. Food Policy, 112: 102359, doi: 10.1016/j.foodpol.2022.102359.

[40]
Sen P K. 1968. Estimates of the regression coefficient based on Kendall's tau. Journal of the American Statistical Association, 63(324): 1379-1389.

[41]
Shen Y-J, Shen Y J, Guo Y, et al. 2020. Review of historical and projected future climatic and hydrological changes in mountainous semiarid Xinjiang (northwestern China), Central Asia. Catena, 187: 104343, doi: 10.1016/j.catena.2019.104343.

[42]
Srinivasarao Ch, Kundu S, Shanker A K, et al. 2016. Continuous cropping under elevated CO2: Differential effects on C4 and C3 crops, soil properties and carbon dynamics in semi-arid alfisols. Agriculture, Ecosystems & Environment, 218: 73-86.

[43]
Statistic Bureau of Xinjiang Uygur Autonomous Region. 1991-2021. Xinjiang Statistical Yearbook. Beijing: China Statistical Publishing House. (in Chinese)

[44]
Tao H, Fischer T, Su B, et al. 2017. Observed changes in maximum and minimum temperatures in Xinjiang Autonomous Region, China. International Journal of Climatology, 37: 5120-5128.

[45]
Troy T J, Kipgen C, Pal I. 2015. The impact of climate extremes and irrigation on US crop yields. Environmental Research Letters, 10: 054013, doi: 10.1088/1748-9326/10/5/054013.

[46]
Ureta C, González E J, Espinosa A, et al. 2020. Maize yield in Mexico under climate change. Agricultural Systems, 177: 102697, doi: 10.1016/j.agsy.2019.102697.

[47]
Vogel E, Donat M G, Alexander L V, et al. 2019. The effects of climate extremes on global agricultural yields. Environmental Research Letters, 14(5): 054010, doi: 10.1088/1748-9326/ab154b.

[48]
Wang H J, Chen Y N, Chen Z S. 2013. Spatial distribution and temporal trends of mean precipitation and extremes in the arid region, northwest of China, during 1960-2010. Hydrological Processes, 27(12): 1807-1818.

[49]
Wang P, Zhang Z, Song X, et al. 2014. Temperature variations and rice yields in China: historical contributions and future trends. Climatic Change, 124: 777-789.

[50]
Wang Y Y, Liu S N, Shi H Y. 2023. Comparison of climate change impacts on the growth of C3 and C4 crops in China. Ecological Informatics, 74: 101968, doi: 10.1016/j.ecoinf.2022.101968.

[51]
Wei J L, Pan X H, Deng Q H. 2010. Effects of nighttime temperature increase on the yield of double season rice. Acta Ecologica Sinica, 30(10): 2793-2798. (in Chinese)

[52]
Wu J Z, Zhang J, Ge Z M, et al. 2021. Impact of climate change on maize yield in China from 1979 to 2016. Journal of Integrative Agriculture, 20(1): 289-299.

[53]
Xu L, Zheng C L, Ma Y. 2021. Variations in precipitation extremes in the arid and semi-arid regions of China. International Journal of Climatology, 41(3): 1542-1554.

[54]
Yang Y, Chang W. 2024. Analysis of spatial and temporal distribution and changes in extreme climate events in Northwest China from 1960 to 2021: a case study of Xinjiang. Sustainability, 16(12): 4960, doi: 10.3390/su16124960.

[55]
Yin Z L, Feng Q, Yang L S, et al. 2020. Projected spatial patterns in precipitation and air temperature for China's northwest region derived from high-resolution regional climate models. International Journal of Climatology, 40(8): 3922-3941.

[56]
Yue S, Wang C Y. 2002. Regional streamflow trend detection with consideration of both temporal and spatial correlation. International Journal of Climatology, 22(8): 933-946.

[57]
Zhang J, Liu Y J. 2022. Decoupling of impact factors reveals the response of cash crops phenology to climate change and adaptive management practice. Agricultural and Forest Meteorology, 322: 109010, doi: 10.1016/j.agrformet.2022.109010.

[58]
Zhang Q, Sun P, Singh V P, et al. 2012a. Spatial-temporal precipitation changes (1956-2000) and their implications for agriculture in China. Global and Planetary Change, 82: 86-95.

[59]
Zhang X D, Lu C H, Guan Z Y. 2012b. Weakened cyclones, intensified anticyclones and recent extreme cold winter weather events in Eurasia. Environmental Research Letters, 7(4): 044044, doi: 10.1088/1748-9326/7/4/044044.

[60]
Zhang Z, Li Y, Chen X G, et al. 2023. Impact of climate change and planting date shifts on growth and yields of double cropping rice in southeastern China in future. Agricultural Systems, 205: 103581, doi: 10.1016/j.agsy.2022.103581.

[61]
Zhao W J. 2020. Extreme weather and climate events in China under changing climate. National Science Review, 7(5): 938-943.

[62]
Zheng C Y, Zhang J, Chen J, et al. 2017. Nighttime warming increases winter-sown wheat yield across major Chinese cropping regions. Field Crops Research, 214: 202-210.

[63]
Zhu J Y, Chen Y N, Li Z, et al. 2023. Using film-mulched drip irrigation to improve the irrigation water productivity of cotton in the Tarim River Basin, Central Asia. Remote Sensing, 15(18): 4615, doi: 10.3390/rs15184615.

[64]
Zhu X F, Liu T T, Xu K, et al. 2022. The impact of high temperature and drought stress on the yield of major staple crops in northern China. Journal of Environmental Management, 314: 115092, doi: 10.1016/j.jenvman.2022.115092.

[65]
Zou S, Abuduwaili J, Duan W L, et al. 2021. Attribution of changes in the trend and temporal non-uniformity of extreme precipitation events in Central Asia. Scientific Reports, 11: 15032, doi: 10.1038/s41598-021-94486-w.

文章导航

/