
Effects of a combination of biochar and cow manure on soil nutrients and cotton yield in salinized fields
Received date: 2025-03-18
Revised date: 2025-05-28
Accepted date: 2025-06-03
Online published: 2025-08-12
HUANG Cheng , HOU Shengtong , WANG Bao , SONG Yuchuan , Aikeremu ABULATIJIANG , MIN Jiuzhou , SHENG Jiandong , JIANG Ping'an , WANG Ze , CHENG Junhui . [J]. Journal of Arid Land, 2025 , 17(7) : 1014 -1026 . DOI: 10.1007/s40333-025-0054-2
Biochar and animal manure application can improve crop yields in salt-affected soil. Previous studies have primarily applied biochar and animal manure either alone or at fixed ratios, while their combined effects with varying combination proportions are still unclear. To address this knowledge gap, we performed a 2-a experiment (2023-2024) in a salinized cotton field in Wensu County of Xinjiang Uygur Autonomous Region of China with the following 6 treatments: control; application of biochar (10 t/hm2) alone (BC100%); application of cow manure (10 t/hm2) alone (CM100%); application of 70% biochar (7 t/hm2) combined with 30% cow manure (3 t/hm2) (BC70%+CM30%); application of 50% biochar (5 t/hm2) combined with 50% cow manure (5 t/hm2) (BC50%+CM50%); and application of 30% biochar (3 t/hm2) combined with 70% cow manure (7 t/hm2) (BC30%+CM70%). By measuring soil pH, electrical conductivity, soil organic matter, available phosphorus, available potassium, and available nitrogen at 0-20 and 20-40 cm depths, as well as yield components and cotton yield in 2023 and 2024, this study revealed that soil nutrients in the 0-20 cm depth were more sensitive to the treatment. Among all the treatments, BC50%+CM50% treatment had the highest value of soil pH (9.63±0.07) but the lowest values of electrical conductivity (161.9±31.8 μS/cm), soil organic matter (1.88±0.27 g/kg), and available potassium (42.72±8.25 mg/kg) in 2024. Moreover, the highest cotton yield (5336.63±467.72 kg/hm2) was also observed under BC50%+CM50% treatment in 2024, which was 1.9 times greater than that under the control treatment. In addition, cotton yield in 2023 was jointly determined by yield components (density and number of cotton bolls) and soil nutrients (available phosphorus and available potassium), but in 2024, cotton yield was only positively related to yield components (density, number of cotton bolls, and single boll weight). Overall, this study highlighted that in salt-affected soil, the combination of biochar and cow manure at a 1:1 ratio is recommended for increasing cotton yield and reducing soil salinity stress.
Table 1 Background values of the soil properties |
| Soil depth (cm) | Soil pH | EC (μS/cm) | SOM (g/kg) | AP (mg/kg) | AK (mg/kg) | AN (mg/kg) | BD (g/cm3) | Soil salinity (g/kg) |
|---|---|---|---|---|---|---|---|---|
| 0-20 | 8.60 | 3451.0 | 3.42 | 7.96 | 70.36 | 22.21 | 1.67 | 6.01 |
| 20-40 | 8.70 | 2992.0 | 4.28 | 4.89 | 45.00 | 13.16 | 1.65 | 6.90 |
Note: EC, electrical conductivity; SOM, soil organic matter; AP, available phosphorus; AK, available potassium; AN, available nitrogen; BD, bulk density. |
Table 2 Effects of biochar combined with cow manure on soil pH and electrical conductivity (EC) |
| Soil depth (cm) | Treatment | Soil pH | EC (μS/cm) | ||
|---|---|---|---|---|---|
| 2023 | 2024 | 2023 | 2024 | ||
| 0-20 | CK | 8.98±0.17de | 8.73±0.22e | 689.7±76.5abcd | 775.0±228.6abc |
| BC100% | 9.08±0.13bcde | 9.39±0.13abcd | 611.6±135.5bcd | 221.5±52.7cd | |
| CM100% | 8.96±0.17de | 9.50±0.10ab | 730.0±276.1abcd | 260.2±21.5bcd | |
| BC70%+CM30% | 8.70±0.26e | 9.39±0.08abcd | 1247.1±450.3a | 605.3±241.4bcd | |
| BC50%+CM50% | 8.88±0.22e | 9.63±0.07a | 835.0±248.4ab | 161.9±31.8d | |
| BC30%+CM70% | 9.00±0.05cde | 9.45±0.15abc | 482.9±21.8bcd | 344.8±86.6bcd | |
| 20-40 | CK | 9.07±0.17bc | 8.97±0.28c | 616.6±141.0ab | 729.8±186.4ab |
| BC100% | 9.26±0.13abc | 9.44±0.31abc | 417.1±92.1ab | 349.6±217.8b | |
| CM100% | 9.14±0.19abc | 9.63±0.07ab | 794.6±438.1ab | 250.6±39.6b | |
| BC70%+CM30% | 8.09±0.25c | 9.22±0.34abc | 1064.1±442.5a | 422.5±183.2ab | |
| BC50%+CM50% | 8.81±0.31c | 9.35±0.19abc | 753.2±285.9ab | 445.9±114.8ab | |
| BC30%+CM70% | 9.24±0.07abc | 9.72±0.04a | 443.3±72.0ab | 162.4±29.9b | |
Note: CK, BC100%, CM100%, BC70%+CM30%, BC50%+CM50%, and BC30%+CM70% represent the control, application of biochar (10 t/hm2) alone, application of cow manure (10 t/hm2) alone, application of 70% biochar (7 t/hm2) combined with 30% cow manure (3 t/hm2), application of 50% biochar (5 t/hm2) combined with 50% cow manure (5 t/hm2) and application of 30% biochar (3 t/hm2) combined with 70% cow manure (7 t/hm2), respectively. Mean±SE. Different lowercase letters indicate significant differences in soil pH and EC among treatments and between years at P<0.050 level. |
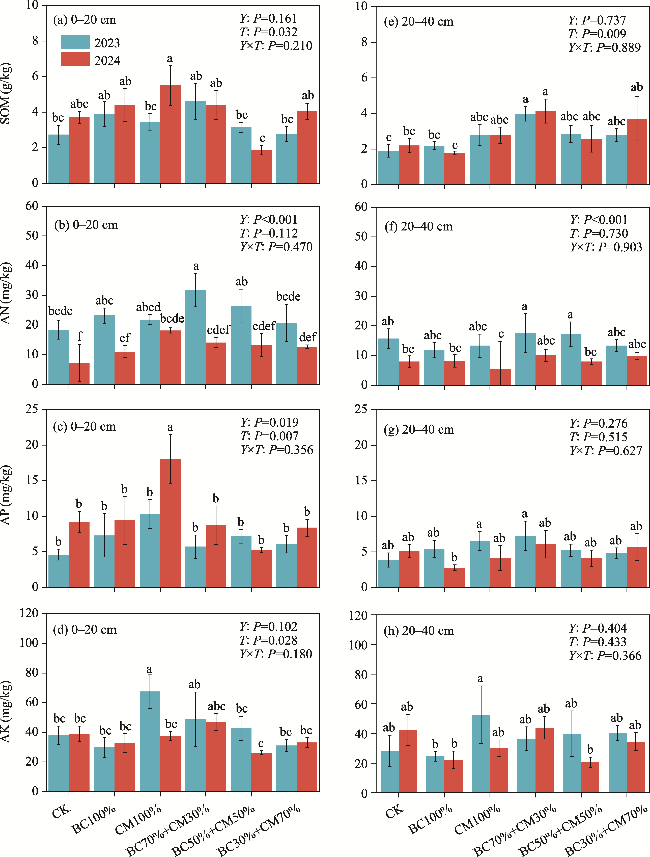
Fig. 1 Variations in soil nutrients in response to biochar combined with cow manure in 0-20 cm (a-d) and 20-40 cm (e-h) soil depths in 2023 and 2024. SOM, soil organic matter; AN, available nitrogen; AP, available phosphorus; AK, available potassium. Y, T, and Y×T represent the main effects of year, treatment, and their interaction effects, respectively. CK, BC100%, CM100%, BC70%+CM30%, BC50%+CM50%, and BC30%+CM70% represent the control, application of biochar (10 t/hm2) alone, application of cow manure (10 t/hm2) alone, application of 70% biochar (7 t/hm2) combined with 30% cow manure (3 t/hm2), application of 50% biochar (5 t/hm2) combined with 50% cow manure (5 t/hm2), and application of 30% biochar (3 t/hm2) combined with 70% cow manure (7 t/hm2), respectively. Bars are standard errors. Different lowercase letters represent significant differences in soil nutrients among treatments and between years at P<0.050 level. |
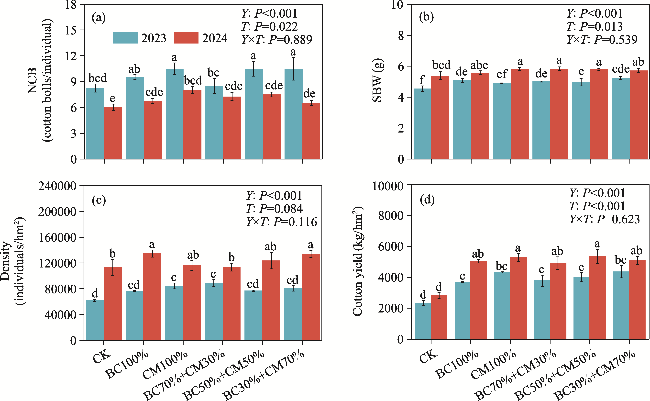
Fig. 2 Variations in yield components and cotton yield under different treatments of biochar combined with cow manure in 2023 and 2024. (a), number of cotton bolls (NCB); (b), single boll weight (SBW); (c), density; (d), cotton yield. Bars are standard errors. Different lowercase letters represent significant differences in yield components and cotton yield among treatments and between years at P<0.050 level. |
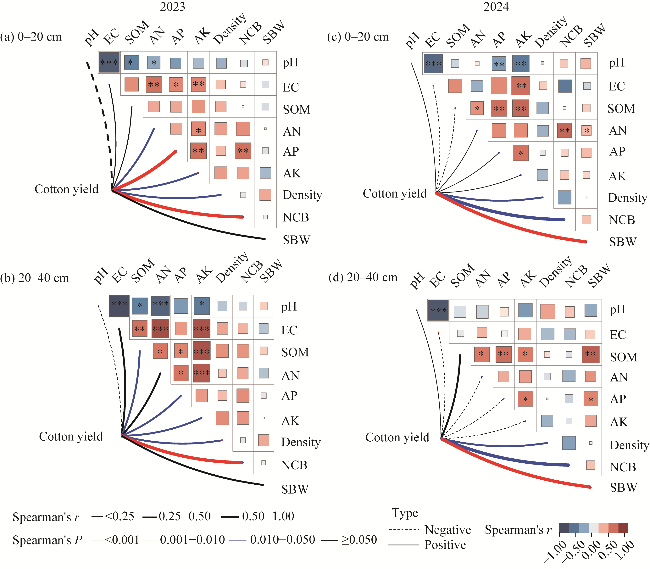
Fig. 3 Spearman correlations of cotton yield with soil pH, electrical conductivity (EC), SOM, AN, AP, AK, density, NCB, and SBW at 0-20 and 20-40 cm soil depths in 2023 (a and b) and 2024 (c and d). The sizes of squares represent absolute values of Spearman correlations among these variables, whereas the blue and red colors in the squares represent negative and positive correlations, respectively. *, **, and *** in the squares indicate that the Spearman correlations are significant at P<0.050, P<0.010, and P<0.001 levels, respectively. |
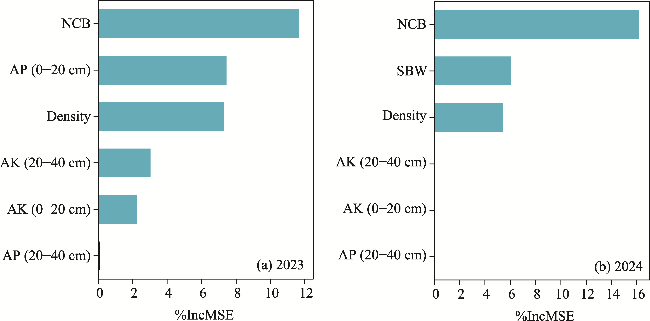
Fig. 4 Relative importances of NCB, density, SBW, AP, and AK at 0-20 and 20-40 cm depths in regulating cotton yield in 2023 (a) and 2024 (b). %IncMSE represents the increase in the mean square error and indicates the importance of an explained variable when its true value is replaced by random data. |
| [1] |
|
| [2] |
|
| [3] |
|
| [4] |
|
| [5] |
|
| [6] |
|
| [7] |
|
| [8] |
|
| [9] |
|
| [10] |
|
| [11] |
|
| [12] |
|
| [13] |
FAO(Food and Agriculture Organization of the United Nations). 2022. Top 10 countries production of cotton seed. [2025-02-13]. http://www.fao.org.
|
| [14] |
|
| [15] |
|
| [16] |
|
| [17] |
|
| [18] |
|
| [19] |
|
| [20] |
|
| [21] |
|
| [22] |
|
| [23] |
|
| [24] |
|
| [25] |
|
| [26] |
|
| [27] |
|
| [28] |
|
| [29] |
|
| [30] |
|
| [31] |
|
| [32] |
|
| [33] |
|
| [34] |
|
| [35] |
|
| [36] |
|
| [37] |
|
| [38] |
|
| [39] |
|
| [40] |
National Bureau of Statistics. 2023a. Cotton sowing area. [2025-02-13]. https://www.stats.gov.cn/. in Chinese)
|
| [41] |
National Bureau of Statistics. 2023b. Cotton yield per unit area. [2025-02-13]. https://www.stats.gov.cn/. in Chinese)
|
| [42] |
|
| [43] |
R Development Core Team. 2012. R: A language and environment for statistical computing. [2025-02-17]. https://www.r-project.org.
|
| [44] |
|
| [45] |
|
| [46] |
|
| [47] |
|
| [48] |
|
| [49] |
|
| [50] |
|
| [51] |
|
| [52] |
|
| [53] |
|
| [54] |
|
| [55] |
|
| [56] |
|
| [57] |
|
| [58] |
|
| [59] |
|
| [60] |
|
/
| 〈 |
|
〉 |