• QIU Lisha 1 ,
  • SHAN Wei , 1, 2, 3, * ,
  • GUO Ying 1, 2, 3 ,
  • ZHANG Chengcheng 1, 2, 3 ,
  • LIU Shuai 1 ,
  • YAN Aoxiang 1
展开

收稿日期: 2024-04-27

  修回日期: 2024-10-16

  录用日期: 2024-10-17

  网络出版日期: 2025-08-12

Spatiotemporal dynamics of vegetation response to permafrost degradation in Northeast China

  • QIU Lisha 1 ,
  • SHAN Wei , 1, 2, 3, * ,
  • GUO Ying 1, 2, 3 ,
  • ZHANG Chengcheng 1, 2, 3 ,
  • LIU Shuai 1 ,
  • YAN Aoxiang 1
Expand
  • 1Institute of Cold Regions Science and Engineering, Northeast Forestry University, Harbin 150040, China
  • 2Ministry of Education Observation and Research Station of Permafrost Geo-Environment System in Northeast China, Harbin 150040, China
  • 3Collaborative Innovation Centre for Permafrost Environment and Road Construction and Maintenance in Northeast China, Harbin 150040, China
*SHAN Wei (E-mail: )

Received date: 2024-04-27

  Revised date: 2024-10-16

  Accepted date: 2024-10-17

  Online published: 2025-08-12

本文引用格式

QIU Lisha , SHAN Wei , GUO Ying , ZHANG Chengcheng , LIU Shuai , YAN Aoxiang . [J]. Journal of Arid Land, 2024 , 16(11) : 1562 -1583 . DOI: 10.1007/s40333-024-0088-x

Abstract

Permafrost in Northeast China is undergoing extensive and rapid degradation, and it is of great importance to understand the dynamics of vegetation response to permafrost degradation during different periods in this region. Based on the meteorological station data and MODIS land surface temperature data, we mapped the distribution of permafrost using the surface frost number (SFN) model to analyze the permafrost degradation processes in Northeast China from 1981 to 2020. We investigated the spatiotemporal variation characteristics of vegetation and its response to permafrost degradation during different periods from 1982 to 2020 using the normalized difference vegetation index (NDVI). We further discussed the dominant factors influencing the vegetation dynamics in the permafrost degradation processes. Results indicated that the permafrost area in Northeast China decreased significantly by 1.01×10⁵ km2 in the past 40 a. The permafrost stability continued to weaken, with large areas of stable permafrost (SP) converted to semi-stable permafrost (SSP) and unstable permafrost (UP) after 2000. From 1982 to 2020, NDVI exhibited a significant decreasing trend in the seasonal frost (SF) region, while it exhibited an increasing trend in the permafrost region. NDVI in the UP and SSP regions changed from a significant increasing trend before 2000 to a nonsignificant decreasing trend after 2000. In 78.63% of the permafrost region, there was a negative correlation between the SFN and NDVI from 1982 to 2020. In the SP and SSP regions, the correlation between the SFN and NDVI was predominantly negative, while in the UP region, it was predominantly positive. Temperature was the dominant factor influencing the NDVI variations in the permafrost region from 1982 to 2020, and the impact of precipitation on NDVI variations increased after 2000. The findings elucidate the complex dynamics of vegetation in the permafrost region of Northeast China and provide deeper insights into the response mechanisms of vegetation in cold regions to permafrost degradation induced by climate change.

1 Introduction

Permafrost plays a vital role in the cryosphere and is predominantly located in high-latitude and high-altitude regions, covering 23.90% of the land area of the Northern Hemisphere (Zhang et al., 1999). It consists of soil and rock that remain at or below the freezing point for at least two consecutive years (Muller, 1948; Permafrost Subcommittee, Associate Committee on Geotechnical Research, 1988). The thermal state of near-surface permafrost is highly sensitive to changes in climate conditions, such as the temperature and snow accumulation. Over the past 30 a, the rate of temperature increase in high-latitude regions has reached 0.6°C/10a, which is twice the global average (Singarayer and Valdes, 2010). Climate warming has resulted in widespread, persistent, and rapid thawing of permafrost and the degradation of wetlands (Schuur et al., 2015). Vegetation forms the basis of the permafrost ecosystem, connecting soil, atmosphere, and water. Boreal forests comprise nearly one-third of the world's forests and play a key role in regulating regional carbon and water cycles, material and energy flows, and climate stability (Westermann et al., 2015; Chadburn et al., 2017). Climate change directly affects permafrost and vegetation and alters their interactions. Investigating the complex relationships among permafrost, climate, and vegetation is essential for accurately evaluating carbon emissions resulting from permafrost degradation.
Hydrothermal interactions among permafrost, climate, and vegetation are essential for maintaining the integrity of permafrost ecosystems. Climate-induced permafrost degradation may lead to vegetation exhibiting complex growth characteristics, which can serve as indicators (Yang et al., 2010). Over time, permafrost degradation has altered regional soil hydrothermal dynamics, soil biogeochemical cycles, microbial populations, and soil nutrient levels, affecting the composition and development of surface vegetation (Lloyd et al., 2003; Jin et al., 2021). In turn, vegetation indirectly shapes the permafrost environment by capturing snow, redistributing sunlight, and influencing surface water patterns (Liu et al., 2023). Furthermore, vegetation can mitigate permafrost degradation caused by climate warming, potentially reducing carbon emissions and thereby regulating the local climate.
Permafrost in Northeast China is located within the southern Eurasian permafrost belt, characterized by low stability and high susceptibility to environmental changes (Jin et al., 2007; Shur and Jorgenson, 2007). Rising temperature and human activities have expedited the degradation of permafrost in this region. Over the past 50 a, local temperature has increased by 0.9°C-2.2°C (Jin et al., 2007), which has led to a northward shift of the southern permafrost boundary, thinning of the permafrost layer, an increase in the mean annual land temperature, and an increase in the active layer thickness (Chen et al., 2018). Between 1950 and 2010, the permafrost area in Northeast China shrank from 4.80×10⁵ to 3.10×10⁵ km2, and the southern permafrost boundary moved 0.1°-1.1° northward (Zhang et al., 2021). Shan et al. (2022) developed a regression model that links the permafrost temperature and the frost number using a surface frost number (SFN) model adjusted for the normalized difference vegetation index (NDVI) and forest canopy density. They simulated the distribution of the permafrost temperature in Northeast China and found that the permafrost area decreased from 3.30×10⁵ to 2.70×10⁵ km2 between 2003 and 2019.
Cold region ecosystems are highly vulnerable and can be significantly affected by permafrost degradation. Changes in soil hydrothermal properties can disrupt ecosystems and hydrological structures in boreal forests, leading to ecological degradation such as significant loss of natural forest belts in the Da Hinggan Ling, Xiao Hinggan Ling, and shrinking wetlands. The NDVI, which measures the vegetation cover, photosynthesis, and biomass, can be monitored dynamically on regional and global scales using multispectral satellite imagery (Li et al., 2024). Over the past 30 a, 80.60% of permafrost region in Northeast China experienced significant increases in the NDVI, and the most notable increase occurred in continuous permafrost zone (Guo et al., 2017b, 2022). Guo et al. (2017b) studied the changes in the growing season NDVI in the permafrost region in Northeast China from 1981 to 2014 and found that permafrost degradation positively affected vegetation growth, particularly in continuous and discontinuous permafrost zones. Li and Liu (2021) found that in the permafrost region in Northeast China, the rate of increase of the NDVI in coniferous forests decreased from north to south as the active layer deepened. Due to the interactions between climate variables and permafrost, future warming may cause coniferous and mixed forests to expand northward, while grasslands may take over non-permafrost areas (Li and Liu, 2021). On the northern slope of the Da Hinggan Ling, the species composition has shifted from hydrophilic to mesophytic plants as the active layer thickness changed, but there has been no notable change in the prevalence of hygrophyte and xerophyte species (Guo et al., 2017a).
Despite extensive research on vegetation changes in the permafrost region in Northeast China, most investigations have treated permafrost as static and have not conducted long-term studies of vegetation dynamics throughout the permafrost degradation process. There is also a lack of continuity and integration in research across different periods; therefore, the relationship between permafrost and vegetation dynamics is poorly understood. In addition, the effects of climate change and permafrost degradation on vegetation dynamics have not been clearly determined, and there is a lack of quantitative research and representation. To address these research gaps, this study used an extended SFN model to investigate the spatial distribution and development patterns of permafrost in Northeast China from 1981 to 2020. Trend analysis and mutation point analysis were applied to evaluate the spatiotemporal variation characteristics of the NDVI under different permafrost degradation conditions. Correlation analysis and multiple linear regression were used to investigate the response of the NDVI to permafrost degradation and climate change. This research provides essential scientific data for ecological restoration and environmental protection in the cold regions of Northeast China and is of great significance for predicting vegetation patterns and managing and restoring vegetation in high-latitude permafrost regions.

2 Materials and methods

2.1 Study area

Northeast China encompasses the Heilongjiang, Jilin, and Liaoning provinces, as well as parts of Inner Mongolia Autonomous Region (38°42′-53°35′N, 115°32′-135°09′E; Fig. 1), covering approximately 1.52×10⁶ km2 (Mao et al., 2012a; Zhang et al., 2019). The central part of Northeast China includes the Songnen Plain and Liaohe Plain, which is bordered by the Sanjiang Plain to the northeast, the Da Hinggan Ling to the west, the Xiao Hinggan Ling to the north, and the Changbai Mountains to the east (Shen et al., 2019). The climate in this region is primarily temperate. The Da Hinggan Ling in the north and the Liaodong Peninsula in the south are cold and warm temperate zones, respectively. The continental climate conditions intensify from east to west, with long and cold winters and humid and hot summers. The average annual temperature ranges from -6.0°C to 11.7°C and increases from north to south. The annual precipitation varies from 300 to 1000 mm and increases from west to east (Jin et al., 2007; Dang et al., 2022; Xiang et al., 2022). Northeast China can be roughly divided into a humid forest zone in the east and north, a semi-humid forest-steppe zone in the central region, and a semi-arid steppe zone in the west. In the mountainous and hilly regions, the combination of geographic and climatic factors leads to distinct variations in the vegetation distribution. From south to north, the changes in the thermal conditions result in a transition from warm temperate deciduous forests and temperate coniferous forests to cold temperate coniferous forests (Shen et al., 2019). The eastern Inner Mongolia, Songnen Plain, and Liaohe Plain have arid or semi-arid climates, and grasslands, temperate grasslands, and semi-arid shrub vegetation are predominant in these regions.
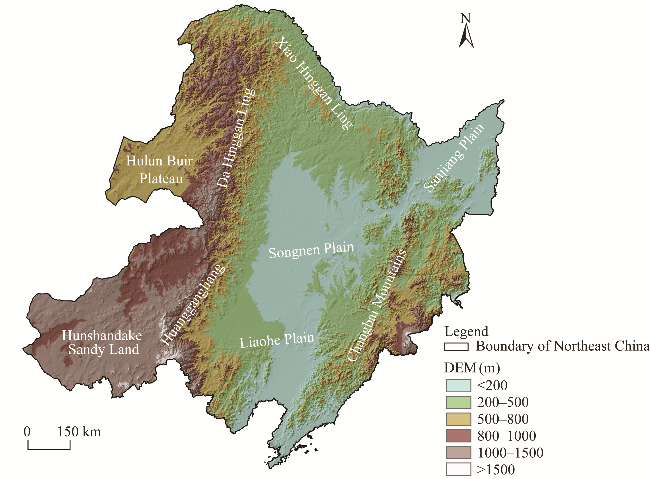
Fig. 1 Overview of Northeast China based on the digital elevation model (DEM). The boundary is based on the standard map (GS(2019)1822) of the Map Service System (https://bzdt.ch.mnr.gov.cn/), and the boundary has not been modified.
A lower soil temperature is a fundamental requirement for the formation and maintenance of permafrost in Northeast China. In addition, the presence of the Siberian High in winter leads to widespread and strong atmospheric temperature inversions, which have a significant impact on the development and distribution of permafrost in the region. Factors such as the slope aspect, vegetation, and loose layer thickness also impact the development and distribution of permafrost (Jin et al., 2007; Kudryavtsev et al., 2017). The permafrost in this region occurs mainly in valley bottoms, depressions, low terraces, shady slopes, and semi-sunny slopes, and is more developed in low landforms, known as Xing'an-Baikal permafrost (Wei et al., 2011). The permafrost in Northeast China is relatively thin and has high soil temperatures, making it particularly sensitive to climate change (Zhang et al., 2021).

2.2 Data sources

The land surface temperature (LST) data from the China National Meteorological Data Center (http://data.cma.cn/) cover data from 231 meteorological stations in Northeast China during the period 1981-2020. Before 2005, the LST data refer to the temperature of the snow surface in winter and the temperature of the land temperature in the other seasons. After 2005, the LST refers to the temperature on the land surface (half of the temperature probe is buried in the soil) (Zhang et al., 2021). After filtering out invalid data, the mean method was used to fill any data gaps. We calculated the annual freezing and thawing index from the daily average LST and interpolated the annual freezing and thawing index to raster data with a spatial resolution of 1 km using multiple linear regression and residual analysis.
The Moderate Resolution Imaging Spectroradiometer (MODIS) LST product MOD11A2 covers the years from 2002 to 2020. This dataset provides observations every 8 d at a spatial resolution of 1 km and includes both daytime and nighttime temperatures. After imputing the missing values, we calculated the daily average LST by taking the mean of the daytime and nighttime values.
The NDVI is defined as the ratio of the difference between the near-infrared and red reflectances to their sum. This index effectively represents the health and density of vegetation (Gao and Zhao, 2022; Prăvălie et al., 2022). In this study, we used NDVI data from the Global Inventory Monitoring and Modeling System (GIMMS) NDVI 3g.v1 dataset for the period 1982-2000 (with a spatial resolution of 8 km and a bimonthly temporal resolution) and the MOD13A2 dataset from 2000 to 2020 (with a spatial resolution of 1 km and a temporal resolution of 16 d). This study derived the monthly NDVI data using the maximum value composite method that combines NDVI data from different days within a month to select the maximum value. This method minimizes the effects of clouds and aerosols, providing a more accurate representation of the vegetation greenness. All of the data were resampled to a resolution of 1 km, and the average NDVI during the growing season (April-October) was calculated to generate a comprehensive long-term NDVI dataset for the study area from 1982 to 2020.
The temperature and precipitation data were obtained from the National Tibetan Plateau Third Pole Environmental Data Center (http://data.tpdc.ac.cn/zh-hans/), which is a 1-km monthly dataset for China (Peng et al., 2019; Ding and Peng, 2020). The Shuttle Radar Topography Mission digital elevation model (SRTM DEM) data with a 30-m resolution were obtained from the United States Geological Survey (https://earthexplorer.usgs.gov/).

2.3 Methods

2.3.1 SFN model

The SFN model uses the freezing index and thawing index and the relationship between them to determine the boundary among seasonal frost (SF) and different permafrost types (unstable permafrost (UP), semi-stable permafrost (SSP), and stable permafrost (SP)). The annual freezing and thawing indices were derived from the daily average LST. The formula for calculating the SFN is:
$\mathrm{SFN}=\frac{\sqrt{\mathrm{DDF}}}{\sqrt{\mathrm{DDF}}+\sqrt{\mathrm{DDT}}}$,
where DDF is the freezing index, which represents the sum of the daily average LST of less than zero in a year; and DDT is the thawing index, which represents the sum of the daily average LST of greater than zero in a year.
To extend the period of the SFN, the SFN calculated based on MODIS LST data was supplemented with the SFN calculated from the LST from the meteorological stations. The SFN from 1981 to 2001 was calculated as follows:
$\mathrm{SFN}_{a}=\eta \times \mathrm{SFN}_{a}$,
where SFNa is the SFN for the year a from 1981 to 2001; η is the average of the ratios of the SFN calculated from the MODIS LST data and meteorological station data from 2002 to 2020; and SFNma is the SFN calculated from the meteorological station data for the year a from 1981 to 2001.
The calculated SFN from 1981 to 2020 was used to establish the latitudinal zoning of the permafrost (Nelson, 1986). In this study, the classification criteria for frozen soils with different thermal stability states in Northeast China were based on extensive field surveys, field data, and monitoring results from Shan et al. (2022). Four frozen soil types were classified as follows (Shan et al., 2022): SF (0.000<SFN<0.490), UP (0.490≤SFN≤0.510), SSP (0.510<SFN<0.550), and SP (0.550≤SFN<0.667). Due to the small area of the extremely stable permafrost (SFN≥0.667), we did not conduct a detailed analysis of this type of permafrost (Shan et al., 2024).

2.3.2 Sen's slope method and Mann-Kendall test

Sen's slope estimation method, introduced by Sen in 1968 (Sen, 1968), is effective for qualitatively analyzing the time series with clear trends. This approach is robust to missing data and isolated outliers, ensuring that the calculated trend is reliable (Ge et al., 2022). The method can be expressed as follows:
$\beta=\operatorname{Median}\left(\frac{x_{k}-x_{i}}{k-i}\right), k>i,$
where β is the Sen's slope of the time series; and xk and xi are the NDVI values in the kth and ith year of the time series, respectively. If β>0, the time series shows an increasing trend; if β<0, the time series shows a decreasing trend.
The Mann-Kendall test is a nonparametric statistical test method used to determine the significance of a trend. It does not require samples to obey a certain distribution and is not affected by outliers. The calculation process and formulas are as follows:
$Z=\left\{\begin{array}{cl} \frac{S-1}{\sqrt{\operatorname{var}(S)}} & \text { if } S>0 \\ 0 & \text { if } S=0 \\ \frac{S+1}{\sqrt{\operatorname{var}(S)}} & \text { if } S<0 \end{array}\right.$,
$S=\sum_{i=1}^{n-1} \sum_{j=i+1}^{n} \operatorname{sgn}\left(x_{j}-x_{i}\right),$
$\operatorname{sgn}\left(x_{j}-x_{i}\right)=\left\{\begin{array}{ll} 1 & \text { if } x_{j}-x_{i}>0 \\ 0 & \text { if } x_{j}-x_{i}=0 \\ -1 & \text { if } x_{j}-x_{i}<0 \end{array}\right.$
$\operatorname{var}(S)=\frac{n(n-1)(2 n+5)}{18}$,
where Z is the standardized test statistic; S is the test statistic; var(S) is the variance of S; n is the length of the time series; and xj and xi are the NDVI values in the jth and ith year of the time series, respectively. Z1/2 is the value corresponding to the distribution table of the standard normal distribution function at confidence level α. If |Z|>Z1/2, at the significance level of α, the hypothesis of no trend is rejected, and there is an obvious change trend of the time series. When |Z|>1.65, |Z|>1.96, and |Z|>2.58, the trend passes the 90.00%, 95.00%, and 99.00% significance tests, respectively. In this study, we set α=0.05 and α=0.01 (Zuo et al., 2022) and divided the change trend of the NDVI as follows: extremely significant increase (Sen's slope>0.0000 and α<0.01), significant increase (Sen's slope>0.0000 and 0.01≤α<0.05), nonsignificant increase (Sen's slope>0.0000 and α≥0.05), extremely significant decrease (Sen's slope<0.0000 and α<0.01), significant decrease (Sen's slope<0.0000 and 0.01≤α<0.05), and nonsignificant decrease (Sen's slope<0.0000 and α≥0.05).

2.3.3 Mutation point analysis

The Mann-Kendall mutation test is a nonparametric statistical method used to analyze trend changes in the time series, particularly for detecting single or multiple breakpoints in univariate time series (Hirsch et al., 1982; Xing et al., 2018; Jian et al., 2022). This method involves computing the rank series of the original time series in sequential order to obtain the cumulative forward (UF) values. Similarly, the rank series in reverse order yields the cumulative backward (UB) values. For a significance level of α=0.05, the corresponding critical value is U0.05=±1.96. Mutation points are defined as the locations where the UF and UB curves intersect within this confidence interval. UF>0.00 indicates an increasing trend, while UF<0.00 indicates a decreasing trend. UF>1.96 or UF< -1.96 indicates a significant change in the trend.

2.3.4 Correlation analysis

Pearson correlation analysis was used to study the relationship between the permafrost and vegetation, mainly to explore the strength of the correlation between the SFN and NDVI. The value range of the correlation coefficient is from -1.0 to 1.0. The greater the absolute value is, the stronger the correlation is. The smaller the absolute value of the correlation coefficient is, the weaker the correlation is. The formula is as follows:
$r_{x y}=\frac{\sum_{i=1}^{n}\left(x_{i}-\bar{x}\right)\left(y_{i}-\bar{y}\right)}{\sqrt{\sum_{i=1}^{n}\left(x_{i}-\bar{x}\right)^{2}} \sqrt{\sum_{i=1}^{n}\left(y_{i}-\bar{y}\right)^{2}}},$
where rxy is the Pearson correlation coefficient between variable x and variable y; xi and yi are the values of variable x and variable y in the ith year; and $\bar{x}$ and $\bar{y}$ are the average values of variable x and variable y, respectively.
Partial correlation analysis was used to evaluate the correlation between the SFN and NDVI while eliminating the influence of temperature and precipitation (Lin et al., 2022; Zheng et al., 2022). The formula for calculating the partial correlation coefficient is as follows:
$r_{x y, z}=\frac{r_{x y}-r_{x z} r_{y z}}{\sqrt{1-r_{x z}^{2}} \sqrt{1-r_{y z}^{2}}},$
where rxy,z is the partial correlation coefficient between variables x and y, which is independent of the influence of variable z; and rxy, rxz, and ryz represent the Pearson correlation coefficient between variables x and y, variables x and z, and variables y and z, respectively.

2.3.5 Multiple linear regression model

The multiple linear regression model is a predictive analysis method that has been widely used in statistics, economics, sociology, and other fields (Wang and Liu, 2022). It explains the changes in the dependent variable Y by establishing a linear relationship between the dependent variable Y and several independent variables (X1, X2, …, Xl). The multiple linear regression model can be expressed as follows:
$Y=\beta_{1} X_{1}+\beta_{2} X_{2}+\cdots+\beta_{l} X_{l}+\varepsilon$
where β1, β2, …, and βl are the regression coefficients of independent variables X1, X2, …, and Xl, respectively, which indicate the strength of the relationship between the dependent variable and each independent variable; and ε is the error term.

3 Results

3.1 Spatial distribution of permafrost and its degradation patterns

The spatial distribution of different types of frozen soil in Northeast China during each decade from 1981 to 2020 were analyzed using the SFN model (Fig. 2). The SFN increased with increasing latitude and altitude. The permafrost region was identified as areas with SFN values ≥0.490. The permafrost area exhibited an overall decreasing trend across the four decades, and the maximum value of 3.76×10⁵ km2 was observed from 1981 to 1990, accounting for 26.11% of the study area. However, from 2011 to 2020, there was a slight increase in the permafrost extent in the eastern part of the study area. The permafrost in the study area was mainly distributed in the Da Hinggan Ling, Xiao Hinggan Ling, Hulun Buir Plateau, northern Songnen Plain, and northern Sanjiang Plain. Additionally, small patches of mountain permafrost were present in the Huanggangliang in the southwest and the Changbai Mountains in the southeast. The stability of permafrost gradually weakened from north to south. The SP mainly occurred in the Da Hinggan Ling and Xiao Hinggan Ling, while the UP occurred in the southern permafrost margin, which included areas such as the Hulun Buir Plateau, northern Songnen Plain, and northern Sanjiang Plain.
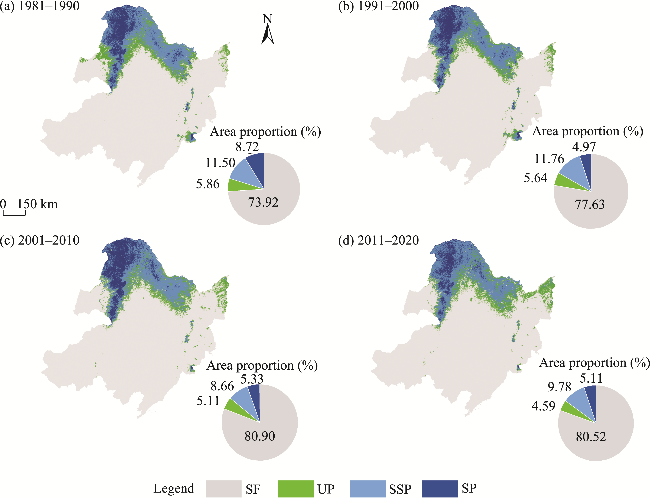
Fig. 2 Spatial distribution and area proportions of SF, UP, SSP, and SP in Northeast China during the periods of 1981-1990 (a), 1991-2000 (b), 2001-2010 (c), and 2011-2020 (d). SF, seasonal frost; UP, unstable permafrost; SSP, semi-stable permafrost; SP, stable permafrost. Note that the distributions of SF, UP, SSP, and SP for each period were based on multi-year average surface frost number (SFN).
We analyzed the conversions between different types of frozen soil during three periods: 1981-2000, 2001-2020, and 1981-2020 (Fig. 3). During 1981-2000, the permafrost in the western Hulun Buir Plateau and northern part of the Xiao Hinggan Ling was significantly degraded, dominated by the degradation of UP, and approximately 6.17×10⁴ km2 of permafrost was degraded to SF during this period. The second was the degradation of SSP to UP, with an area of 3.63×10⁴ km2. The decrease in permafrost area during 2001-2020 was comparatively smaller than that during 1981-2000; however, the overall stability of the permafrost continued to decline. During 2001-2020, transitions of SSP to UP and SP to SSP showed areas of 4.19×10⁴ and 3.95×10⁴ km2, respectively. Concurrently, the areas of SSP and UP decreased by 1.31×10⁴ and 3.75×10⁴ km2, respectively. The area of SP decreased significantly, and only limited SP remained in colder regions such as the western slope of the northern section of the Da Hinggan Ling.
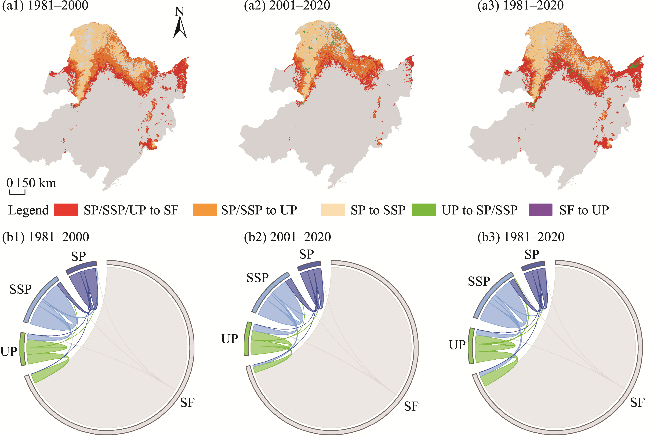
Fig. 3 Spatial distribution and chordal plot of conversions between SF, UP, SSP, and SP during the periods of 1981-2000 (a1 and b1), 2001-2020 (a2 and b2), and 1981-2020 (a3 and b3). "/" means "or".
Overall, during 1981-2020, the areas of different permafrost types in Northeast China significantly decreased, and the stability of permafrost also decreased. The degradation trend of permafrost was characterized by gradual degradation from south to north and from east to west. The total area of permafrost decreased by 1.01×10⁵ km2 during the 40-a study period. The areas of the degradation of SP, SSP, and UP to SF were 0.08×10⁴, 2.43×10⁴, and 6.86×10⁴ km2, respectively, and the degradation of UP accounted for the largest area. In addition, 0.22×10⁴ km2 of SF region was converted into permafrost region. From 1981 to 2000, most of the degradation occurred in the UP region. Although the rate of permafrost degradation slowed after 2000, the overall stability continued to weaken. Before 2000, the UP and SSP changed greatly. As the temperature rose, the permafrost degradation progressed from the periphery toward the center of the permafrost distribution area, leading to the degradation of SP.

3.2 Spatiotemporal dynamics of vegetation

Figure 4 shows that in the growing season from 1982 to 2020, the NDVI increased significantly at a rate of 0.0013/a in the permafrost region, exhibiting an initially increasing and then decreasing trend. From 1982 to 2000, the NDVI increased at a rate of 0.0008/a; from 2000 to 2020, it decreased significantly at a rate of -0.0002/a. In the UP, SSP, and SP regions, the NDVI increased significantly at rates of 0.0014/a, 0.0026/a, and 0.0047/a, respectively, from 1982 to 2020. The mean NDVI values in the three regions followed the order of UP>SSP>SP. The minimum NDVI occurred in the UP and SSP regions in 1983, while the maximum NDVI occurred in the SP region in 1993. The maximum NDVI in the permafrost region occurred in 2007. The variations in the NDVI were similar in the UP and SSP regions, exhibiting an initially increasing and then decreasing trend. Specifically speaking, during the period 1982-2000, the NDVI in the two regions showed a nonsignificant increase trend with a rate of 0.0021/a; however, after 2000, the NDVI decreased at rates of -0.0008/a and -0.0004/a, respectively. In contrast to the UP and SSP regions, the NDVI in the SP region exhibited a continuously increasing trend from 1982 to 2020. The increase was moderate (0.0002/a) from 1982 to 2000 and became significantly more pronounced (0.0015/a) after 2000. In the SF region, the NDVI continued to decrease at a rate of -0.0036/a. The rates of change were -0.0008/a from 1982 to 2000 and -0.0011/a from 2000 to 2020.
In the UP region, an abrupt change in the NDVI occurred in 1993, while in the SSP and SP regions, it occurred in 1998. The mutation years throughout the entire study area were between 1996 and 1998. The NDVI mutation point occurred around 2000 in the SF region. Around 2000, the region exhibited abnormally low NDVI values, which may due to the prolonged influence of the cold vortex meteorological conditions.
From 1982 to 2000, the NDVI exhibited an overall nonsignificant increasing trend, with increases in the northern and southern parts of the study area and decreases in the central and northeastern parts of the study area (Fig. 5a1). The Sen's slope values ranged from -0.0047 to 0.0073. The areas in which the vegetation was improved accounted for 81.06% of the total area. The areas with significant vegetation improvement accounted for 11.81% of the total area and were mainly distributed in the northern part of the Da Hinggan Ling, central part of the Xiao Hinggan Ling, and southern part of the Liaohe Plain (Fig. 5a2). The areas with significant vegetation degradation were mainly distributed in the Hulun Buir Plateau, Sanjiang Plain, and southern parts of the Da Hinggan Ling and Xiao Hinggan Ling, especially along the southern edge of the permafrost region. According to the statistics (Fig. 5a3), the vegetation changes were most significant in the SF region, in which the vegetation was improved significantly (13.56%) and the degraded area was the largest (22.12%), followed by the UP region, of which 18.81% exhibited a vegetation degradation trend. From 2000 to 2020, the Sen's slope of the NDVI was between -0.0038 and 0.0036, and 89.34% of the study area exhibited a vegetation improvement trend (Fig. 5b1). The areas where the vegetation was improved significantly in the study area increased obviously (Fig. 5b2). The vegetation degradation areas were scattered in the Hunshandake Sandy Land in Inner Mongolia and western foothills of the Changbai Mountains. Similar to the previous stage, the vegetation degradation areas were mainly located in the SF (8.89%) and UP (7.41%) regions, while the SP and SSP regions contained the largest vegetation improvement areas (Fig. 5b3).
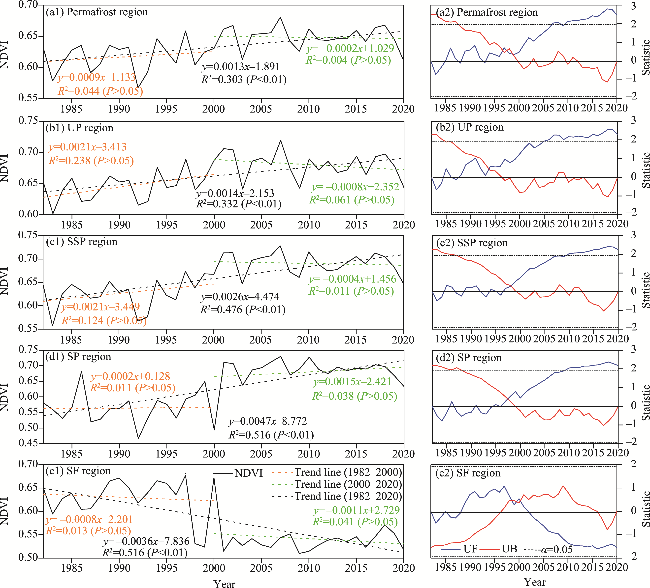
Fig. 4 Temporal variation and mutation point test of NDVI in permafrost (a1 and a2), UP (b1 and b2), SSP (c1 and c2), SP (d1 and d2), and SF (e1 and e2) regions during 1982-2020. Note that the SF, UP, SSP, and SP regions are determined based on the multi-year average SFN.
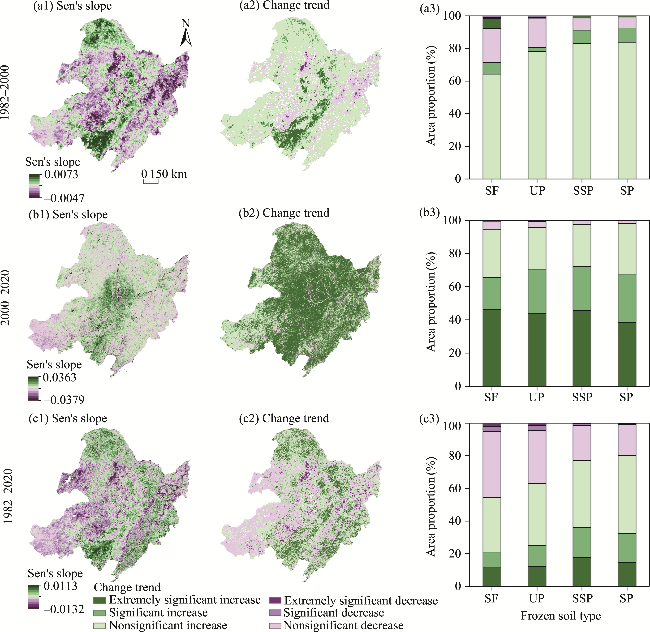
Fig. 5 Spatial variations in Sen's slope (a1-c1) and change trend (a2-c2) of NDVI as well as the statistics of the area proportion of different trends in the SF, UP, SSP, and SP regions (a3-c3) during the periods of 1982-2000, 2001-2020, and 1982-2020. Note that the SF, UP, SSP, and SP regions for each period were determined by the multi-year average SFN.
During the period 1982-2020, the spatial distribution of the Sen's slope of the NDVI was similar to that during the period 1982-2000 (Fig. 5c1). The areas that experienced vegetation degradation accounted for 40.36% of the total area and were mainly distributed in the Hulun Buir Plateau, eastern Inner Mongolia, southern part of the Sanjiang Plain, northwestern part of the Songnen Plain, and northwestern part of the Liaohe Plain. The areas where the vegetation experienced extremely significant degradation accounted for 5.57% of the total area and were mainly concentrated in the northwestern part of the Songnen Plain and Sanjiang Plain (Fig. 5c2). During this period, the vegetation degradation area was the largest, and the most significant degradation occurred in the SF and UP regions, accounting for 40.43% and 36.95% of the total degraded area, respectively (Fig. 5c3).

3.3 Relationship between permafrost and vegetation

This study calculated the Pearson correlation coefficients and partial correlation coefficients between the NDVI and SFN for the periods 1982-2000, 2000-2020, and 1982-2020. From 1982 to 2000, the areas with a positive correlation between the SFN and NDVI accounted for 75.14% of the study area and were mainly distributed in the Hulun Buir Plateau, Songnen Plain, Liaohe Plain, and southern part of the Changbai Mountains (Fig. 6a1). In contrast, the correlation was mainly negative in the Sanjiang Plain, Inner Mongolia Plateau, and northern Da Hinggan Ling and Xiao Hinggan Ling. Notably, the partial correlation coefficients between the NDVI and SFN calculated with temperature and precipitation as control variables were significantly different in the Hulun Buir Plateau (Fig. 6a2 and a3). When precipitation was used as the control variable, the NDVI and SFN were negatively correlated in the plateau. This plateau, primarily consisting of grassland and forest, is highly sensitive to precipitation (Liu et al., 2018). When the precipitation is low, permafrost degradation positively influences vegetation growth. The areas where the NDVI and SFN showed a negative correlation accounted for 31.68% of the permafrost region during this period, mainly distributed in the SP region, while positive correlations were found in the SSP, UP, and SF regions (Fig. 6a1 and a4).
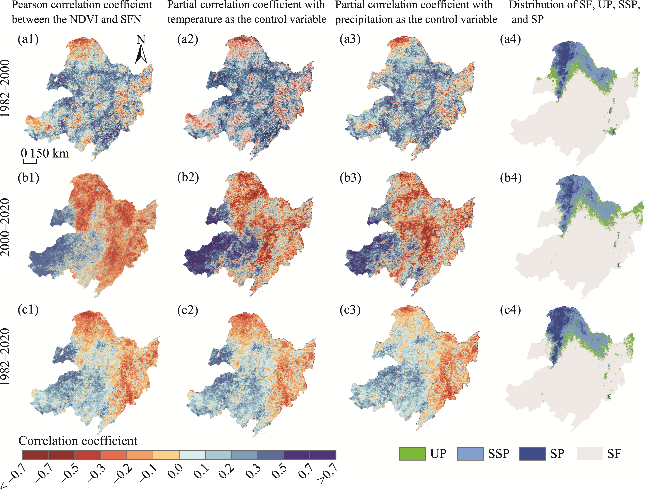
Fig. 6 Spatial distributions of the Pearson correlation coefficient, partial correlation coefficient with temperature as the control variable, and partial correlation coefficient with precipitation as the control variable between the NDVI and SFN, as well as the spatial distribution of SF, UP, SSP, and SP during the periods of 1982-2000 (a1-a4), 2000-2020 (b1-b4), and 1982-2020 (c1-c4). Note that the distributions of SF, UP, SSP, and SP for each period were determined based on the multi-year average SFN.
From 2000 to 2020, the areas with a negative correlation between the NDVI and SFN were the largest among the three study periods, and the correlation was also relatively high (Fig. 6b1-b3). This indicated that the effect of permafrost changes on vegetation intensified during this period. The areas with a negative correlation between the SFN and NDVI accounted for 60.72% of the total area and were mainly distributed in the Da Hinggan Ling, Xiao Hinggan Ling, Sanjiang Plain, Changbai Mountains, and northern part of the Songnen Plain. The correlation between the NDVI and SFN was negative in 89.68% of the permafrost region, and the areas with a positive correlation were mainly concentrated in the SSP region (Fig. 6b1 and b4).
From 1982 to 2020, the NDVI and SFN were mainly negatively correlated in the permafrost region and positively correlated in the SF region (Fig. 6c1-c4). The areas with a negative correlation between the NDVI and SFN accounted for 46.67% of the study area and 78.63% of the permafrost region. The correlation between the NDVI and SFN was positive in the southern foothills of the Xiao Hinggan Ling and northern part of the Songnen Plain, and the vegetation cover decreased with increasing permafrost degradation in these areas.

3.4 Response of vegetation to permafrost degradation

From 1982 to 2000, in addition to the significant vegetation degradation in the unchanged SF and UP regions, the areas where the other types of frozen soil were transformed into these two types also exhibited a significant degradation trend (Fig. 7a). For example, in areas where SP, SSP, and UP were transformed into SF, the vegetation degradation area accounted for 25.67%. In areas where SP and SSP were degraded into UP, the vegetation degradation area accounted for 16.63%. During the degradation from SP to SSP, the area of vegetation improvement accounted for the largest proportion, and 10.01% of the areas experienced extremely significant improvement. In addition, it is noteworthy that the extensive vegetation improvement was observed in areas where UP was transformed into SSP and SP.
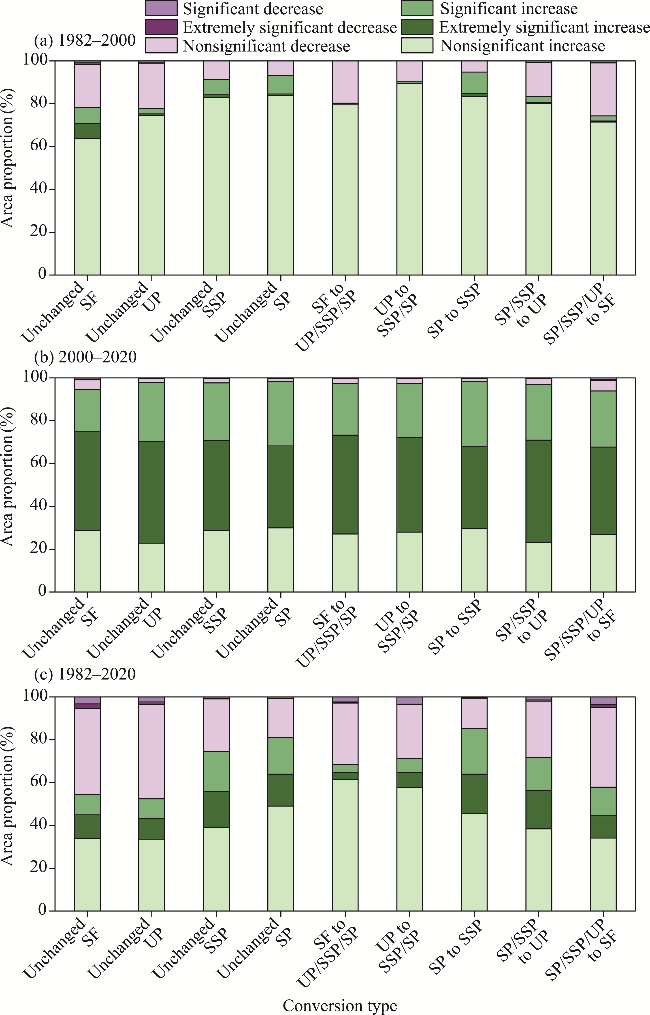
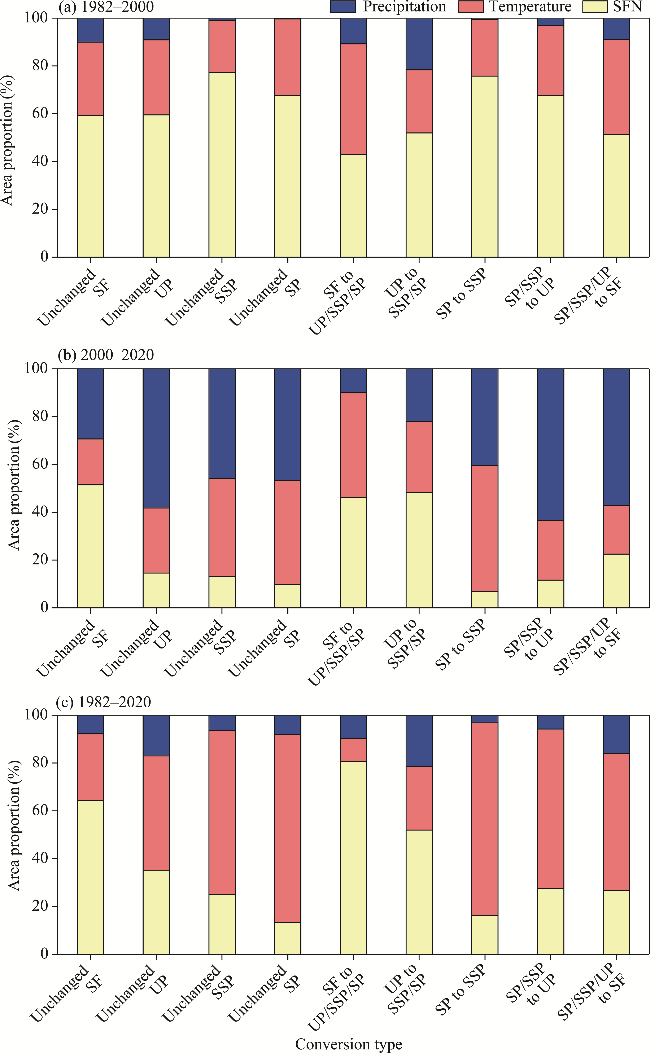
Fig. 7 Area proportions of different trends in the NDVI in regions with different conversions among the SF, UP, SSP, and SP during the periods of 1982-2000 (a), 2000-2020 (b), and 1982-2020 (c). "/" means "or".
From 2000 to 2020, a significant vegetation improvement was observed in the unchanged UP region (75.08%) and the areas where SP and SSP were transformed into UP (73.78%) (Fig. 7b). The greatest area of vegetation degradation occurred in areas where permafrost transformed into SF (8.05%), followed by the areas where SP and SSP were transformed into UP (6.07%). During the conversion from SP and SSP to UP, the vegetation improvement and degradation trends were more significant, indicating that vegetation responded strongly and rapidly to continuous weakening of permafrost stability. Changes in the surface vegetation cover may intuitively reflect the evolution process of permafrost.
From 1982 to 2020, an area of 7.61×10⁴ km2 of UP was transformed into SF, and vegetation in these areas decreased significantly (Fig. 7c). Additionally, there was significant vegetation improvement occurred in areas with enhanced permafrost stability. Approximately 0.22×10⁴ km2 of SF was converted to permafrost, and 0.97×10⁴ km2 of UP was converted to SSP and SP. Based on the above analysis, we concluded that during the degradation of permafrost to SF in Northeast China, the vegetation exhibited a degradation trend. In the process of the weakening of the permafrost stability (conversions of SP to SSP and SP (or SSP) to UP), the vegetation cover exhibited an increasing trend.

4 Discussion

This study found that in the permafrost region in Northeast China, the NDVI exhibited an increasing trend overall from 1982 to 2020, especially in the SP region. The significantly lower NDVI in 1998 than in the adjacent years can be attributed to the combined effects of heavy rainfall and flooding in that year (Mao et al., 2012b). In high-latitude regions, the increase in temperature provides good growth conditions for tree growth (Li and Liu, 2021). The vegetation changes near the southern permafrost boundary were more complex than those in the SP region, and varied in different periods. From 1982 to 2000, the vegetation degradation trend was significant in the southern permafrost boundary, where the NDVI was positively correlated with the SFN. In contrast, from 2000 to 2020, there was a marked increase in the NDVI, and the NDVI and SFN exhibited a significant negative correlation. The vegetation changes caused by permafrost degradation lag behind the permafrost degradation (Mao et al., 2012a). Changes in regional vegetation are the result of the combined action of permafrost and climatic factors. However, the dominant factors affecting the vegetation in different regions are different. Therefore, it is necessary to distinguish the effects of permafrost degradation and climate change on vegetation dynamics.

4.1 Dominant factors influencing vegetation dynamics in the permafrost degradation processes

Multiple linear regression analysis was performed to identify the primary factors influencing the NDVI across different periods (Fig. 8). From 1982 to 2000, the SFN was the main factor driving the changes in the NDVI in 61.78% of the study area, 59.21% of the SF region, 63.87% of the UP region, 77.42% of the SSP region, and 68.02% of the SP region. Temperature was the next most significant factor, and it primarily affected the NDVI changes in the Sanjiang Plain, Da Hinggan Ling, and parts of the southern Inner Mongolia Plateau. Precipitation was responsible for 7.91% of the NDVI changes, and it had notable impacts in the northwestern part of the Songnen Plain and in the arid to semi-arid areas such as the Hulun Buir Plateau and Hunshandake Sandy Land in southwestern Inner Mongolia. After 2000, precipitation emerged as the dominant factor influencing the NDVI changes in the permafrost region, and it had the greatest effect on the vegetation in the UP and SSP regions, mainly in the Xiao Hinggan Ling. The vegetation in the SP region was mainly affected by the temperature, mainly in the northern part of the Da Hinggan Ling. The degradation of permafrost weakens the precipitation insulation and retention capacity, resulting in reduced soil moisture and potential local droughts, thereby increasing the impact of precipitation on the vegetation in the permafrost degradation areas. Overall, from 1982 to 2020, temperature was the primary factor affecting the NDVI changes in the northern and northeastern high-latitude regions, accounting for 51.43% of the regional NDVI changes. In the south and southwest of the study area, the SFN was the dominant factor, accounting for 40.29% of the regional NDVI changes. Precipitation had a substantial influence on the vegetation in areas such as the Hulunbuir Plateau, Hunshandake Sandy Land, and parts of the northeastern Songnen Plain.
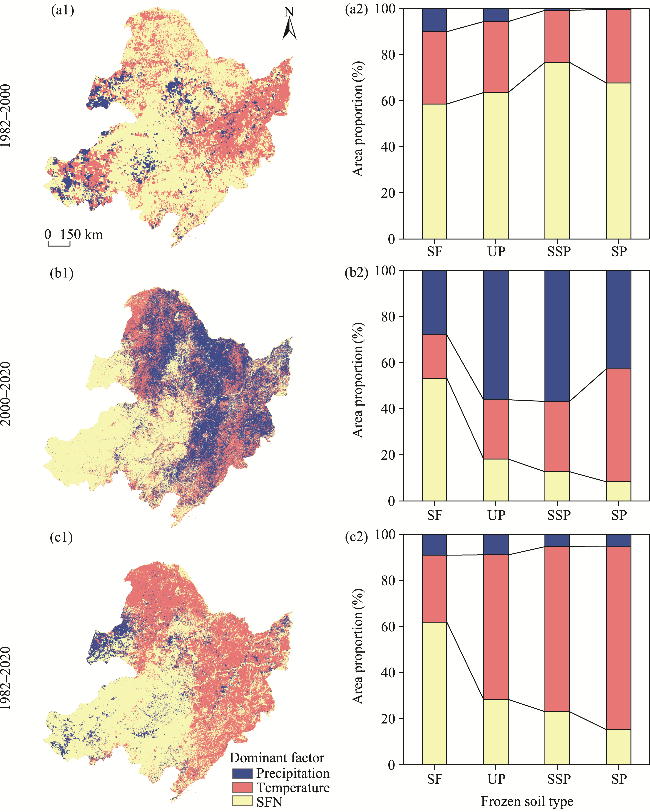
Fig. 8 Spatial variations in the dominant factors driving the NDVI changes (a1-c1) and the area proportions of the dominant factors in the SF, UP, SSP, and SP regions (a2-c2) during the periods of 1982-2000, 2000-2020, and 1982-2020
We further analyzed the dominant factors influencing the NDVI in areas with different conversions among the SF, UP, SSP, and SP (Fig. 9). In the unchanged SF region, the SFN was the dominant factor during all three periods. In the permafrost region, the SFN was dominant during the period 1982-2000, precipitation was dominant during the period 2000-2020, and temperature was dominant during the period 1982-2020. In areas with unchanged SSP and where the SP was transformed into SSP, the SFN and temperature were the dominant factors affecting the NDVI from 1982 to 2000 and from 2000 to 2020, respectively. Compared with the low-latitude regions, the vegetation at higher latitudes was more strongly influenced by temperature and permafrost, and permafrost was the main factor limiting the vegetation activity (Liu et al., 2023). From 1982 to 2000 and from 1982 to 2020, precipitation was a more significant factor affecting the NDVI in areas where SP and SSP were transformed into UP and SF. Similarly, this dominance was observed in areas where UP and SF were transformed into SP and SSP. The permafrost in these regions is relatively fragile and has a higher sensitivity to climate change. Prolonged climate warming may disrupt the balance between vegetation and permafrost (Wang et al., 2012). Due to different water supply conditions at different altitudes, the dominant factors affecting the NDVI are also very complex. Increased precipitation is conducive to the recovery and increase of vegetation cover (Heijmans et al., 2022), which subsequently influences permafrost development, potentially leading to improved permafrost stability in certain areas.
Fig. 9 Area proportions of different dominant factors in areas with different conversions among the SF, UP, SSP, and SP during the periods of 1982-2000 (a), 2000-2020 (b), and 1982-2020 (c). "/" means "or".

4.2 Impacts of topography on permafrost degradation and vegetation

Topography controls the horizontal and vertical redistribution of soil moisture and is an important factor influencing the distribution of permafrost and carbon storage in boreal forests and wetland vegetation (Yang et al., 2010; Li et al., 2021). To further investigate the effects of topography on permafrost and vegetation changes, we analyzed the altitude distribution of areas with vegetation improvement and vegetation degradation in the permafrost and SF regions from 1982 to 2020 (Fig. 10). In the permafrost region, 89.50% of the vegetation improvement areas were located at altitudes of 200-1000 m, and the largest areas with significant improvement were located between 400 and 500 m. There were two peaks in the altitude distribution of the areas with significant vegetation degradation and extremely significant vegetation degradation (Fig. 10b1 and b2), namely, at 200-400 and 600-800 m, respectively. This indicated that vegetation was degraded in both low- and high-altitude permafrost regions and the degraded area was larger in low-altitude regions than in high-altitude regions.
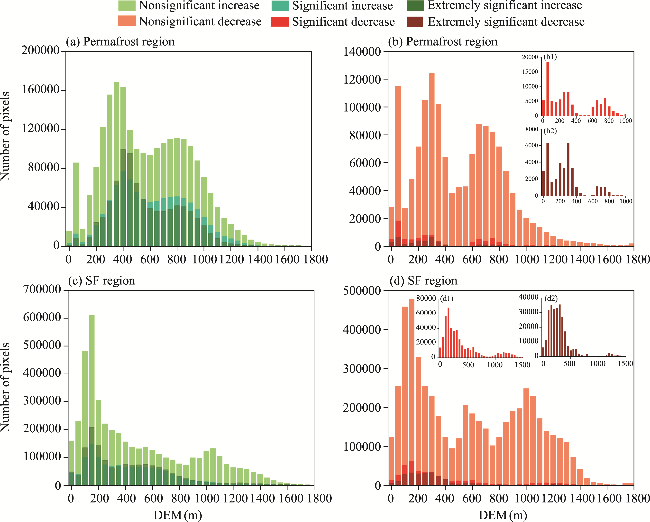
Fig. 10 Altitude distributions of the areas showing increase in the NDVI (a and c) and showing decrease in the NDVI (b and d) in the permafrost and SF regions during 1982-2020. The division of the permafrost and SF regions is based on the multi-year average SFN. Figure 10b1 and d1 show the altitude distribution of the areas showing significant decrease in the NDVI, and Figure 10b2 and d2 show the altitude distribution of the areas showing extremely significant decrease in the NDVI.
Figure 11 shows the altitude distribution of areas with different conversions among the SF, UP, SSP, and SP from 1981 to 2020. It was found that there were also two peaks in the altitude distribution of the areas with conversions from SSP to SF and from SP to UP. The permafrost degradation area was significantly larger in high-altitude regions than in low-altitude regions. The areas with conversions of SSP to SF and SP to UP accounted for 76.57% and 53.64%, respectively, in the altitude range of 800-1300 m. The high-altitude regions where the vegetation degraded in the permafrost region were located in the southern Da Hinggan Ling and Changbai Mountains (Fig. 12a). During the permafrost degradation process at high altitudes, for soils with large active layer thickness and well-drained soils, permafrost degradation reduces soil moisture required for plant growth, leading to root wilting and thus a reduction in vegetation cover (Peng et al., 2003; Zhang et al., 2004).
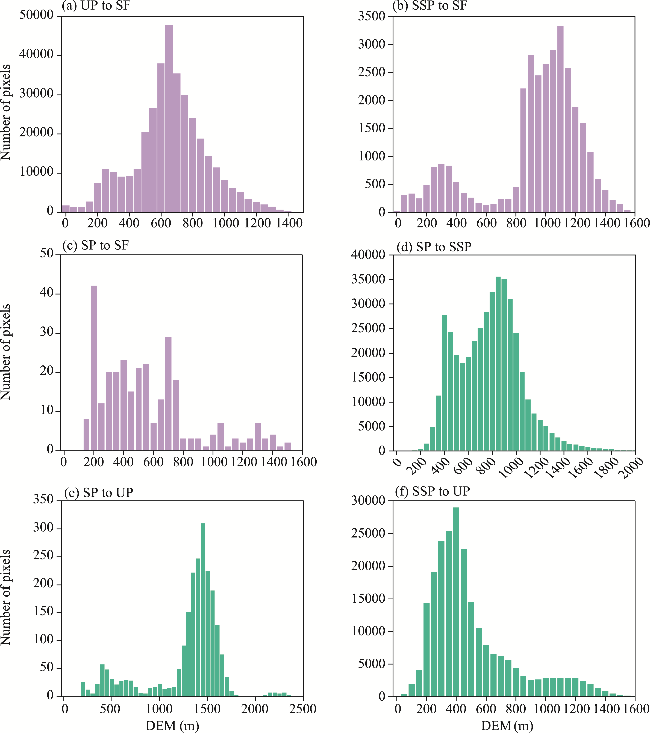
Fig. 11 Altitude distribution of the areas with various types of permafrost degradation including UP to SF (a), SSP to SF (b), SP to SF (c), SP to SSP (d), SP to UP (e), SSP to UP (f) during 1981-2020
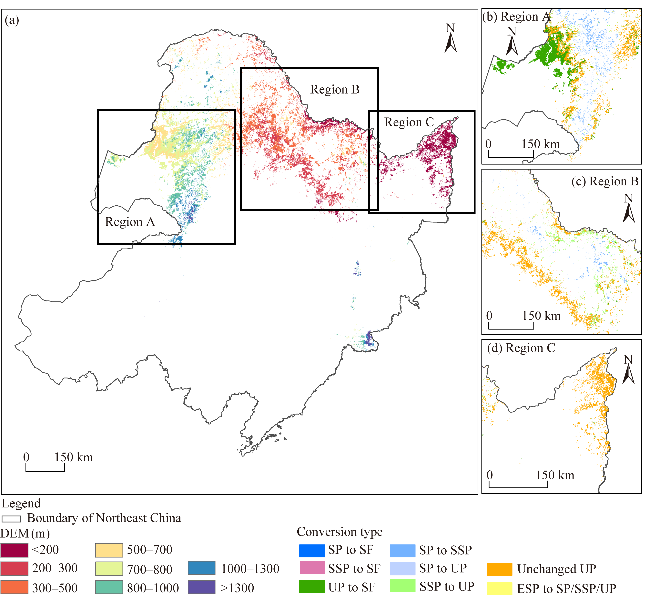
Fig. 12 Altitude distribution of the areas with extremely significant vegetation degradation in the permafrost region (a) during 1982-2020 and the distribution of different conversions among SF, UP, SSP, and SP in the three typical areas (b-d) during 1981-2020. "/" means "or". The boundary is based on the standard map (GS(2019)1822) of the Map Service System (https://bzdt.ch.mnr.gov.cn/), and the boundary has not been modified.
The low-altitude regions with extremely significant increase in the NDVI were mainly distributed on the southern and northern slopes of the Xiao Hinggan Ling and Sanjiang Plain. The island-shaped permafrost region in the southern part of the Xiao Hinggan Ling contained the most degraded vegetation (Myneni et al., 1997). Due to the influence of permafrost, large areas of forests were converted to grasslands, reducing the vegetation cover. Furthermore, wetlands and forests were also destroyed by mining, land reclamation, and other human activities. Many swamp wetlands near the southern boundary of the permafrost region were converted into extensive farmland. The average annual soil temperature in the shallow layers of farmland is significantly higher than that in wetlands, accelerating permafrost degradation (Chen et al., 2012; Wang et al., 2012). Additionally, swamp wetlands contain organic-rich soils with a high thermal conductivity, which significantly alters the heat conduction of the underlying soil strata. This conversion increases the instability of the soil organic matter in wetlands, accelerating its decomposition and thereby affecting the active layer thickness and vegetation growth (Che et al., 2022, 2023). Permafrost degradation is a long-term dynamic process with a hysteresis effect. In the SP region, which is mainly located in the northeastern part of the Da Hinggan Ling, the vegetation cover is currently increasing significantly and will also be at risk of degradation in the future. The responses of different types of vegetation to permafrost degradation also require attention.

4.3 Limitations and prospects

The analysis of permafrost changes and their effects on vegetation predominantly focused on static periods. Future research should delve into dynamic changes and spatiotemporal responses across extended periods. Comprehensive analysis and robust evidence are essential to elucidating the spatial heterogeneity of vegetation changes over different temporal scales. Additionally, the type of vegetation and human disturbances are critical factors influencing these changes in the permafrost region, and thus, targeted investigations need to be conducted. Furthermore, monitoring ecological changes in the microtopography in the permafrost region demands enhanced remote sensing data with higher temporal and spatial resolutions, as well as extensive field measurements for the verification and calibration of remote sensing and reanalysis data.

5 Conclusions

This study clarified the dynamic response of vegetation to permafrost degradation during the period 1982-2020, and discussed the main factors driving vegetation changes in the permafrost degradation processes. Over the past 40 a, the permafrost in Northeast China exhibited a spatial degradation trend from south to north and from east to west, and its stability continued to weaken. The main type of permafrost degradation was the conversion from UP to SF. From 1982 to 2020, the NDVI exhibited decreasing and increasing trends in the SF and permafrost regions, respectively. The spatial variation trend of the NDVI showed that when the permafrost stability weakened, such as conversions from SP to SSP and from SP (or SSP) to UP, the vegetation exhibited an improvement trend, while under the conversions from various permafrost types to SF, the vegetation exhibited a degradation trend. In the UP and SSP regions, the correlation between the SFN and NDVI was significantly different in different periods. After 2000, the NDVI was negatively correlated with the SFN in 89.68% of the permafrost region, and the permafrost degradation was conducive to vegetation growth. However, over the entire study period (1982-2020), the NDVI was positively correlated with the SFN on the southern permafrost boundary, where the vegetation was sensitive to changes in climate and permafrost, and the interaction between the permafrost and vegetation in the UP region was complex and required the consideration of many variables. The results can provide basic scientific data for resource development, ecological construction, and environmental protection in high-latitude regions, as well as a reference for the analysis of carbon balance and surface cycle processes in permafrost ecosystems.

Conflict of interest

The authors declare that they have no known competing financial interests or personal relationships that could have appeared to influence the work reported in this paper.

Acknowledgements

This research was funded by the National Natural Science Foundation of China (41641024), the Science and the Technology Project of Heilongjiang Communications Investment Group (JT-100000-ZC-FW-2021-0182), and the Field Scientific Observation and Research Station of the Ministry of Education-Geological Environment System of the Permafrost Area in Northeast China (MEORS-PGSNEC).

Author contributions

Conceptualization: QIU Lisha, SHAN Wei; Methodology: QIU Lisha; Formal analysis: QIU Lisha, LIU Shuai; Writing - original draft preparation: QIU Lisha; Writing - review and editing: ZHANG Chengcheng, LIU Shuai; Funding acquisition: SHAN Wei, GUO Ying; Resources: QIU Lisha, SHAN Wei; Supervision: LIU Shuai, YAN Aoxiang. All authors approved the manuscript.
[1]
Chadburn S E, Burke E J, Cox P M, et al. 2017. An observation-based constraint on permafrost loss as a function of global warming. Nature Climate Change, 7(5): 340-344.

[2]
Che L N, Cheng M Y, Xing L B, et al. 2022. Effects of permafrost degradation on soil organic matter turnover and plant growth. Catena, 208(3): 105721, doi: 10.1016/j.catena.2021.105721.

[3]
Che L N, Zhang H H, Wan L H. 2023. Spatial distribution of permafrost degradation and its impact on vegetation phenology from 2000 to 2020. Science of the Total Environment, 877(3): 162889, doi: 10.1016/j.scitotenv.2023.162889.

[4]
Chen S S, Zang S Y, Sun L. 2018. Permafrost degradation in Northeast China and its environmental effects: present situation and prospect. Journal of Glaciology and Geocryology, 40(2): 298-306. (in Chinese)

[5]
Chen S Y, Liu W J, Qin X, et al. 2012. Response characteristics of vegetation and soil environment to permafrost degradation in the upstream regions of the Shule River Basin. Environmental Research Letters, 7(4): 045406, doi: 10.1088/1748-9326/7/4/045406.

[6]
Dang Y C, Qin L J, Huang L R, et al. 2022. Water footprint of rain-fed maize in different growth stages and associated climatic driving forces in Northeast China. Agricultural Water Management, 263: 107463, doi: 10.1016/j.agwat.2022.107463.

[7]
Ding Y, Peng S. 2020. Spatiotemporal trends and attribution of drought across China from 1901-2100. Sustainability, 12(2): 477, doi: 10.3390/su12020477.

[8]
Gao X, Zhao D S. 2022. Impacts of climate change on vegetation phenology over the Great Lakes Region of Central Asia from 1982 to 2014. Science of the Total Environment, 845(2): 157227, doi: 10.1016/j.scitotenv.2022.157227.

[9]
Ge C H, Sun S, Yao R, et al. 2022. Long-term vegetation phenology changes and response to multi-scale meteorological drought on the Loess Plateau, China. Journal of Hydrology, 614: 128605, doi: 10.1016/j.jhydrol.2022.128605.

[10]
Guo J T, Han F L, Hu Y M, et al. 2017a. Ecological characteristics of vegetation and their responses to permafrost degradation in the north slope of Great Khingan Mountain valley of Northeast China. Acta Ecologica Sinica, 37(19): 6552-6561. (in Chinese)

[11]
Guo J T, Hu Y M, Xiong Z P, et al. 2017b. Spatiotemporal variations of growing-season NDVI and response to climate change in permafrost zone of Northeast China. Chinese Journal of Applied Ecology, 28(8): 2413-2422. (in Chinese)

[12]
Guo J T, Hu Y M, Bu R C. 2022. Effect of degradation of permafrost in the northeast of China on seasonal change of vegetation NDVI. Journal of Inner Mongolia Normal University (Natural Science Edition), 51(1): 50-56. (in Chinese)

[13]
Heijmans M M P D, Magnússon R Í, Lara M J, et al. 2022. Tundra vegetation change and impacts on permafrost. Nature Reviews Earth & Environment, 3(1): 68-84.

[14]
Hirsch R M, Slack J R, Smith R A. 1982. Techniques of trend analysis for monthly water quality data. Water Resources Research, 18(1): 107-121.

[15]
Jian S Q, Yin C Y, Wang Y F, et al. 2022. The possible incoming runoff under extreme rainfall event in the Fenhe River Basin. Frontiers in Environmental Science, 10: 812351, doi: 10.3389/fenvs.2022.812351.

[16]
Jin H J, Yu Q H, L Z, et al. 2007. Degradation of permafrost in the Xing'anling Mountains, Northeastern China. Permafrost and Periglacial Processes, 18(3): 245-258.

[17]
Jin X Y, Jin H J, Iwahana G, et al. 2021. Impacts of climate-induced permafrost degradation on vegetation: A review. Advances in Climate Change Research, 12(1): 29-47.

[18]
Kudryavtsev S A, Kazharsky A V A V, Goncharova E D, et al. 2017. Embankment on permafrost eastern polygon of Baikal-Amur mainline. Procedia Engineering, 189: 774-782.

[19]
Li X, Xu J W, Jia Y Y, et al. 2024. Spatio-temporal dynamics of vegetation over cloudy areas in Southwest China retrieved from four NDVI products. Ecological Informatics, 81: 102630, doi: 10.1016/j.ecoinf.2024.102630.

[20]
Li Y Y, Liu H Y. 2021. Responses of vegetation growth to climate change in permafrost distribution region in Northeast China. Acta Scientiarum Naturalium Universitatis Pekinensis, 57(4): 783-789. (in Chinese)

[21]
Li Y Y, Liu H Y, Zhu X R, et al. 2021. How permafrost degradation threatens boreal forest growth on its southern margin? Science of the Total Environment, 762(2): 143154, doi: 10.1016/j.scitotenv.2020.143154.

[22]
Lin M, Hou L Z, Qi Z M, et al. 2022. Impacts of climate change and human activities on vegetation NDVI in China's Mu Us Sandy Land during 2000-2019. Ecological Indicators, 142: 109164, doi: 10.1016/j.ecolind.2022.109164.

[23]
Liu H Y, Cheng Y, Anenkhonov O A, et al. 2023. Dynamics of the climate-permafrost-vegetation coupling system at its southernmost zone in Eurasia under climate warming. Fundamental Research, doi: 10.1016/j.fmre.2023.06.014.

[24]
Liu J F, Ma S, Li S, et al. 2018. Changes in vegetation NDVI from 1982 to 2016 and its responses to climate change in the black-soil area of Northeast China. Acta Ecologica Sinica, 38(21): 7647-7657. (in Chinese)

[25]
Lloyd A H, Yoshikawa K, Fastie C L, et al. 2003. Effects of permafrost degradation on woody vegetation at arctic treeline on the Seward Peninsula, Alaska. Permafrost and Periglacial Processes, 14(2): 93-101.

[26]
Mao D H, Wang Z M, Luo L, et al. 2012a. Integrating AVHRR and MODIS data to monitor NDVI changes and their relationships with climatic parameters in Northeast China. International Journal of Applied Earth Observation and Geoinformation, 18(1): 528-536.

[27]
Mao D H, Wang Z M, Luo L, et al. 2012b. Dynamic changes of vegetation net primary productivity in permafrost zone of Northeast China in 1982-2009 in response to global change. Chinese Journal of Applied Ecology, 23(6): 1511-1519. (in Chinese)

[28]
Muller S W. 1948. Permafrost or permanently frozen ground and related engineering problems. Geographical Review, 38: 686, doi: 10.2307/211462.

[29]
Myneni R B, Keeling C D, Tucker C J, et al. 1997. Increased plant growth in the northern high latitudes from 1981 to 1991. Nature, 386(6626): 698-702.

[30]
Nelson F E. 1986. Permafrost distribution in central Canada: Applications of a climate‐based predictive model. Annals of the Association of American Geographers, 76(4): 550-569.

[31]
Peng S Z, Ding Y X, Liu W Z, et al. 2019. 1 km monthly temperature and precipitation dataset for China from 1901 to 2017. Earth System Science Data, 11(4): 1931-1946.

[32]
Peng X M, Wu Q B, Tian M Z. 2003. The effect of groundwater table lowering on ecological environment in the headwaters of the Yellow River. Journal of Glaciology and Geocryology, 25(6): 667-671. (in Chinese)

[33]
Permafrost Subcommittee, Associate Committee on Geotechnical Research. 1988. Glossary of Permafrost and Related Ground-ice Terms. National Research Council of Canada, Ottawa. Technical Memorandum No. 142, 1-156.

[34]
Prăvălie R, Sîrodoev I, Nita I A, et al. 2022. NDVI-based ecological dynamics of forest vegetation and its relationship to climate change in Romania during 1987-2018. Ecological Indicators, 136(2): 108629, doi: 10.1016/j.ecolind.2022.108629.

[35]
Schuur E A G, McGuire A D, Schädel C, et al. 2015. Climate change and the permafrost carbon feedback. Nature, 520(7546): 171-179.

[36]
Sen P K. 1968. Estimates of the regression coefficient based on Kendall's tau. Journal of the American Statistical Association, 63(324): 1379-1389.

[37]
Shan W, Zhang C C, Guo Y, et al. 2022. Spatial distribution and variation characteristics of permafrost temperature in Northeast China. Sustainability, 14(13): 8178, doi: 10.3390/su14138178.

[38]
Shan W, Qiu L S, Guo Y, et al. 2024. Long-term changes in the permafrost temperature and surface frost number in Northeast China. Atmosphere, 15(6): 652, doi: 10.3390/atmos15060652.

[39]
Shen X J, Liu B H, Xue Z S, et al. 2019. Spatiotemporal variation in vegetation spring phenology and its response to climate change in freshwater marshes of Northeast China. Science of the Total Environment, 666: 1169-1177.

[40]
Shur Y L, Jorgenson M T. 2007. Patterns of permafrost formation and degradation in relation to climate and ecosystems. Permafrost and Periglacial Processes, 18(1): 7-19.

[41]
Singarayer J S, Valdes P J. 2010. High-latitude climate sensitivity to ice-sheet forcing over the last 120 kyr. Quaternary Science Reviews, 29(1-2): 43-55.

[42]
Wang J, Liu D S. 2022. Vegetation green-up date is more sensitive to permafrost degradation than climate change in spring across the northern permafrost region. Global Change Biology, 28(4): 1569-1582.

[43]
Wang Z R, Yang G J, Yi S H, et al. 2012. Different response of vegetation to permafrost change in semi-arid and semi-humid regions in Qinghai-Tibetan Plateau. Environmental Earth Sciences, 66: 985-991.

[44]
Wei Z, Jin H J, Zhang J M, et al. 2011. Prediction of permafrost changes in Northeastern China under a changing climate. Science China Earth Sciences, 54(6): 924-935.

[45]
Westermann S, Østby T I, Gisnås K, et al. 2015. A ground temperature map of the North Atlantic permafrost region based on remote sensing and reanalysis data. The Cryosphere, 9(3): 1303-1319.

[46]
Xiang H X, Zhang J, Mao D H, et al. 2022. Identifying spatial similarities and mismatches between supply and demand of ecosystem services for sustainable Northeast China. Ecological Indicators, 134: 108501, doi: 10.1016/j.ecolind.2021.108501.

[47]
Xing L L, Huang L X, Chi G Y, et al. 2018. A dynamic study of a karst spring based on wavelet analysis and the Mann-Kendall trend test. Water, 10(6): 698, doi: 10.3390/w10060698.

[48]
Yang Z P, Ou Y H, Xu X L, et al. 2010. Effects of permafrost degradation on ecosystems. Acta Ecologica Sinica, 30(1): 33-39.

[49]
Zhang H, Zhou G S, Liu D L, et al. 2019. Climate-associated rice yield change in the Northeast China Plain: A simulation analysis based on CMIP5 multi-model ensemble projection. Science of the Total Environment, 666: 126-138.

[50]
Zhang S Q, Wang Y G, Zhao Y Z, et al. 2004. Permafrost degradation and its environmental sequent in the source regions of the Yellow River. Journal of Glaciology and Geocryology, 26(1): 1-6. (in Chinese)

[51]
Zhang T, Barry R G, Knowles K, et al. 1999. Statistics and characteristics of permafrost and ground‐ice distribution in the Northern Hemisphere. Polar Geography, 23(2): 132-154.

[52]
Zhang Z Q, Wu Q B, Hou M T, et al. 2021. Permafrost change in Northeast China in the 1950s-2010s. Advances in Climate Change Research, 12(1): 18-28.

[53]
Zheng W R, Liu Y Q, Yang X G, et al. 2022. Spatiotemporal variations of forest vegetation phenology and its response to climate change in northeast China. Remote Sensing, 14(12): 2909, doi: 10.3390/rs14122909.

[54]
Zuo Y F, Li Y H, He K N, et al. 2022. Temporal and spatial variation characteristics of vegetation coverage and quantitative analysis of its potential driving forces in the Qilian Mountains, China, 2000-2020. Ecological Indicators, 143: 109429, doi: 10.1016/j.ecolind.2022.109429.

文章导航

/