
Effect of wood vinegar on the release of calcium, magnesium, and phosphorus from calcareous soils in different land uses
Received date: 2025-01-12
Revised date: 2025-04-07
Accepted date: 2025-05-04
Online published: 2025-08-12
Soheila Sadat HASHEMI . [J]. Journal of Arid Land, 2025 , 17(5) : 680 -695 . DOI: 10.1007/s40333-025-0099-2
The release of essential nutrients from soil minerals for plant growth in calcareous soils, facilitated by organic extractants, is critical in semi-arid areas, particularly for elements affected by high soil pH. This study aims to investigate the release of calcium (Ca), magnesium (Mg), and phosphorus (P) through the application of wood vinegar extract in surface calcareous soils in Borojerd City, Lorestan Province, Iran. The experiment was conducted using a completely randomized design with three replications. The treatments included soils from three different land uses: vineyard, wheat field, and rangeland, each treated with 1.00% wood vinegar solution. Cumulative measurements of the specified elements were recorded over 10 consecutive 0.5 h intervals. The release data were analyzed using four various kinetic models (Elovich equation, parabolic diffusion law, power function equation, and zero-order kinetics). The highest concentrations recorded were for Ca (39,500.00 mg/kg), Mg (5880.00 mg/kg), and P (5.00 mg/kg) in grape cultivation. The findings revealed a significant difference in Ca release between grape cultivation and rangeland (P<0.01), while the Mg release showed a significant difference between both grape cultivation and rangeland and wheat cultivation (P<0.01). Additionally, the cumulative release of P showed significant differences between grape cultivation and both wheat and rangeland (P<0.01). The results indicated that the zero-order kinetics provided the best fit for the data (R2=0.99). The maximum initial release amount was observed in grape cultivation when applying the zero-order kinetics, while the highest release rate was achieved using the parabolic diffusion law across three applications. Wood vinegar had the capacity to degrade various clay minerals, including vermiculite, smectite, palygorskite, and, to some extent, illite, resulting in the release of associated elements. Consequently, it can be concluded that wood vinegar can be effectively utilized in grape cultivation as an agent for reducing soil acidity, thereby enhancing the availability of soil nutrients and decreasing reliance on chemical fertilizers.
Key words: X-ray diffraction; kinetics analysis; vineyard; wheat field; rangeland; vermiculite
Table 1 Property of the wood vinegar used in this study |
| Substance | pH | EC (dS/m) | Content (%) | Concentration (mg/kg) | ||||||
|---|---|---|---|---|---|---|---|---|---|---|
| OC | TN | P | K | Fe | Mn | Zn | Cu | |||
| Wood vinegar | 3.54 | 5.15 | 10.11 | 0.05 | Trace | 0.01 | 40.42 | Trace | 5.51 | 2.81 |
Note: EC, electrical conductivity; OC, organic carbon; TN, total nitrogen; P, phosphorus; K, potassium; Fe, ferrum; Mn, manganuse; Zn, zinc; Cu, copper. Trace means the substance is undetectable with Inductively Coupled Plasma (ICP) device. |
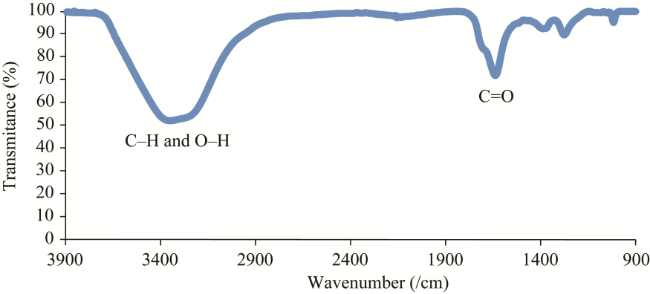
Fig. 1 Spectrum of the wood vinegar used in this study measured by Fourier-transform infrared spectroscopy (FTIR) |
Table 2 Mathematical formula of kinetics |
| Equation | Formula | Description | Reference |
|---|---|---|---|
| Elovich equation | Y is the quantity of the element released at time t (mg/kg); a and b are constants, of which, a is the intercept of equation from the origin and b is the slope of equation; and t is the release duration (h). | Sparks (1989) | |
| Parabolic diffusion law | Havlin et al. (1985) | ||
| Power function equation | Havlin et al. (1985) | ||
| Zero-order kinetics | Y° is the maximum quantity of the element released at t time (mg/kg). | Martin and Spark (1983) |
Table 3 Physico-chemical properties of the soils under investigation |
| Land use | Sample site | Proportion (%) | pH | Content (mg/kg) | CEC (cmol/kg) | EC (dS/m) | Content (%) | |||||
|---|---|---|---|---|---|---|---|---|---|---|---|---|
| Clay | Silt | Sand | Soluble Ca | Soluble Mg | Olsen P | OC | CCE | |||||
| Vineyard | 1 | 36.00 | 42.00 | 22.00 | 7.32 | 750.12 | 180.05 | 17.00 | 20.21 | 0.22 | 1.43 | 35.12 |
| 2 | 24.00 | 50.00 | 26.00 | 7.34 | 1002.03 | 135.13 | 16.52 | 10.32 | 0.15 | 0.62 | 25.04 | |
| 3 | 24.00 | 28.00 | 48.00 | 7.42 | 820.05 | 165.32 | 15.04 | 19.52 | 0.15 | 0.91 | 35.32 | |
| Wheat field | 4 | 21.00 | 18.00 | 61.00 | 7.91 | 675.22 | 120.05 | 7.62 | 11.64 | 1.42 | 2.43 | 21.23 |
| 5 | 23.00 | 18.00 | 59.00 | 6.82 | 725.12 | 105.14 | 8.51 | 11.21 | 1.71 | 2.42 | 22.22 | |
| 6 | 31.00 | 9.00 | 60.00 | 7.63 | 530.22 | 75.11 | 6.52 | 10.00 | 1.81 | 2.00 | 18.61 | |
| Rangeland | 7 | 22.00 | 15.00 | 63.00 | 7.13 | 450.06 | 90.13 | 4.03 | 7.81 | 1.52 | 2.82 | 16.11 |
| 8 | 30.00 | 11.00 | 59.00 | 7.13 | 525.03 | 75.03 | 5.21 | 9.21 | 1.42 | 2.83 | 15.14 | |
| 9 | 24.00 | 7.00 | 69.00 | 7.24 | 375.11 | 45.10 | 6.00 | 10.81 | 1.42 | 2.64 | 26.12 | |
Note: Ca, calcium; Mg, magnesium; CEC, cation exchange capacity; CCE, calcium carbonate equivalent. Olsen P means available P for plant. |
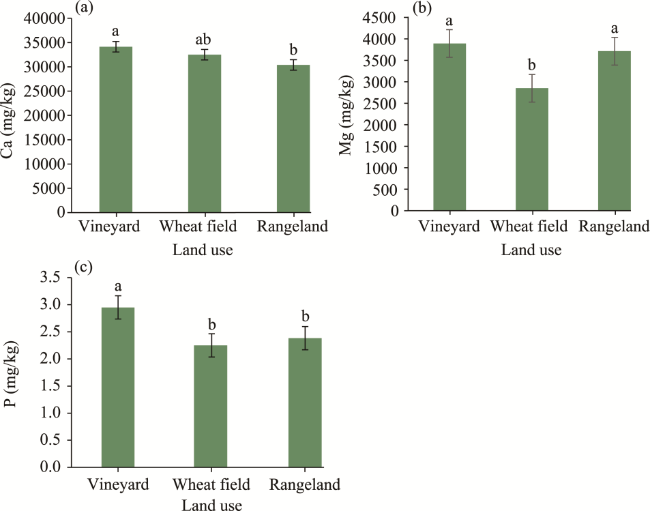
Table 4 Release range of various elements using the wood vinegar in different types of crop land |
| Land use | Average cumulative release (mg/kg) | ||
|---|---|---|---|
| Ca | Mg | P | |
| Vineyard | 31,000.00-39,500.00a | 2400.00-5880.00a | 1.52-5.00a |
| Wheat field | 31,400.00-33,200.00ab | 2400.00-3540.00b | 1.65-2.75b |
| Rangeland | 28,800.00-31,400.00b | 3240.00-4500.00a | 1.53-2.85b |
Note: Different lowercase letters within the same colomn indicate significant differences among different types of crop land at P<0.01 level. |
Fig. 2 Comparison of the average cumulative Ca (a), Mg (b), and P (c) released by wood vinegar in different cultivation lands. Ca, calcium; Mg, magnesium; P, phosphorus. Different lowercase letters indicate significant differences among different types of crop land at P<0.01 level. |
Fig. 3 Kinetics curve of Ca (a), Mg (b), and P (c) release from soil in different cultivation lands |
Table 5 Comparison of elements released with different extractants |
| Extractant | Concentration | Duration | Cumulative release (mg/kg) | Reference | ||
|---|---|---|---|---|---|---|
| Ca | Mg | P | ||||
| Acetic acid | 10 mM | 1.0 h | 1078.00 | 2797.00 | 4.23 | Etemadian et al. (2018) |
| Nitric acid | 0.1 N | 256.0 h | - | - | 3.85 | Sokhanvar Mahani et al. (2023) |
| Mixture of citric acid and oxalic acid | 10 mM | 5.0 h | 2986.00 | 1728.00 | - | Chahardoli (2022) |
| Ammonium acetate | 1.0 N | 60 d | - | 239.37 | - | Dash et al. (2023) |
| 1.0 N | 1.0 h | 1081.00 | 126.00 | - | Senthurpandian et al. (2009) | |
| Citric acid | 10 mM | 24.0 h | - | - | 8.40 | Lü et al. (2015) |
| Calcium chloride | 10 mM | 3.0 h | - | - | 46.42 | Jalali and Ahmadi Mohammad Zinli (2011) |
| Wood vinegar | 1.00% | 5.0 h | 39,500.00 | 5880.00 | 5.00 | This research |
Note: -, no data. |
Table 6 Coefficient of determination (R2) and standard error (SE) of estimation for kinetic equations used to assess the release rates of Ca, Mg, and P with wood vinegar extractant in different cultivation lands |
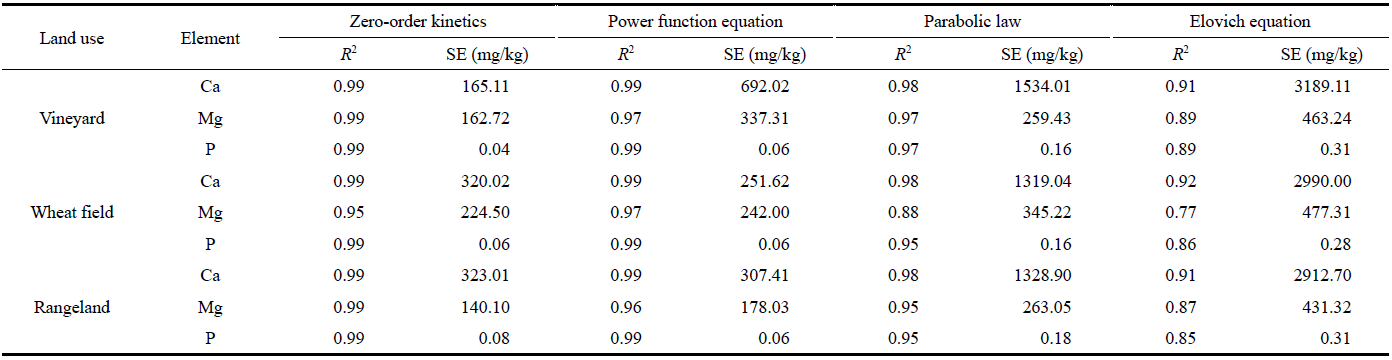 |
Table 7 Release rate of Ca, Mg, and P with wood vinegar extractant in different cultivation lands |
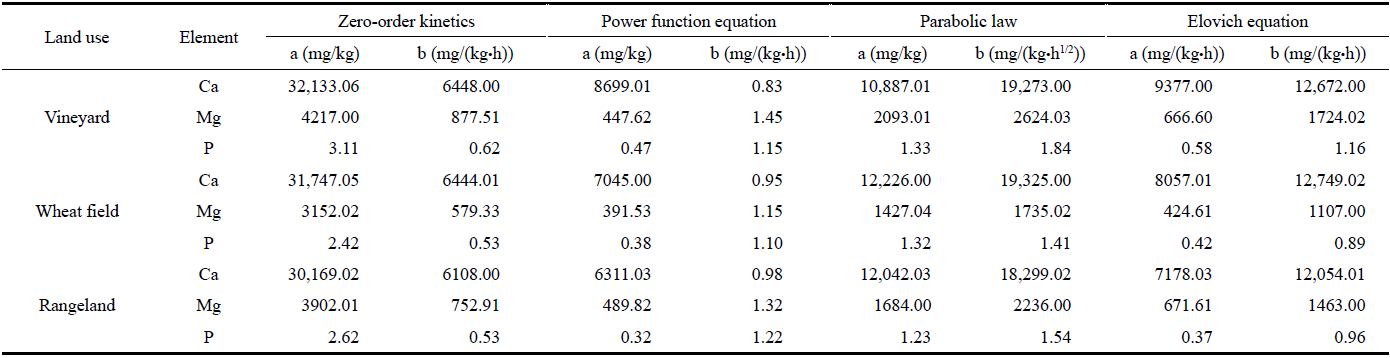 |
Note: a is the maximum release amount at initial 0.5 h; b is the release rate. |
Table 8 Semi-quantitative analysis of clay mineralogy in soil samples from different types of crop land before the wood vinegar treatment |
| Sample site | Land use | Content rank of clay mineral |
|---|---|---|
| 2 | Vineyard | Vermiculite>mixed minerals>feldspar>smectite>illite>chlorite>kaolinite>quartz |
| 5 | Wheat field | Smectite>illite>chlorite>vermiculite>mixed minerals>palygorskite>kaolinite>quartz |
| 8 | Rangeland | Illite>vermiculite>smectite>mixed minerals>palygorskite>chlorite>kaolinite>quartz |
Table 9 Semi-quantitative analysis of clay mineralogy in soil samples from different cultivation lands after wood vinegar treatment |
| Sample site | Land use | Content rank of clay mineral |
|---|---|---|
| 2 | Vineyard | Feldspar>quartz>mixed minerals>illite |
| 5 | Wheat field | Feldspar>quartz>mixed minerals |
| 8 | Rangeland | Feldspar>quartz |
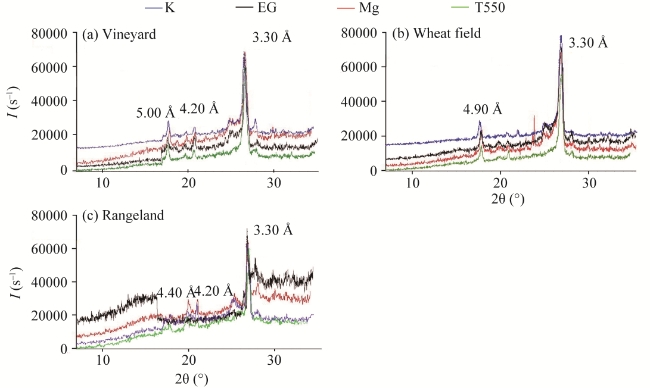
Fig. 4 X-ray diffraction graph for the soils sampled from vineyard (a), wheat field (b), and rangeland (c) after wood vinegar treatment. EG, ethylene glycol; T550, temperature at 550°C. |
| [1] |
|
| [2] |
|
| [3] |
|
| [4] |
|
| [5] |
|
| [6] |
|
| [7] |
|
| [8] |
|
| [9] |
|
| [10] |
|
| [11] |
|
| [12] |
|
| [13] |
|
| [14] |
|
| [15] |
|
| [16] |
|
| [17] |
|
| [18] |
|
| [19] |
|
| [20] |
|
| [21] |
|
| [22] |
|
| [23] |
|
| [24] |
|
| [25] |
|
| [26] |
|
| [27] |
|
| [28] |
|
| [29] |
|
| [30] |
|
| [31] |
|
| [32] |
|
| [33] |
|
| [34] |
|
| [35] |
|
| [36] |
|
| [37] |
|
| [38] |
|
| [39] |
|
| [40] |
|
| [41] |
|
| [42] |
|
| [43] |
|
| [44] |
|
| [45] |
|
| [46] |
|
| [47] |
|
| [48] |
|
| [49] |
|
| [50] |
|
| [51] |
|
| [52] |
|
/
| 〈 |
|
〉 |
