
Improving the livelihoods of local communities in degraded desert regions through afforestation with Moringa peregrina trees to combat desertification
Received date: 2024-07-21
Revised date: 2024-12-26
Accepted date: 2024-12-30
Online published: 2025-08-12
Ghasem GHOOHESTANI , Masoumeh SALEHI MOURKANI , Salman ZARE , Hamed RAFIE , Emad A FARAHAT , Farhad SARDARI , Ali ASADI . [J]. Journal of Arid Land, 2025 , 17(5) : 664 -679 . DOI: 10.1007/s40333-025-0079-6
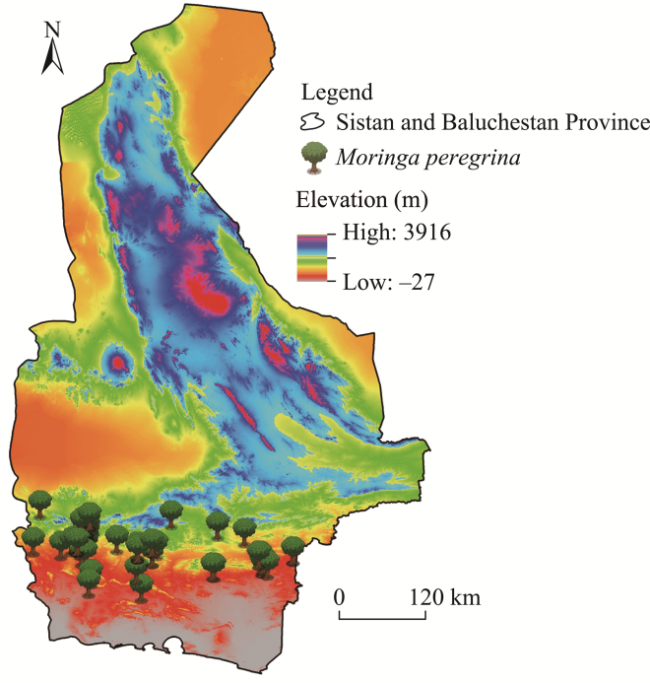
Climate change and human activities have led to desertification and decreased land productivity, significantly affecting human livelihoods in desert regions. Identifying suitable areas for cultivating economic and native plants based on ecological capacity, biological restoration, and risk management can be valuable tools for combating desertification. In this study, we identified suitable areas for the growth of economic and medicinal Moringa peregrina trees in desert regions of Sistan and Baluchestan Province, southern Iran, using library research and field methods. We also assessed the economic involvement of local communities in areas under different topographic conditions (namely flat area, undulating area, rolling area, moderately sloping area, and steep area) in the study area. Financial indicators such as the net present value (NPV), benefit-cost ratio (BCR), internal rate of return (IRR), and return on investment (ROI) were calculated for areas under various topographic conditions in the study area. The rolling area with results of NPV (6142.75 USD), IRR (103.38), BCR (5.38), and ROI (in the 3rd year) was the best region for investing and cultivating M. peregrina. The minimum economic level varied from 0.80 hm2 in the flat area to 21.60 hm2 in the steep area. Also, approximately 5,314,629.51 hm2 of desert lands in the study area were deemed suitable for M. peregrina cultivation, benefiting around 1,743,246 households in the study area. Cultivating M. peregrina in southern Iran can positively affect local communities and help preserve land from erosion. Our study will provide theoretical support for planting native species in other degraded desert regions to enhance ecosystem services and the well-being of indigenous populations.
Fig. 1 Overview of the study area and distribution of 56 occurrence points for Moringa peregrina |
Table 1 Ranges of effective parameters for natural growth of Moringa perigna |
| Parameter type | Time | Indicator | Range | Data source |
|---|---|---|---|---|
| Climate | 1999- 2019 | Maximum temperature (°C) | 30.0-35.0 (monthly average) | Presence points |
| Minimum temperature (°C) | 17.0-21.0 (monthly average) | Presence points | ||
| Precipitation (mm) | 120.0-200.0 (annual average) | Kenshloo et al. (2012); Farahat and Refaat (2021); Hegazy et al. (2008); presence points | ||
| Wind speed (m/s) | 2.5-3.5 | Presence points | ||
| Relative humidity (%) | 20.0-50.0 (monthly average) | Presence points | ||
| Evapotranspiration (mm) | 270.0-330.0 (monthly average) | Kenshloo et al. (2012); presence points | ||
| Soil | 2020 | Soil texture | loam-sand and clay-sandy loam | Presence points |
| Soil pH | 6.9-8.1 | Kenshloo et al. (2012) | ||
| Soil classification | Stony lands; Entisols and Aridisols | Presence points | ||
| Geology | 2020 | Geological formation | Eocene flysch, shale, Marl, sandstone, conglomerate, and limestone | Kenshloo et al. (2012); presence points |
| Land use | 2020 | land use type | Various land use types were recorded including lands with poor vegetation cover and no vegetation, rocky lands, and forests. | Presence points |
| Topography | 2020 | Elevation (m) | 200-800 | Kenshloo et al. (2012); Farahat and Refaat (2021); presence points |
| Aspect | Mostly in the southern direction | Presence points | ||
| Slope (%) | 0.0-30.0 | Presence points |
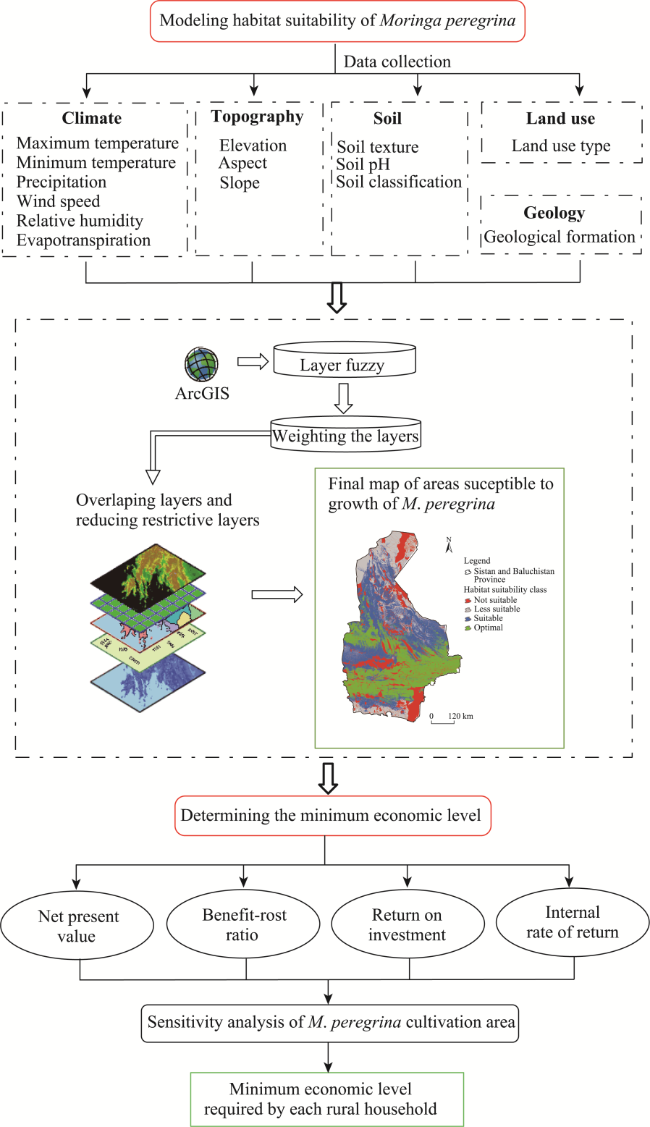
Fig. 2 Flow chart of the study |
Table 2 Weights of criteria used to identify suitable areas for the cultivation of M. peregrina |
| Layer type | Layer | Amount of information | Final weight |
|---|---|---|---|
| Aspect | 4.70 | 0.07 | |
| Topography | Height | 6.47 | 0.10 |
| Slope | 4.38 | 0.06 | |
| Climate | Evapotranspiration | 6.64 | 0.10 |
| Wind speed | 5.72 | 0.08 | |
| Precipitation | 5.09 | 0.08 | |
| Maximum temperature | 4.96 | 0.07 | |
| Minimum temperature | 5.20 | 0.08 | |
| Relative humidity | 4.66 | 0.07 | |
| Geology | Geological formation | 3.75 | 0.06 |
| Land use | Land use type | 3.44 | 0.05 |
| Soil texture | 4.26 | 0.06 | |
| Soil | Soil classification | 4.25 | 0.06 |
| Soil pH | 3.98 | 0.06 |
Table 3 Definitions and area proportions of different topographic conditions in the study area |
| Topographic condition | Definition | Area proportion (%) |
|---|---|---|
| Flat area | Area with slope of 0%-2% | 33 |
| Undulating area | Area with slope of 2%-8% | 36 |
| Rolling area | Area with slope of 8%-15% | 14 |
| Moderately sloping area | Area with slope of 15%-30% | 11 |
| Steep area | Area with slope of 30%-60% | 6 |
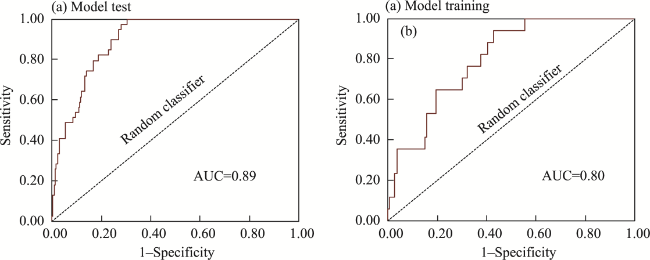
Fig. 3 Receiver operating characteristics (ROC) curves based on model test points (a) and model training points (b) for M. peregrina. AUC, area under the curve. The red curve represents the mean response. |
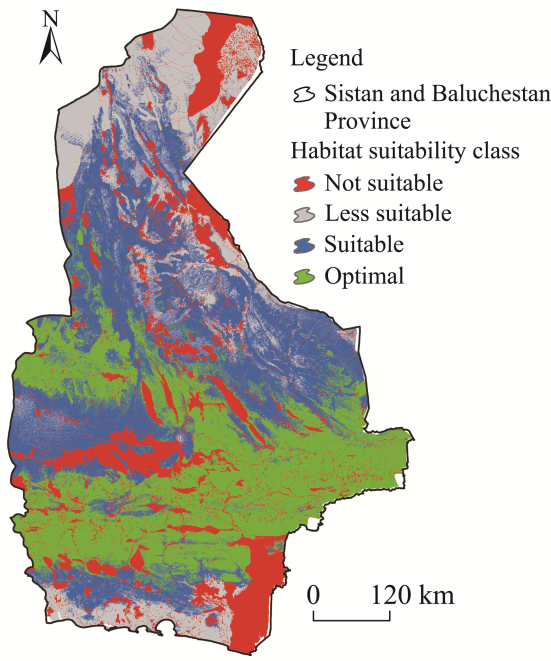
Fig. 4 Spatial distribution of four classes of suitable areas for M. peregrina growth |
Table 4 Assumptions and benefits of the M. peregrina cultivation project for areas under different topographic conditions in the study area |
| Topographic condition | Projected economic area (hm2) | Benefits of the project | ||||
|---|---|---|---|---|---|---|
| Time | Product performance (kg/hm2) | Income )USD( | Cost )USD) | Benefit )USD) | ||
| Flat area | 2.00 | 1st year | - | 0.00 | 1797.00 | -1797.00 |
| 2nd year | - | 0.00 | 760.89 | -760.89 | ||
| 3rd year | 652.50 | 2584.16 | 622.05 | 1962.10 | ||
| 4th year onwards | 652.50 | 2584.16 | 604.46 | 1979.88 | ||
| Undulating area | 5.40 | 1st year | - | 0.00 | 1909.87 | -1909.87 |
| 2nd year | - | 0.00 | 974.69 | -974.69 | ||
| 3rd year | 240.00 | 2566.33 | 752.80 | 1813.52 | ||
| 4th year onwards | 240.00 | 2566.33 | 731.41 | 1834.92 | ||
| Rolling area | 11.20 | 1st year | - | 0.00 | 997.75 | -997.75 |
| 2nd year | - | 0.00 | 203.65 | -203.65 | ||
| 3rd year | 116.25 | 2578.21 | 282.10 | 2296.11 | ||
| 4th year onwards | 116.25 | 2578.21 | 257.54 | 2320.67 | ||
| Moderately sloping area | 27.70 | 1st year | - | 0.00 | 1655.81 | 1655.81 |
| 2nd year | - | 0.00 | 330.99 | -330.99 | ||
| 3rd year | 46.78 | 2566.33 | 406.67 | 2159.66 | ||
| Fourth year onwards | 46.78 | 2566.33 | 372.44 | 2193.89 | ||
| Steep area | 54.00 | 1st year | - | 0.00 | 1900.00 | -1900.00 |
| 2nd year | - | 0.00 | 490.51 | -490.51 | ||
| 3rd year | 24.00 | 2566.33 | 522.21 | 2044.12 | ||
| 4th year onwards | 24.00 | 2566.33 | 479.40 | 2086.91 | ||
Note: "-" indicates no data. |
Table 5 Calculation of financial evaluation indicators for areas under different topographic conditions in the study area |
| Topographic condition | NPV (USD) | IRR | BCR | ROI |
|---|---|---|---|---|
| Flat area | 3826.74 | 55.50 | 2.43 | In the 5th year |
| Undulating area | 3083.80 | 48.05 | 2.05 | In the 5th year |
| Rolling area | 6142.75 | 103.38 | 5.38 | In the 3rd year |
| Moderately sloping area | 4976.75 | 69.48 | 3.47 | In the 4th year |
| Steep area | 4261.24 | 58.96 | 2.79 | In the 4th year |
Note: NPV, net present value; IRR, internal rate of return; BCR, benefit-cost ratio; ROI, return on investment. |
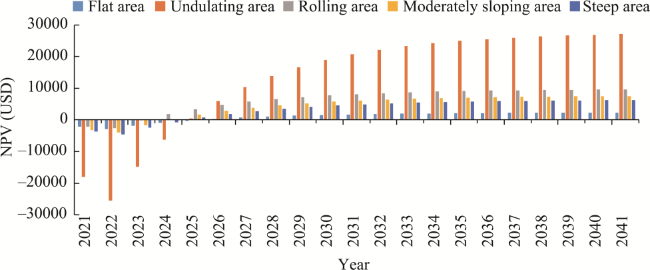
Fig. 5 Annual changes of net present value (NPV) from the M. peregrina cultivation project from 2021 to 2041 in areas under different topographic conditions |
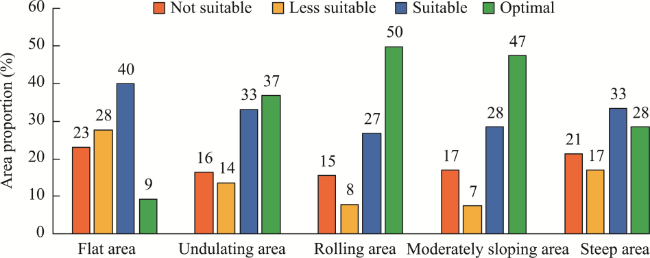
Fig. 6 Area proportions of four habitat suitability classes in areas under different topographic conditions |
Table 6 Benefits of M. peregrina cultivation in areas under different topographic conditions |
| Number of households | Minimum economic level (hm2) | Area proportion of land susceptible to priority cultivation (%) | Area of land susceptible to priority cultivation (hm2) | Topographic condition |
|---|---|---|---|---|
| 66,160 | 0.80 | 10 | 535,328.19 | Flat area |
| 712,021 | 3.24 | 43 | 2,306,948.04 | Undulating area |
| 265,837 | 4.48 | 22 | 1,190,950.29 | Rolling area |
| 81,339 | 11.08 | 18 | 959,801.40 | Moderately sloping area |
| 14,888 | 21.60 | 6 | 321,601.59 | Steep area |
| 1,743,246 | - | 100 | 5,314,629.51 | Total |
Note: "-" means no data. |
| [1] |
|
| [2] |
|
| [3] |
|
| [4] |
|
| [5] |
|
| [6] |
|
| [7] |
|
| [8] |
|
| [9] |
|
| [10] |
|
| [11] |
|
| [12] |
|
| [13] |
|
| [14] |
|
| [15] |
|
| [16] |
|
| [17] |
|
| [18] |
|
| [19] |
|
| [20] |
|
| [21] |
|
| [22] |
|
| [23] |
|
| [24] |
|
| [25] |
|
| [26] |
|
| [27] |
|
| [28] |
|
| [29] |
|
| [30] |
|
| [31] |
|
| [32] |
Millennium Ecosystem Assessment. 2005. Ecosystems & Human Well-being: Desertification Synthesis. Washington, DC: World Resources Institute, 26.
|
| [33] |
|
| [34] |
|
| [35] |
|
| [36] |
National Meteorological Organization. 2019. Long meteorological statistics of Sistan and Baluchistan province. [2024-06-10]. https://data.irimo.ir.
|
| [37] |
National Portal of Statistics. 2016. Population statistics of the country. [2024-06-10]. https://www.amar.org.ir.
|
| [38] |
|
| [39] |
|
| [40] |
|
| [41] |
|
| [42] |
|
| [43] |
|
| [44] |
|
| [45] |
|
| [46] |
|
| [47] |
|
/
| 〈 |
|
〉 |