• Mashael MAASHI 1 ,
  • Nada ALZABEN 2 ,
  • Noha NEGM , 3, * ,
  • Venkatesan VEERAMANI 4 ,
  • Sabarunisha Sheik BEGUM 5 ,
  • Geetha PALANIAPPAN 6
展开

收稿日期: 2024-09-04

  修回日期: 2025-02-16

  录用日期: 2025-03-10

  网络出版日期: 2025-08-12

Forecasting land use changes in crop classification and drought using remote sensing

  • Mashael MAASHI 1 ,
  • Nada ALZABEN 2 ,
  • Noha NEGM , 3, * ,
  • Venkatesan VEERAMANI 4 ,
  • Sabarunisha Sheik BEGUM 5 ,
  • Geetha PALANIAPPAN 6
Expand
  • 1Department of Software Engineering, College of Computer and Information Sciences, King Saud University, Riyadh 11451, Saudi Arabia
  • 2Department of Computer Sciences, College of Computer and Information Sciences, Princess Nourah bint Abdulrahman University, Riyadh 11671, Saudi Arabia
  • 3Department of Computer Science, Applied College at Mahayil, King Khalid University, Abha 61421, Saudi Arabia
  • 4Department of Civil Engineering, University College of Engineering, Anna University, Ariyalur 621731, India
  • 5Department of Biotechnology, P.S.R. Engineering College, Sivakasi 626140, India
  • 6Department of Electronics and Communication Engineering, School of Engineering and Technology, Dhanalakshmi Srinivasan University, Samayapuram 621112, India
*Noha NEGM (E-mail: )

Received date: 2024-09-04

  Revised date: 2025-02-16

  Accepted date: 2025-03-10

  Online published: 2025-08-12

本文引用格式

Mashael MAASHI , Nada ALZABEN , Noha NEGM , Venkatesan VEERAMANI , Sabarunisha Sheik BEGUM , Geetha PALANIAPPAN . [J]. Journal of Arid Land, 2025 , 17(5) : 575 -589 . DOI: 10.1007/s40333-025-0013-y

Abstract

Challenges in land use and land cover (LULC) include rapid urbanization encroaching on agricultural land, leading to fragmentation and loss of natural habitats. However, the effects of urbanization on LULC of different crop types are less concerned. The study assessed the impacts of LULC changes on agriculture and drought vulnerability in the Aguascalientes region, Mexico, from 1994 to 2024, and predicted the LULC in 2034 using remote sensing data, with the goals of sustainable land management and climate resilience strategies. Despite increasing urbanization and drought, the integration of satellite imagery and machine learning models in LULC analysis has been underutilized in this region. Using Landsat imagery, we assessed crop attributes through indices such as normalized difference vegetation index (NDVI), normalized difference water index (NDWI), normalized difference moisture index (NDMI), and vegetation condition index (VCI), alongside watershed delineation and spectral features. The random forest model was applied to classify LULC, providing insights into both historical and future trends. Results indicated a significant decline in vegetation cover (109.13 km2) from 1994 to 2024, accompanied by an increase in built-up land (75.11 km2) and bare land (67.13 km2). Projections suggested a further decline in vegetation cover (41.51 km2) and continued urban land expansion by 2034. The study found that paddy crops exhibited the highest values, while common bean and maize performed poorly. Drought analysis revealed that mildly dry areas in 2004 became severely dry in 2024, highlighting the increasing vulnerability of agriculture to climate change. The study concludes that sustainable land management, improved water resource practices, and advanced monitoring techniques are essential to mitigate the adverse effects of LULC changes on agricultural productivity and drought resilience in the area. These findings contribute to the understanding of how remote sensing can be effectively used for long-term agricultural planning and environmental sustainability.

1 Introduction

The distribution and accessibility of cropland can be greatly impacted by changes in land use and land cover (LULC), especially the conversion of agricultural land to urban land (Johnson et al., 2005). One consequence is the loss of productive agricultural land, which may lower food production capacity and possibly increase reliance on imported food (Guha et al., 2020). This consequence may affect a nation or region's economy and security (Foody, 2002). The modification of local and regional climate conditions as a result of variations in the land surface characteristics is another effect (Kanga et al., 2022). Urbanization may result in the development of urban heat islands, which may have an impact on a region's suitability for growing particular crops (van Vliet, 2019). LULC change may also have an indirect effect on cropland distribution through altering the quantity and quality of available water resources. The ability of a region to absorb and hold water can be weakened by the loss of natural land cover, such as wetlands and areas with dense vegetation (Palaniappan, 2004). This can cause fluctuations in the amount of water available for irrigation (Middleton, 2002). Sustainable agriculture and food security depend on the understanding and consideration for the effects of changing land cover on cropland distribution (Juez et al., 2019).
LULC changes in crop classification refer to alterations in agricultural land patterns over time, such as shifts in crop types grown in specific regions (Kumar et al., 2014). These changes can result from factors like climate variability, market demand, technological advancement, and land management practice, influencing agricultural landscape and ecosystem (Meyer and Turner, 1994). Drought analysis often reveals significant LULC changes, notably in crop classification (McNeill et al., 1994; Mishra and Rai., 2016). The generalized regression neural network (GRNN)-based precipitation product with global and local optimization strategies improves accuracy in estimating precipitation in various environments, outperforming global products under various climatic conditions (Mohammadpouri et al., 2023). Remote sensing techniques aid in monitoring these changes, detecting alterations in crop types and identifying areas of stress (Nath et al., 2020). Crop classification algorithms analyze spectral signatures to distinguish different crop types, providing insights into drought impacts on agricultural landscapes (Omar et al., 2014; Wubie et al., 2016). Assessing LULC changes and crop classifications, researchers and policymakers can better understand the extent of drought effects, facilitating targeted mitigation strategies and resource allocation to support affected regions (Ruben et al., 2020).
A dry and bare surface increases the intensity of land surface temperature (LST), making it useful for land use planners to analyze long-term monthly data (Guha et al., 2023). Green vegetation and water body resist the increases in LST, while bare rock surface and built-up land accelerate it, with the study aiding town and country planners to estimate land conversion in the future (Guha and Govil, 2021). The analysis of LST in densely populated areas reveals that urban morphology, vegetation cover, and spectral indices are critical factors influencing temperature variation. Higher building densities and industrial areas tend to increase LST, while vegetation and green spaces mitigate it. Spectral indices like normalized difference vegetation index (NDVI) and normalized difference build-up index (NDBI) are valuable tools for understanding these dynamics. Local climate and urban functional regions offer a structured approach to study LST, highlighting the importance of tailored urban planning strategies to manage urban heat islands effectively (Ghanbari et al., 2023). The stability of the relationship between LST and LULC is influenced by various factors, including the extent of urbanization, the presence of green space, and seasonal variation. The findings from previous studies highlight the importance of urban planning and green surface management in mitigating the adverse thermal effects of urbanization (Guha and Govil, 2023).
Remote sensing techniques have revolutionized the prediction and analysis of drought, crop classification, and LULC changes (AlDousari et al., 2022). Advanced satellite imagery and sensors capture crucial data on vegetation health, soil moisture, and temperature variation, enable early detection and monitor drought condition (Yang et al., 2014; Hanadé Houmma et al., 2022). Machine learning algorithms, coupled with remote sensing data, facilitate accurate crop classification by analyzing spectral signatures and spatial patterns, and enhancing agricultural management and food security (Taiwo et al., 2023). Additionally, remote sensing plays a pivotal role in predicting LULC changes and monitoring urban expansion, deforestation, and agricultural intensification (Hossain et al., 2019). Integration of multi-temporal and multi-sensor data enhances predictive model, enabling the anticipation of future changes in land use patterns due to factors such as climate change and human activities (Anderson, 1976). These advancements empower policymakers and stakeholders to implement proactive measures for sustainable land management, climate adaptation, and disaster mitigation in vulnerable regions, ultimately fostering resilience in agricultural and environmental systems (Thanh Noi and Kappas, 2017).
In the Aguascalientes region, central Mexico, challenges in LULC include rapid urbanization encroaching on agricultural land, leading to fragmentation and loss of natural habitats (Merlín-Uribe et al., 2013; Mitchell et al., 2015; Zambrano et al., 2019). Drought analysis reveals heightened vulnerability of crops like maize and wheat to water scarcity, exacerbated by climate change (Egger et al., 2015; Hussain et al., 2022b). Rural-urban migration and climate change are key drivers in the conversion of cropland to woodland in Mexico (Bonilla-Moheno and Aide, 2020; Manjarrez-Domínguez et al., 2023). Addressing these issues necessitates integrated approaches, including sustainable urban planning to preserve agricultural land, advanced remote sensing techniques for accurate crop monitoring, and improved water management strategies to enhance drought resilience in the region. This study aims to assess the LULC changes, predict the LULC in 2034, and evaluate crop classification and drought severity in the Aguascalientes region from 1994 to 2024. To maintain sustainable land resource management, policymakers and land managers must take into account how LULC changes will affect agriculture and take measures for tracking crop productivity.

2 Study area

The study area lies in 21°36′-22°05′N and 102°06′-102°23′W with an area of 1677.69 km2. In the Aguascalientes region, located in central Mexico, agriculture is a significant economic driver, with crops like corn, wheat, and bean prominent in its diverse agricultural landscape. Its semi-arid climate poses challenges, with periodic droughts affecting crop yields and water resources. Remote sensing technologies aid in monitoring vegetation health and soil moisture levels, which is crucial for mitigating drought impacts and optimizing irrigation strategies. Rapid urbanization and industrial growth in the Aguascalientes region also influence land use patterns, leading to LULC changes. Sustainable land management practices and efficient water resource management are essential for enhancing resilience in agriculture and addressing the environmental challenges in the Aguascalientes region.
The geological composition of the Aguascalientes region is primarily characterized by sedimentary rocks, including limestone, shale, and sandstone, with volcanic activity contributing to its diverse landscapes. In the Aguascalientes region, LULC changes exert significant effects, particularly concerning agricultural productivity and water resources. Drought analysis is crucial for understanding these impacts, as it influences crop classification and management strategies. During drought periods, changes in LULC may include reduced vegetation cover and shifts in land management practices. Remote sensing techniques aid in monitoring these changes and facilitating the classification of crops under stress conditions. By analyzing spectral signatures and spatial patterns, researchers can assess the extent of drought-induced alterations in crop types, enabling informed decision-making for sustainable agricultural practices and water resource management in the Aguascalientes region.

3 Materials and methods

LULC types in 1994, 2004, 2014, and 2024 were evaluated and predicted using Landsat thematic mapper (TM) and operational land imager (OLI) images (Hussain et al., 2022b). Each year represents a shift in time period of 10 a (total 40 a). The random forest (RF) model was applied to analyze the Landsat data using machine learning techniques. To prevent seasonal variations and reduce the effects of cloud cover, we obtained data during the summer (dry season) (Altaf et al., 2013). To accomplish the goals of the study, we used all satellite data with less than 5.00% cloud cover (Hussain et al., 2022a). The digital elevation model (DEM) from the shuttle radar topography mission (SRTM) has been utilized to evaluate the research area's elevation (Dwivedi et al., 2005). SRTM data with 30 m spatial resolution are provided in Table 1. Methodology flow for this study is shown in the Figure 1. The specific scene used in this study corresponds to Path 029 and Row 045.
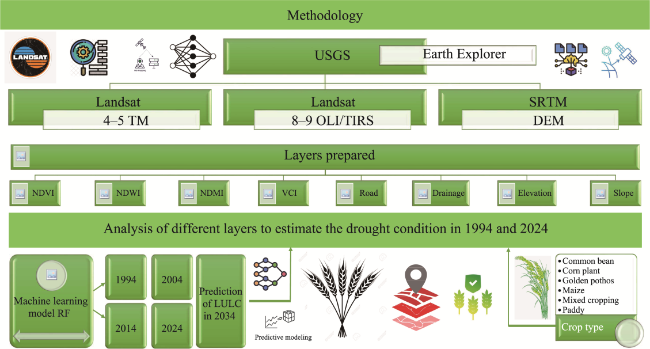
Fig. 1 Flowchart of method in this study. USGS, U.S. Geological Survey; TM, thematic mapper; OLI/TIRS, operational land imager/thermal infrared sensor; SRTM, shuttle radar topography mission; DEM, digital elevation model; NDVI, normalized difference vegetation index; NDWI, normalized difference water index; NDMI, normalized difference moisture index; VCI, vegetation condition index; RF, random forest; LULC, land use and land change. The abbreviations are the same in the following figures.
Table 1 Data used in this study
Data Source Date (yyyy-mm-dd) Resolution (m) Projection
Landsat 4 TM USGS Earth Explorer 1994-06-02 30.0 UTM 13N
Landsat 4 TM USGS Earth Explorer 2004-05-12 30.0 UTM 13N
Landsat 8 OLI/TIRS USGS Earth Explorer 2024-02-23 30.0 UTM 13N
Landsat 8 OLI/TIRS USGS Earth Explorer 2014-01-16 30.0 UTM 13N
SRTM DEM Data USGS Earth Explorer 2000-02-11 30.0 UTM 13N
Road data Google Earth Pro 2024-02-25 2.5 UTM 13N

Note: TM, thematic mapper; OLI/TIRS, operational land imager/thermal infrared sensor; SRTM, shuttle radar topography mission; DEM, digital elevation model; USGS, U.S. Geological Survey; UTM, Universal Transverse Mercator. The abbreviations are the same in the following tables.

3.1 Machine learning method

RF is a powerful machine learning method renowned for its versatility and effectiveness in various fields, including classification, regression, and anomaly detection (Kafy et al., 2021). RF operates by constructing a multitude of decision trees during training (Nath et al., 2020). Each tree is built using a random subset of the training data and a random subset of features (Ruben et al., 2020). This randomness helps to decorrelate the individual tree and reduce overfitting, leading to robust generalization performance (Kumar et al., 2014). During prediction, RF aggregates the outputs of all individual tree to make a final prediction. This aggregation, often through a majority voting scheme for classification tasks or averaging for regression tasks, yields a robust and accurate overall prediction.
RF offers several advantages over other machine learning techniques. It requires minimal hyper-parameter tuning and is less sensitive to overfitting, due to its inherent randomization. Additionally, RF can handle both numerical and categorical features without requiring feature scaling. Its ability to provide estimates of feature importance is valuable for understanding the underlying data relationship. Its adaptability, robustness, and ability to handle complex datasets make it a popular choice for tackling diverse machine learning tasks. RF was calculated by the following equation:
m = 1 2 i = 1 n a i b i 2 ,
where m is the computed error metric, often used to evaluate the performance of the RF model; i is the specific data instance within the dataset; n is the total number of data points in the dataset; ai is the predicted output from the RF model for the ith data point; and bi is the actual or observed response value for the ith data point.
We used Equation 2 for machine learning and statistical analysis for distance-based classification, particularly in quadratic discriminant analysis (QDA) and anomaly detection. It accounts for feature correlations by incorporating the inverse of the covariance matrix, making it more robust than Euclidean distance.
D 2 k =   X i X - k T S k 1 X i X - k ,
where D2k is the squared Mahalanobis distance; Xi is the feature vector of the ith data point in the dataset; X - k is the mean feature vector of class k; and Sk is the covariance matrix of class k.

3.2 Prediction of LULC in 2034

The future LULC scenario in the study area in 2034 was predicted using the land change modeller (LCM) in TerrSet v.20.0 software. The process of predicting LULC in LCM involves multiple stages, such as gathering and preprocessing data, determining the factors that influence land cover change, choosing and training the model, generating a prediction, and validating the prediction (Ruben et al., 2020). After getting satellite imagery, we included DEM and other data sources that will be utilized to create the prediction in the acquisition and preprocessing the data. To guarantee that the data are in the right format and resolution for the analysis, preprocessing is necessary (Hussain et al., 2020a). A number of variables, including population growth, distance from residential and commercial districts, elevation, closeness to a road, slope, and drainage pattern proximity, might influence the change in land cover (Nath et al., 2020).
It is crucial to identify the primary drivers of land cover change in the study area to comprehend its future trends. We selected elevation, road proximity, slope, and drainage pattern closeness as driving factors based on the aims and characteristics of the study area (Mishra and Rai, 2016). Land cover changes can be predicted using a variety of models, such as neural networks, logistic regression, and cellular automata (CA). The CA method was used for this investigation in accordance with the features and data accessibility of the study area (Ruben et al., 2020). The model should be trained using historical data on land cover change in the study area after proper model has been selected. To do this, we usually split the data into training and testing sets, then adjusted the model parameters until the model is able to predict changes in land cover in the testing set with accuracy (Kumar et al., 2014). After training, the model may be used to forecast changes in the future land cover. This process usually entails executing the model several times under various conditions and presumptions on the factors influencing changes in land cover (Ruben et al., 2020). In remote sensing, when many techniques or sensors were employed to classify LULC, Kappa statistics (KS) is frequently utilized to evaluate classification accuracy (Taiwo et al., 2023). By dividing the number of times, we found that two classes agree by the number of times they disagree. KS is computed and expressed as a ratio (Ruben et al., 2020). This metric is widely used as it considers the probability of agreement occurring by chance. The formula below is used to determine KS:
KS = ( P 0 P e ) 1 P e ,
where P0 is the observed proportion of agreement between the two classes; and Pe is the predicted proportion of agreement based on chance (Taiwo et al., 2023). There is strong agreement between the two classes when the value of KS is near to 1, and low agreement when it is close to 0 (Ruben et al., 2020). A negative KS value suggests the poor agreement between the two classes (Taiwo et al., 2023).

3.3 Estimation and calculation of NDVI, NDWI, NDMI, and vegetation condition index (VCI)

3.3.1 NDVI

NDVI is commonly used for monitoring and evaluating the condition of vegetation on the surface of the Earth, the following equation is used to calculate it:
NDVI = NIR RED NIR + RED ,
where RED is the vegetation's red reflectance; and NIR is the near-infrared reflectance (Taiwo et al., 2023). NDVI values typically range from -1.00 to 1.00, with values close to 1.00 indicating dense and healthy vegetation, and values near -1.00 indicating bare land or low vegetation. NDVI is particularly useful for tracking vegetation productivity and growth, as it is sensitive to chlorophyll levels and is commonly applied to monitor the condition of grassland, forest, and agricultural land through satellite or aerial imagery (Ruben et al., 2020).

3.3.2 NDWI

NDWI is a spectral index used to measure vegetation water content. It assists in assessing crop stress by detecting changes in water levels within plant canopies, making it valuable for monitoring plant health and hydration levels in agricultural and environmental studies. NDWI can be effectively used to assess crop stress by monitoring plant water content. This index is calculated using the following equation:
NDWI = Green band NIR   Green band + NIR ,
where green band is the green spectral band of a satellite picture. Higher values indicate increased water content in the plant. NDWI readings often range from -1.00 to 1.00 (Taiwo et al., 2023). When the NIR band reflects more radiation than the green band, as it does in places with exposed soil or water body, negative values may occur (Ruben et al., 2020). Low NDWI readings in a crop stress assessment might mean that the crops are under water stress, which could hinder their development and output (Taiwo et al., 2023). Monitoring NDWI over time can provide information on irrigation and water management techniques in the areas and assist in identifying crops that are under water stress.

3.3.3 NDMI

NDMI is a remote sensing index that's used to determine the plant moisture (Taiwo et al., 2023). Since plant tissues are sensitive to water, the reflectance values at NIR and mid-infrared (MIR) wavelengths are used to calculate it. The equation below is used to compute it.
NDMI = NIR MIR / ( NIR + MIR ) .
NDMI has values between -1.00 and 1.00, where a negative number denotes dry circumstances and a positive value indicates moist conditions. Intermediate moisture levels are indicated by NDMI readings that are close to 0.00. NDMI is frequently used to evaluate the general health and productivity of plants, as well as to monitor crop moisture stress. It may be used to locate drought-prone regions and track variations in the moisture content of plants over time (Taiwo et al., 2023). In order to more precisely analyze crop conditions, researchers frequently combined NDMI with other remote sensing indices, such as NDVI.

3.3.4 VCI

VCI is an indicator of agricultural drought that may be used to track the wellbeing and state of crops over time (Ruben et al., 2020). It may be applied to evaluate the effects on crops of insect infestation, drought, and other stresses. NDVI data are used to compute VCI. The equation for the VCI is as follows:
VCI = NDVI NDVI min / NDVI max + NDVI min ,
where NDVImin and NDVImax are the minimum and maximum NDVI values for a specific period, respectively. VCI value can vary from 0.00 to 100.00. Higher values of VCI indicate healthier and less stressed vegetation, whereas lower values indicate less healthy and more stressed vegetation. VCI can track the health of crops over time and pinpoint regions that could be under stress from a drought or other issues (Taiwo et al., 2023). Additionally, it can support farmers and agricultural managers in making well-informed choices on other management techniques, such as irrigation.

3.4 Watershed delineation by using SRTM DEM

The process of locating and defining a watershed's borders is known as ''watershed delineation''. A watershed is a region that empties all of its water, sediment, and dissolved elements into a single outlet, such as a lake, stream, or river (Ruben et al., 2020). This procedure is crucial for crop monitoring and evaluation since it aids in comprehending the hydrological features and processes of the region and can yield insightful data for planning and managing water resources (Ruben et al., 2020). Watershed delineation is usually done using a DEM since it correctly depicts the terrain of the region (Taiwo et al., 2023). DEM can be acquired from a number of sources, including aerial photography, liDAR (light detection and ranging), and satellite imaging. After obtaining the DEM, specialized software like ArcGIS may be used to establish the watershed borders.
Finding the watershed's outflow or ''pour point'' where the water leaves the watershed and enters a body of water downstream, is the first stage in delineating a watershed. This ''flow accumulation'' mechanism aids in determining the borders of the watershed. Since it can help to understand the hydrological processes and features of the region, such as the availability of water resources and the risk for erosion or floods, watershed delineation can offer useful information for crop monitoring and evaluation (Taiwo et al., 2023). Additionally, it may be used to locate possible sources of contamination and assist in determining whether locations are appropriate for irrigation or other farming techniques that rely on water.

3.5 Analysis of leaf spectral reflectance

In this study, crop types including common bean, corn, golden pothos, maize, mixed cropping, and paddy were measured for spectrum reflectance using the analytical spectrum devices (ASD) (FieldSpec FR Pro 2500 spectroradiometer, ASD Inc., Boulder, USA) (Taiwo et al., 2023). With a spectral resolution of 1 nm, its spectral range is 325-1075 nm. Using this instrument to investigate the spectral characteristics of grass has revealed that the canopy spectra of the plant contain two peaks, located approximately at 700 and 720 nm. The natural fluorescence emission at 690 and 730 nm is responsible for these peaks. Applications involving the measurement of spectrum reflectance, such as remote sensing and plant physiology research, benefit from the use of the FieldSpec FR spectroradiometer. It may be used to track crop health, evaluate plant stress, and investigate how environmental conditions affect plant growth and development (Ruben et al., 2020).

4 Results

Figure 2 shows the map of elevation, slope, and proximity to road and to drainage for the Aguascalientes region. In the study area, elevation ranged from 1754 to 2397 m, which belonged to high elevation zone). The slope of the study area included gentle, very gentle, and moderate slope. Some regions had steep and very steep slopes. Most areas of proximity to roads in the Aguascalientes region was predominantly classified as very high and high zones, while only a small area of proximity to roads was categorized as low and very low zones. Proximity to drainage was classified as very high zone in the central and southern region. Border zones was classified as very low and low zones.
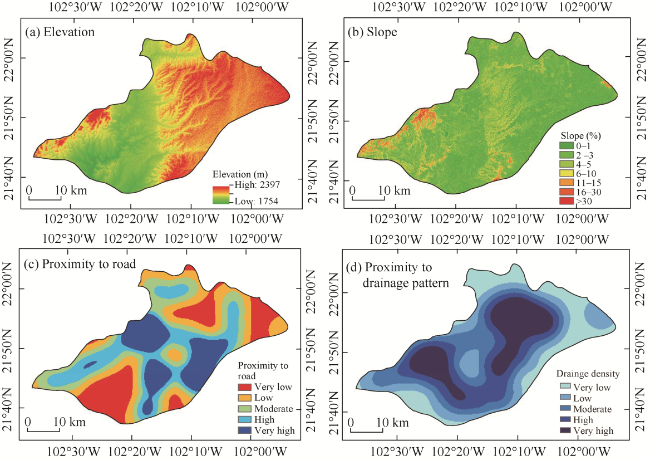
Fig. 2 Elevation (a), slope (b), proximity to road (c), and proximity to drainage (d) in the Aguascalientes region, central Mexico
Figure 3 shows the result of NDVI, NDWI, and NDMI indices. NDVI in the Aguascalientes region ranged from -0.25 to 0.63. Overall, the study showed moderate and low vegetation index values, possibly due to data collected during dry seasons. NDWI ranged from -0.29 to 0.57, indicating water content in the region and helps in identifying paddy fields with higher moisture levels. NDMI showed a range from -0.47 to 0.35. This index effectively identifies agricultural zones compared with other land cover types, as vegetation typically contains higher soil moisture content. Figure 4 shows spatiotemporal changes in vegetation cover using NDVI and VCI in 1994 and 2024. VCI values in 1994 ranged from 0.00 to 78.20, while VCI values in 2024 ranged from 0.00 to 96.30, which was significantly higher than those of 1994.
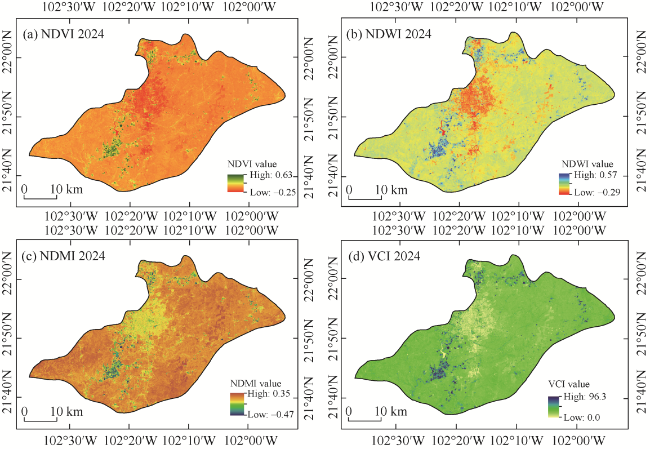
Fig. 3 Spatiotemporal changes of NDVI (a), NDWI (b), NDMI (c), and VCI (d) in 2024 in the Aguascalientes region, central Mexico
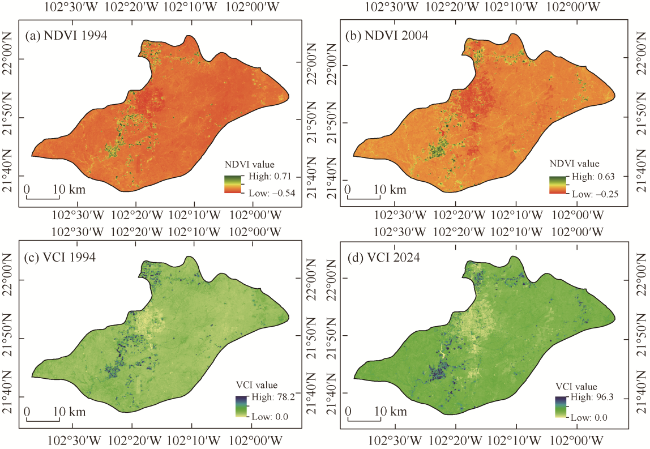
Fig. 4 Spatiotemporal changes of NDVI (a and b) and VCI (c and d) in 1994 and 2024 in the Aguascalientes region, central Mexico
Using the RF model, the spatiotemporal changes in LULC from 1994 to 2024 were classified and the map in 1994, 2004, 2014, and 2024 is shown in Figure 5. Agricultural land and grassland were the major LULC types that decreased from 1994 to 2024, while built-up land and barren land increased dramatically. Similar results about the area of LU LC change from 1994 to 2024 are shown in Table 2.
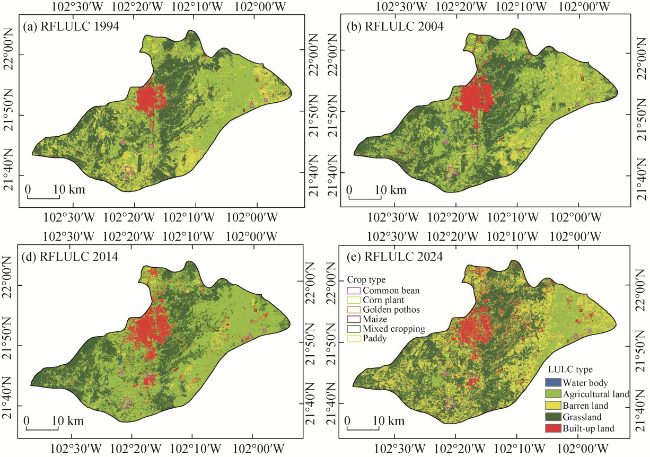
Fig. 5 Random forest (RF) model result based on LULC classification in 1994 (a), 2004 (b), 2014 (c) and 2024 (d) in the Aguascalientes region, central Mexico
Table 2 Land use and land cover (LULC) changes from 1994 to 2024 in the Aguascalientes region, central Mexico
LULC 1994 2004 2014 2024 Trend from 2024 to 1994
(km2)
Water body 3.12 2.96 2.45 2.23 -0.89
Agricultural land 808.78 796.25 758.45 699.65 -109.13
Barren land 306.99 325.14 365.45 374.15 67.16
Grassland 415.10 370.76 349.47 380.818 -34.28
Built-up land 145.74 182.58 201.87 220.85 75.11
Prediction of LULC in 2034 in the Aguascalientes region is shown in Figure 6 and the area estimate in 2034 is shown in Table 3. Overall, an area of 41.51 km2 of agricultural land would decrease, with areas of 16.09 and 16.04 km2 increases in built-up land and barren land, respectively. Agricultural land area would reach 658.14 km2 in 2034. The areas for each crop type, based on a total of 658.14 km2 of agricultural land, would be as follows: 120.35 km2 of common bean, 150.72 km2 of corn, 85.43 km2 of golden pothos, 145.67 km2 of maize, 88.98 km2 of mixed cropping, and 67.99 km2 of paddy (Table 3).
Fig. 6 Spatial distribution of predicted LULC in 2034 in the Aguascalientes region, central Mexico
Table 3 Area changes of predicted LULC from 2024 to 2034 in the Aguascalientes region, central Mexico
LULC 2024 2034 Trend from 2034 to 2024
(km2)
Water body 2.23 1.63 -0.60
Agricultural land 699.65 658.14 -41.51
Barren land 374.15 390.19 16.04
Grassland 380.82 390.80 9.98
Built-up land 220.85 236.94 16.09
Table 4 shows the areas and mean NDVI, NDWI, and NDMI) for five crop types in the Aguascalientes region. Corn plant covered the largest area (150.72 km2) with moderate NDVI (0.42), NDWI (0.27), and NDMI (0.29), reflecting its balanced vegetation and moisture conditions. Mixed cropping showed the highest NDVI (0.49), indicating denser vegetation, while paddy, despite being omitted in this table, was typically associated with higher NDWI value. Golden pothos and maize exhibited similar moisture levels, with mean NDMI values of 0.34 and 0.33, respectively. Common bean, covering 120.35 km2, demonstrated moderate vegetation and moisture indicators, suggesting its reliance on controlled water availability.
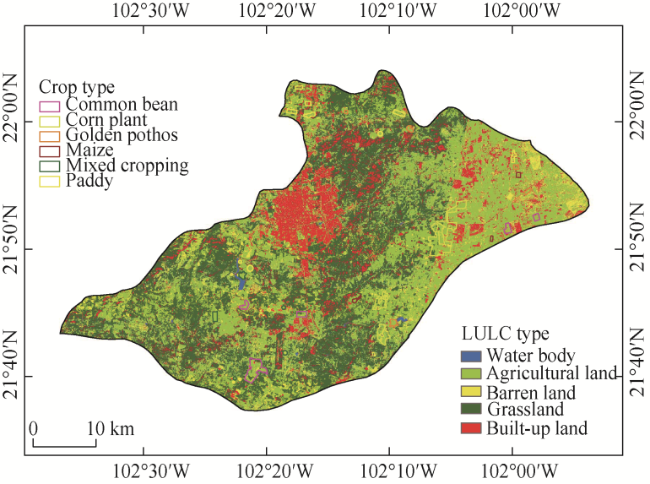
Table 4 Crop types, areas, and normalized difference indices in the Aguascalientes region, central Mexico
Crop type Area (km2) Mean NDVI Mean NDWI Mean NDMI
Common bean 120.35 0.35 0.26 0.37
Corn plant 150.72 0.42 0.27 0.29
Golden pothos 85.43 0.36 0.32 0.34
Maize 145.67 0.39 0.35 0.33
Mixed cropping 88.98 0.49 0.37 0.36
Paddy 67.99 0.52 0.45 0.48
Table 5 presents the VCI and drought severity for six crop types in the Aguascalientes region in 1994 and 2024. Over this period, VCI values increased for all crops, indicating slight improvements in vegetation health despite worsening drought conditions. Common bean transitioned from no drought to light drought, while corn and maize shifted from light to moderate drought. Mixed cropping and paddy, initially experiencing moderate drought, advanced to severe drought, highlighting their vulnerability to water stress. Golden pothos maintained moderate drought status but showed the highest VCI improvement. These changes reflect the compounded impacts of climate change and land use alterations on agricultural drought resilience
Table 5 Vegetation condition index (VCI) of different crop types in 1994 and 2024 in the Aguascalientes region, central Mexico
Crop type VCI in 1994 VCI in 2024 Drought in 1994 Drought in 2024
Common bean 21.00 28.00 No drought Light drought
Corn plant 29.00 32.00 Light drought Moderate drought
Golden pothos 30.00 39.00 Moderate drought Moderate drought
Maize 25.00 35.00 Light drought Moderate drought
Mixed cropping 30.00 41.00 Moderate drought Severe drought
Paddy 32.00 43.00 Moderate drought Severe drought
Table 6 illustrates the percentage change of LULC in the Aguascalientes region from 1994 to 2034, highlighting notable trends in land transformation. Agricultural land decreased significantly from 48.21% in 1994 to a projected 39.23% in 2034, reflecting urban expansion and land degradation. Built-up land nearly doubled, increasing from 8.69% to 14.12%, driven by rapid urbanization and population growth. Similarly, barren land expanded from 18.30% to 23.26%, likely due to deforestation and declining vegetation. Conversely, grassland showed a slight recovery post-2014, increasing from 20.83% to 23.29%, potentially due to land reclamation efforts. Water body declined from 0.19% to 0.10%, indicating diminishing water resources due to climate change and unsustainable land use. These changes underscore the impact of urbanization, climate variability, and agricultural intensification on LULC dynamics, emphasizing the need for sustainable land management and water conservation practices in the region.
Table 6 Percentage change of LULC from 1994 to 2024 and predicted LULC in 2034 in the Aguascalientes region, central Mexico
LULC 1994 2004 2014 2024 2034
(%)
Water body 0.19 0.18 0.15 0.13 0.10
Agricultural land 48.21 47.46 45.21 41.70 39.23
Barren land 18.30 19.38 21.78 22.30 23.26
Grassland 24.74 22.10 20.83 22.70 23.29
Built-up land 8.69 10.88 12.03 13.16 14.12

5 Discussion

VCI is a remote sensing-based index used for analyzing drought vulnerability (Taiwo et al., 2023). In the Aguascalientes region, drought vulnerability was particularly high in urban and built-up lands, while the remaining areas were predominantly covered by vegetation, showing no drought vulnerability (Stenfors et al., 2024). High VCI values indicate low vulnerability, whereas low VCI values reflect high vulnerability. Both NDVI and VCI were used to detect the spatial and temporal changes in vegetation index and vulnerability from 1994 to 2024. The VCI values for 1994 ranged from 0.00 to 78.20, while the VCI values for 2024 ranged from 0.00 to 96.30. The increase in built-up lands may have a negative impact on crop production and environmental sustainability. However, the change in built-up lands may also bring positive impacts, such as creating employment opportunities, boosting the local economy, and supporting community development. This growth can stimulate economic activity and provide infrastructure that benefits local communities (Mather and Tso, 2022; Tarek et al., 2022). The crop types for the study region, such as corn, also showed the maximum area coverage (17.49 km2). Crops show strong reflectance associated with leaf structure. The low absorption level in the shortwave infrared zone indicates low moisture content in crop leaves, which can be used to assess stress levels and overall health. The spectral temporal changes of LULC in 1994, 2004, 2014, and 2024, along with drought vulnerability assessment, indicated lower drought severity in 1994 and 2004, while drought severity increased to moderate to high levels in 2014 and reached high to very high levels in 2024. The vegetation cover has decreased from 1994 to 2024. The predicted LULC changes have been prepared to address improper development, with recommendations and strategies aimed at improving agricultural practices and mitigating drought severity in the Aguascalientes region (Taiwo et al., 2023).
The results of this study highlight significant spatiotemporal changes in LULC in the Aguascalientes region from 1994 to 2024, emphasizing the increasing vulnerability of agriculture to drought and urbanization-driven stress. The decrease in agricultural land and vegetation cover, coupled with an increase in barren and built-up lands, indicated a shift toward urban expansion and resource fragmentation. For instance, the reduction in agricultural land by 109.13 km2 and the corresponding rise in barren land (67.16 km2) underscore the dual pressures of urbanization and land degradation on regional food security. Similar findings have been reported in rapidly urbanizing regions like northern Mexico and parts of India, where unchecked urban sprawl exacerbates agricultural land loss (Kumar et al., 2014; Bonilla-Moheno and Aide, 2020). Comparing these changes with related studies globally, the increasing drought severity observed in this region aligns with findings in other semi-arid areas, such as central India and Ethiopia, where the expansion of built-up land correlates with higher surface temperatures and reduced soil moisture retention (Wubie et al., 2016; Guha and Govil, 2021). However, unlike these regions, Aguascalientes faces additional challenges due to its semi-arid climate, where water availability is further constrained by topographical factors and seasonal variability, as reflected in declining vegetation indices for key crops such as maize and common bean. Despite these parallels, the Aguascalientes region shows relatively higher urbanization rates, which may explain its greater loss of agricultural productivity compared with other similar regions.
To address these changes, regional development projects such as sustainable urban planning initiatives and water resource management programs are essential. Implementing advanced irrigation systems and promoting drought-resistant crop varieties could mitigate the adverse effects of LULC changes on agriculture. Additionally, adopting policies to preserve remaining agricultural lands and integrate green infrastructure within urban areas could reduce the environmental impact of urban expansion. Evidence from comparable regions highlights the effectiveness of such measures in maintaining agricultural productivity and reducing drought vulnerability (Nath et al., 2020; Ruben et al., 2020).
While this study provides valuable insights into LULC dynamics and agricultural drought in the Aguascalientes region, it has certain limitations. The reliance on remote sensing indices such as NDVI and NDWI, while effective for large-scale monitoring, may not fully capture local variations in crop health and soil conditions. Incorporating field-based validation and higher- resolution datasets could improve the accuracy of prediction. Additionally, the study focuses on historical and near-future trends, however, extending the temporal scope to mid-century projections could offer a more comprehensive understanding of long-term climate and LULC impacts. Future research should also explore the socio-economic dimensions of LULC changes, such as the impact on farmer livelihoods and regional food security. Investigating the potential of machine learning models to integrate socio-economic and environmental variables could enhance the predictive capacity of LULC. Lastly, interdisciplinary approaches that combine hydrological, agricultural, and socio-economic perspectives will be critical for designing holistic solutions to the challenges posed by urbanization and climate change in semi-arid regions like Aguascalientes.

6 Conclusions

The study underscored the importance of sustainable land management in mitigating the adverse impacts of LULC changes on agricultural land and drought resilience in the Aguascalientes region, Mexico. Utilizing remote sensing and machine learning, the study found a sharp decline in vegetation cover from 1994 to 2024, with a further reduction projected by 2034. Simultaneously, urban and barren lands increased, highlighting the region's shift toward urbanization and fragmentation of agricultural land. The findings also revealed that crops such as paddy exhibited the highest vegetation indices, while maize and common beans performed poorly, particularly in drought conditions. Drought severity increased significantly, with mildly dry regions becoming severely dry in 2024, emphasizing agriculture's vulnerability to climate change. This research demonstrates the efficacy of remote sensing for tracking vegetation health, water availability, and LULC dynamics, informing targeted policy measures for sustainable agricultural practices and enhanced drought resilience.

Conflict of interest

The authors declare that they have no known competing financial interests or personal relationships that could have appeared to influence the work reported in this paper.

Acknowledgements

This research was supported by the Deanship of Research and Graduate Studies at the King Khalid University (RGP2/287/46), the Princess Nourah bint Abdulrahman University Researchers Supporting Project (PNURSP2025R733), the Princess Nourah bint Abdulrahman University Research Supporting Project (RSPD2025R787), and the King Saud University, Saudi Arabia.

Author contributions

Conceptualization: Nada ALZABEN; Data curation: Mashael MAASHI, Noha NEGM, Venkatesan VEERAMANI, Sabarunisha Sheik BEGUM, Geetha PALANIAPPAN; Investigation: Nada ALZABEN; Software: Mashael MAASHI, Noha NEGM, Geetha PALANIAPPAN; Writing - original draft preparation: Mashael MAASHI; Writing - review and editing: Noha NEGM, Geetha PALANIAPPAN. All authors approved the manuscript.
[1]
AlDousari A E, Kafy A A, Saha M, et al. 2022. Modelling the impacts of land use/land cover changing pattern on urban thermal characteristics in Kuwait. Sustainable Cities and Society, 86: 104107, doi: 10.1016/j.scs.2022.104107.

[2]
Altaf F, Meraj G, Romshoo S A. 2013. Morphometric analysis to infer hydrological behaviour of Lidder Watershed, Western Himalaya, India. Geography Journal, 2013: 178021, doi: /10.1155/2013/178021.

[3]
Anderson J R. 1976. A Land Use and Land Cover Classification System for Use with Remote Sensor Data. Washington: US Government Printing Office.

[4]
Bonilla-Moheno M, Aide T M. 2020. Beyond deforestation: Land cover transitions in Mexico. Agricultural Systems, 178: 102734, doi: 10.1016/j.agsy.2019.102734.

[5]
Dwivedi R S, Sreenivas K, Ramana K V. 2005. Land-use/land-cover change analysis in part of Ethiopia using Landsat Thematic Mapper data. International Journal of Remote Sensing, 26(7): 1285-1287.

[6]
Egger G, Politti E, Lautsch E, et al. 2015. Floodplain forest succession reveals fluvial processes: A hydrogeomorphic model for temperate riparian woodlands. Journal of Environmental Management, 161: 72-82.

[7]
Foody G M. 2002. Status of land cover classification accuracy assessment. Remote Sensing of Environment, 80(1): 185-201.

[8]
Ghanbari R, Heidarimozaffar M, Soltani A, et al. 2023. Land surface temperature analysis in densely populated zones from the perspective of spectral indices and urban morphology. International Journal of Environmental Science and Technology, 20(3): 2883-2902.

[9]
Guha S, Govil H, Diwan P. 2020. Monitoring LST-NDVI relationship using premonsoon Landsat datasets. Advances in Meteorology, 2020: 4539684, doi: 10.1155/2020/4539684.

[10]
Guha S, Govil H. 2021. A long-term monthly analytical study on the relationship of LST with normalized difference spectral indices. European Journal of Remote Sensing, 54(1): 487-512.

[11]
Guha S, Govil H. 2023. Evaluating the stability of the relationship between land surface temperature and land use/land cover indices: A case study in Hyderabad City, India. Geology, Ecology, and Landscapes, 9(1): 2182083, doi: 10.1080/24749508.2023.2182083.

[12]
Guha S, Govil H, Mukherjee S. 2023. Long-term evaluation of land surface temperature with bare surface index and surface vegetation index: A case study of a central Indian city. Papers in Applied Geography, 9(4): 425-441.

[13]
Hanadé Houmma I, El Mansouri L, Gadal S, et al. 2022. Modelling agricultural drought: A review of latest advances in big data technologies. Geomatics, Natural Hazards and Risk, 13(1): 2737-2776.

[14]
Hossain M S, Arshad M, Qian L, et al. 2019. Economic impact of climate change on crop farming in Bangladesh: An application of Ricardian method. Ecological Economics, 164: 106354, doi: 10.1016/j.ecolecon.2019.106354.

[15]
Hussain S, Qin S J, Nasim W, et al. 2022a. Monitoring the dynamic changes in vegetation cover using spatio-temporal remote sensing data from 1984 to 2020. Atmosphere, 13(10): 1609, doi: 10.3390/atmos13101609.

[16]
Hussain S, Lu L L, Mubeen M, et al. 2022b. Spatiotemporal variation in land use land cover in the response to local climate change using multispectral remote sensing data. Land, 11(5): 595, doi: 10.3390/land11050595.

[17]
Johnson W C, Millett B V, Gilmanov T, et al. 2005. Vulnerability of northern prairie wetlands to climate change. BioScience, 55(10): 863-872.

[18]
Juez C, Schärer C, Jenny H, et al. 2019. Floodplain land cover and flow hydrodynamic control of overbank sedimentation in compound channel flows. Water Resources Research, 55(11): 9072-9091.

[19]
Kafy A A, Raikwar V, Al Rakib A, et al. 2021. Geospatial approach for developing an integrated water resource management plan in Rajshahi, Bangladesh. Environmental Challenges, 4: 100139, doi: 10.1016/j.envc.2021.100139.

[20]
Kanga S, Singh S K, Meraj G, et al. 2022. Assessment of the impact of urbanization on geoenvironmental settings using geospatial techniques: A study of Panchkula District, Haryana. Geographies, 2(1): 1-10.

[21]
Kumar S, Radhakrishnan N, Mathew S. 2014. Land use change modelling using a Markov model and remote sensing. Geomatics, Natural Hazards and Risk, 5(2): 145-156.

[22]
Manjarrez-Domínguez C, Uc-Campos M I, Esparza-Vela M E, et al. 2023. Geospatial-temporal dynamics of land use in the Juárez Valley: Urbanization and displacement of agriculture. Sustainability, 15(11): 8499, doi: 0.3390/su15118499.

[23]
Mather P M, Tso B. 2022. A review of remote sensing applications in land use and land cover change studies. The Egyptian Journal of Remote Sensing and Space Science, 25(1): 1178604, doi: 10.1177/1178604.

[24]
McNeill J, Alves D, Arizpe L, et al. 1994. Toward a typology and regionalization of land-cover and land-use change:Report of working group B. In: Meyer W B, Turner B L. Changes in Land Use and Land Cover: AGlobal Perspective. Cambridge: Cambridge University Press, 55-71.

[25]
Merlín-Uribe Y, Contreras-Hernández A, Astier-Calderón M, et al. 2013. Urban expansion into a protected natural area in Mexico City: Alternative management scenarios. Journal of Environmental Planning and Management, 56(3): 398-411.

[26]
Meyer W B, Turner B L. 1994. Changes in Land Use and Land Cover: A Global Perspective (Vol. 4). Cambridge: Cambridge University Press.

[27]
Middleton B A. 2002. The flood pulse concept in wetland restoration. In: Middleton B A. Flood Pulsing in Wetlands: Restoring the Natural Hydrological Balance. New York: John Wiley & Sons, 1-10.

[28]
Mishra V N, Rai P K. 2016. A remote sensing aided multi-layer perceptron-Markov chain analysis for land use and land cover change prediction in Patna district (Bihar), India. Arabian Journal of Geosciences, 9: 249, doi: 10.1007/s12517-015-2138-3.

[29]
Mitchell M G, Bennett E M, Gonzalez A. 2015. Strong and nonlinear effects of fragmentation on ecosystem service provision at multiple scales. Environmental Research Letters, 10(9): 094014, doi: 10.1088/1748-9326/10/9/094014.

[30]
Mohammadpouri S, Sadeghnejad M, Rezaei H, et al. 2023. A generalized regression neural network model for accuracy improvement of global precipitation products: A climate zone-based local optimization. Sustainability, 15(11): 8740, doi: 10.3390/su15118740.

[31]
Nath B, Wang Z H, Ge Y, et al. 2020. Land use and land cover change modelling and future potential landscape risk assessment using Markov-CA model and analytical hierarchy process. ISPRS International Journal of Geo-Information, 9(2): 134, doi: 10.3390/ijgi9020134.

[32]
Omar N Q, Ahamad M S S, Wan Hussin W M A, et al. 2014. Markov CA, multi regression, and multiple decision making for modeling historical changes in Kirkuk City, Iraq. Journal of the Indian Society of Remote Sensing, 42(1): 165-178.

[33]
Palaniappan A B. 2004. Channel Processes. In: Singh V P, Sharma N, Ojha C S P. Brahmaputra Basin Water Resources. Dordrecht: Springer Netherlands, 196-213.

[34]
Ruben G B, Zhang K, Dong Z C, et al. 2020. Analysis and projection of land-use/land-cover dynamics through scenario-based simulations using the CA-Markov model: A case study in Guanting Reservoir Basin, China. Sustainability, 12(9): 3747, doi: 10.3390/su12093747.

[35]
Stenfors E, Blicharska M, Grabs T, et al. 2024. Droughts in forested ecoregions in cold and continental climates: A review of vulnerability concepts and factors in socio-hydrological systems. WIREs Water, 11(2): e1692, doi: 10.1002/wat2.1692.

[36]
Taiwo B E, Kafy A A, Samuel A A, et al. 2023. Monitoring and predicting the influences of land use/land cover change on cropland characteristics and drought severity using remote sensing techniques. Environmental and Sustainability Indicators, 18: 100248, doi: 10.1016/j.indic.2023.100248.

[37]
Tarek M O R, Amit S, Kafy A A. 2022. Sharing economy:Conceptualization, motivators, and barriers, and avenues for research in Bangladesh. In: Rahman M M, Goel R, Gome A P, et al. Redefining Global Economic Thinking for the Welfare of Society. New York: IGI Global, 57-74.

[38]
Thanh Noi P, Kappas M. 2017. Comparison of random forest, k-nearest neighbor, and support vector machine classifiers for land cover classification using Sentinel-2 imagery. Sensors, 18(1): 18, doi: 10.3390/s18010018.

[39]
van Vliet J. 2019. Direct and indirect loss of natural area from urban expansion. Nature Sustainability, 2(8): 755-763.

[40]
Wubie M A, Assen M, Nicolau M D. 2016. Patterns, causes, and consequences of land use/cover dynamics in the Gumara watershed of Lake Tana Basin, northwestern Ethiopia. Environmental Systems Research, 5(1): 8, doi: 10.1186/s40068-016-0058-1.

[41]
Yang X, Zheng X Q, Chen R. 2014. A land use change model: Integrating landscape pattern indexes and Markov-CA. Ecological Modelling, 283: 1-7.

[42]
Zambrano L, Aronson M F, Fernandez T. 2019. The consequences of landscape fragmentation on socio-ecological patterns in a rapidly developing urban area: A case study of the National Autonomous University of Mexico. Frontiers in Environmental Science, 7: 152, doi: 10.3389/fenvs.2019.00152.

文章导航

/