
Effect of coir geotextile and geocell on ephemeral gully erosion in the Mollisol region of Northeast China
Received date: 2024-01-18
Revised date: 2024-03-22
Accepted date: 2024-03-28
Online published: 2024-04-30
QIN Xijin , SUN Yiqiu , ZHANG Yan , GUAN Yinghui , WU Hailong , WANG Xinyu , WANG Guangyu . [J]. Journal of Arid Land, 2024 , 16(4) : 518 -530 . DOI: 10.1007/s40333-024-0012-4
The unique geomorphological features and farming methods in the Mollisol region of Northeast China increase water catchment flow and aggravate the erosion of ephemeral gully (EG). Vegetation suffers from rain erosion and damage during the growth stage, which brings serious problems to the restoration of grass in the early stage. Therefore, effects of coir geotextile and geocell on EG erosion under four confluence intensities were researched in this study. Results of the simulated water discharge erosion test showed that when the confluence strength was less than 30 L/min, geocell and coir geotextile had a good effect on controlling EG erosion, and sediment yield of geocell and coir geotextile was reduced by 25.95%-37.82% and 73.73%-88.96%, respectively. However, when confluence intensity increased to 40 L/min, protective effect of coir geotextile decreased, and sediment yield rate increased sharply by 189.03%. When confluence intensity increased to 50 L/min, the protective effect of coir geotextile was lost. On the other hand, geocell showed that the greater the flow rate, the better the protective effect. In addition, with the increase in confluence intensity, erosion pattern of coir geotextile developed from sheet erosion to intermittent fall and then to completion of main rill, and the protective effect was gradually weakened. In contrast, the protective effect of EG under geocell was gradually enhanced from the continuous rill to the intermittent rill and finally to the intermittent fall. This study shows that coir geotextile and geocell can prevent EG erosion, and the effect of geocell is better than that of coir geotextile on the surface of EG.
Key words: geocell; coir geotextile; ephemeral gully; confluence intensity; erosion control
Table 1 Characteristics of different measures for erosion control |
Type | Name | Characteristics of different measures | ||
|---|---|---|---|---|
| Interception and water storage characteristics | Preventing undercutting erosion | Continuous erosion prevention and control on slope surface | ||
| Surface continuous covering measure | Coir geotextile | * | * | * |
| Surface discontinuous covering measure | Mulch with straw or wood chip | * | - | - |
| Surface blocking measure | Log erosion barrier and log debris dam | * | - | - |
| Deep interception measure | Geocell | * | * | * |
Note: * indicates that this function is available; - indicates that this effect cannot be achieved. |
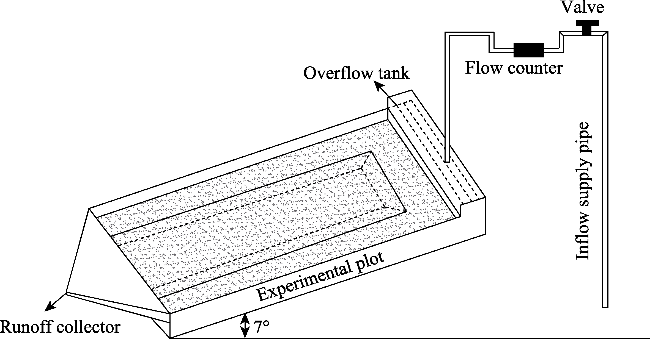
Fig. 1 An illustration of the experimental device. Coir geotextile is made of coconut fiber and a protective net through mechanical processing. Blanket weight is 334 g/m2, thickness is approximately 3.0-5.0 mm, longitudinal breaking strength is 2.0 kN/m, and transverse breaking strength is 1.9 kN/m. Geocell is made of high density polyethylene material, solder joint peel strength is >3000 N, thickness is 1.3 mm, and height is 60.0 mm. |
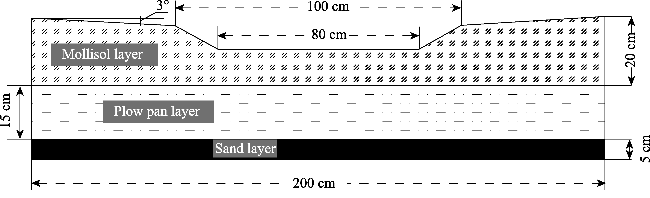
Fig. 2 A cross-section of runoff plot |
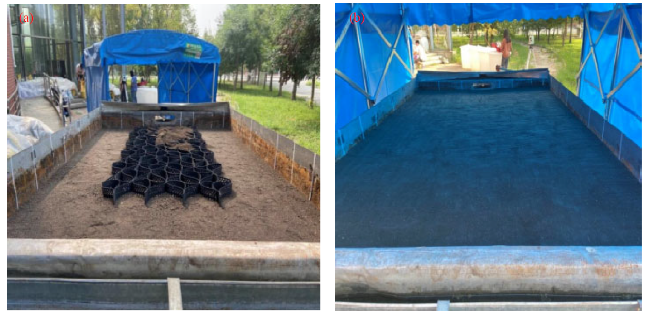
Fig. 3 Layout of geocell (a) and expanded geocell (b) |
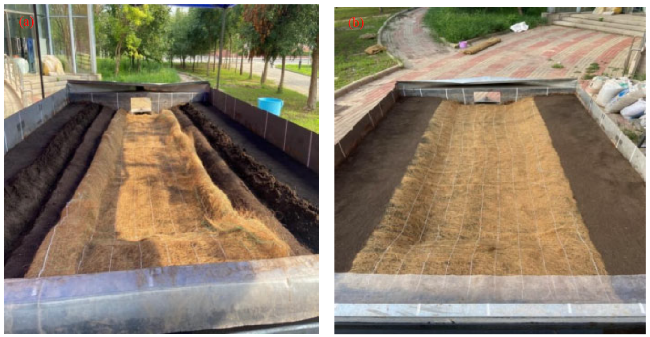
Fig. 4 Layout of coir geotextile (a) and expanded coir geotextile (b) |
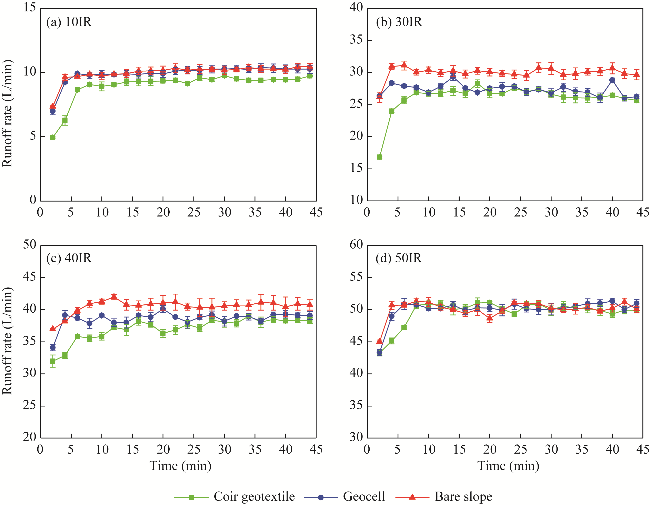
Fig. 5 Variation in runoff rate under different treatments. (a), 10IR (10 L/min inflow rate); (b), 30IR (30 L/min inflow rate); (c), 40IR (40 L/min inflow rate); (d), 50IR (50 L/min inflow rate). Bars are standard errors. |
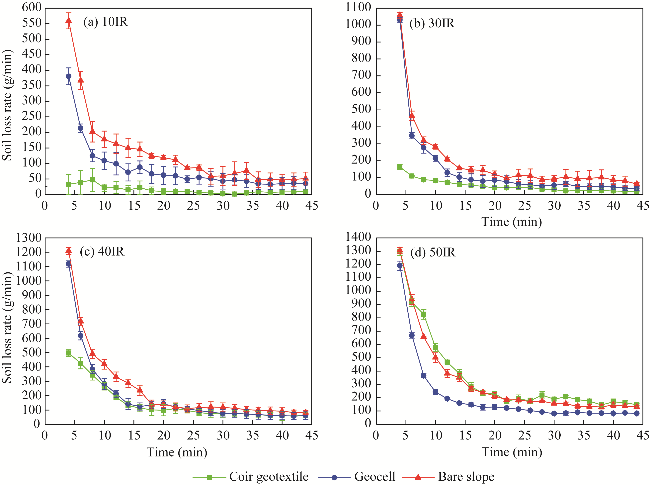
Fig. 6 Variation in soil loss rate under different treatments. (a), 10IR (10 L/min inflow rate); (b), 30IR (30 L/min inflow rate); (c), 40IR (40 L/min inflow rate); (d), 50IR (50 L/min inflow rate). Bars are standard errors. |
Table 2 Soil loss and erosion reduction effectiveness under different treatments |
| Treatment | Soil loss (g) | Erosion reduction effectiveness (%) | ||||||
|---|---|---|---|---|---|---|---|---|
| 10IR | 30IR | 40IR | 50IR | 10IR | 30IR | 40IR | 50IR | |
| Bare slope | 8931 | 9014 | 11,102 | 11,962 | - | - | - | - |
| Geocell | 3633 | 5165 | 5524 | 6169 | 59.32 | 42.70 | 50.24 | 48.43 |
| Coir geotextile | 929 | 3894 | 5680 | 9770 | 89.60 | 56.80 | 48.84 | 18.32 |
Note: 10IR, 10 L/min inflow rate; 30IR, 30 L/min inflow rate; 40IR, 40 L/min inflow rate; 50IR, 50 L/min inflow rate. - means no value. |
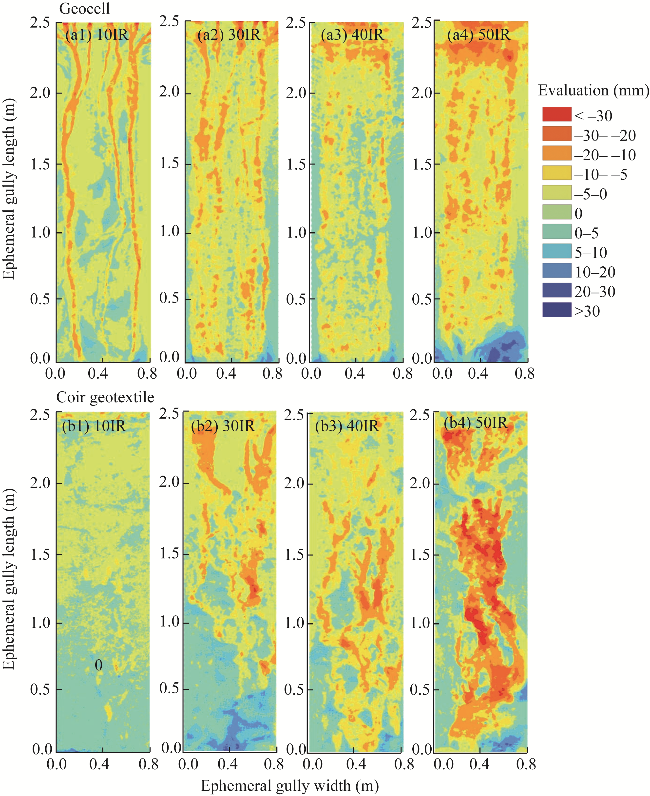
Fig. 7 Microtopography change under geocell (a1-a4) and coir geotextile (b1-b4) treatments. 10IR, 10 L/min inflow rate; 30IR, 30 L/min inflow rate; 40IR, 40 L/min inflow rate; 50IR, 50 L/min inflow rate. |
| [1] |
|
| [2] |
|
| [3] |
|
| [4] |
|
| [5] |
|
| [6] |
|
| [7] |
|
| [8] |
|
| [9] |
|
| [10] |
|
| [11] |
|
| [12] |
|
| [13] |
|
| [14] |
|
| [15] |
|
| [16] |
|
| [17] |
|
| [18] |
|
| [19] |
|
| [20] |
|
| [21] |
|
| [22] |
|
| [23] |
|
| [24] |
|
| [25] |
|
| [26] |
|
| [27] |
|
| [28] |
|
| [29] |
|
| [30] |
|
| [31] |
|
| [32] |
|
| [33] |
|
| [34] |
|
| [35] |
|
| [36] |
|
| [37] |
|
| [38] |
|
| [39] |
|
/
| 〈 |
|
〉 |