
Spatiotemporal variability of rain-on-snow events in the arid region of Northwest China
Received date: 2023-12-24
Revised date: 2024-03-19
Accepted date: 2024-03-21
Online published: 2024-04-30
YANG Zhiwei , CHEN Rensheng , LIU Zhangwen , ZHAO Yanni , LIU Yiwen , WU Wentong . [J]. Journal of Arid Land, 2024 , 16(4) : 483 -499 . DOI: 10.1007/s40333-024-0074-3
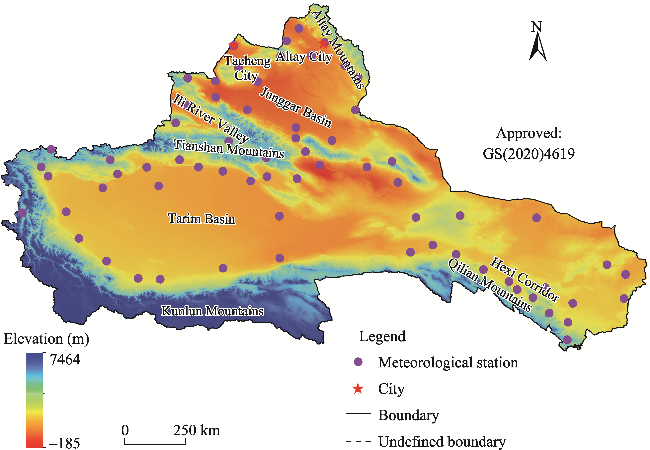
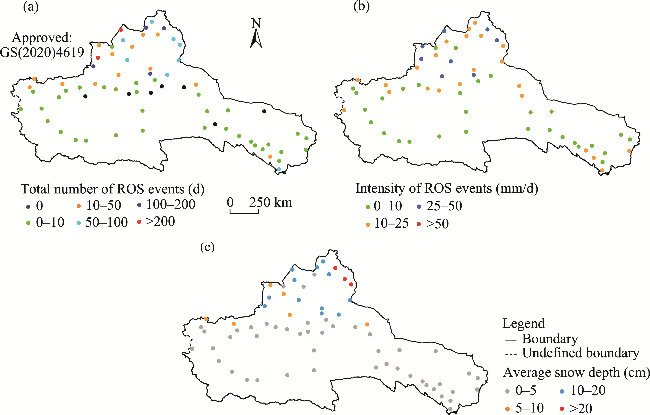
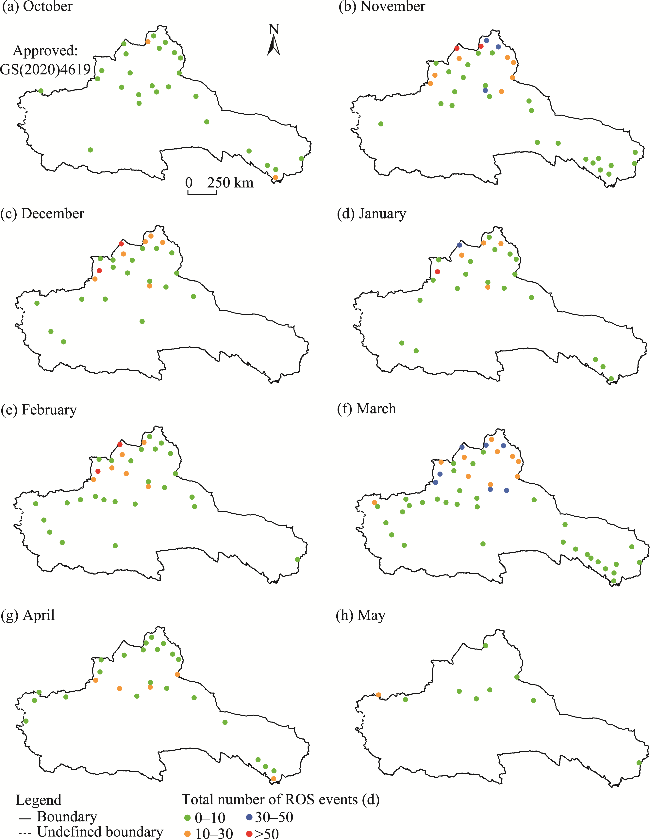
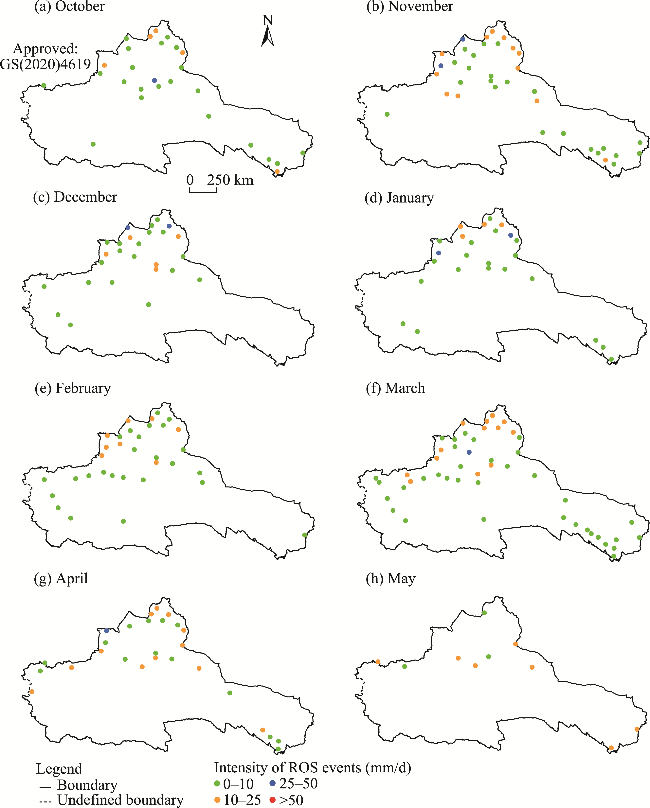
Rain-on-snow (ROS) events involve rainfall on snow surfaces, and the occurrence of ROS events can exacerbate water scarcity and ecosystem vulnerability in the arid region of Northwest China (ARNC). In this study, using daily snow depth data and daily meteorological data from 68 meteorological stations provided by the China Meteorological Administration National Meteorological Information Centre, we investigated the spatiotemporal variability of ROS events in the ARNC from 1978 to 2015 and examined the factors affecting these events and possible changes of future ROS events in the ARNC. The results showed that ROS events in the ARNC mainly occurred from October to May of the following year and were largely distributed in the Qilian Mountains, Tianshan Mountains, Ili River Valley, Tacheng Prefecture, and Altay Prefecture, with the Ili River Valley, Tacheng City, and Altay Mountains exhibiting the most occurrences. Based on the intensity of ROS events, the areas with the highest risk of flooding resulting from ROS events in the ARNC were the Tianshan Mountains, Ili River Valley, Tacheng City, and Altay Mountains. The number and intensity of ROS events in the ARNC largely increased from 1978 to 2015, mainly influenced by air temperature and the number of rainfall days. However, due to the snowpack abundance in areas experiencing frequent ROS events in the ARNC, snowpack changes exerted slight impact on ROS events, which is a temporary phenomenon. Furthermore, elevation imposed lesser impact on ROS events in the ARNC than other factors. In the ARNC, the start time of rainfall and the end time of snowpack gradually advanced from the spring of the current year to the winter of the previous year, while the end time of rainfall and the start time of snowpack gradually delayed from autumn to winter. This may lead to more ROS events in winter in the future. These results could provide a sound basis for managing water resources and mitigating related disasters caused by ROS events in the ARNC.
Fig. 1 Overview of the arid region of Northwest China (ARNC) based on the digital elevation model (DEM). DEM data were obtained from Hydrological data and maps based on SHuttle Elevation Derivatives at multiple Scales (HydroSHEDS) (https://hydrosheds.org/downloads). Tacheng City is the administration center of Tacheng Prefecture in Xinjiang Uygur Autonomous Region and Altay City is the administration center of Altay Prefecture. Note that the figure is based on the standard map (GS(2020)4619) of the Map Service System (https://bzdt.ch.mnr.gov.cn/), and the standard map has not been modified. |
Fig. 2 Spatial distribution of the total number of rain-on-snow (ROS) events (a), intensity of ROS events (b), and average snow depth (c) in the ARNC during 1978-2015. Note that the figures are based on the standard map (GS(2020)4619) of the Map Service System (https://bzdt.ch.mnr.gov.cn/), and the standard map has not been modified. |
Fig. 3 Spatial distribution of the total number of ROS events in October (a), November (b), December (c), January (d), February (e), March (f), April (g), and May (h) in the ARNC during 1978-2015. Stations without ROS events from 1978 to 2015 are not shown in the figure. Note that the figures are based on the standard map (GS(2020)4619) of the Map Service System (https://bzdt.ch.mnr.gov.cn/), and the standard map has not been modified. |
Fig. 4 Spatial distribution of the intensity of ROS events in October (a), November (b), December (c), January (d), February (e), March (f), April (g), and May (h) in the ARNC during 1978-2015. Stations without ROS events from 1978 to 2015 are not shown in the figures. Note that the figures are based on the standard map (GS(2020)4619) of the Map Service System (https://bzdt.ch.mnr.gov.cn/), and the standard map has not been modified. |
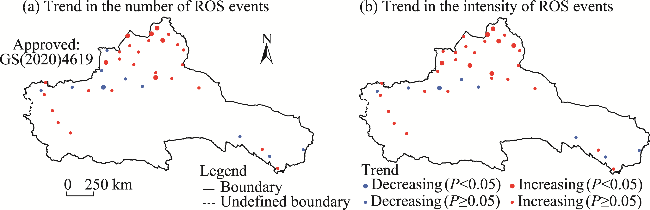
Fig. 5 Trends in the number (a) and intensity (b) of ROS events at 38 meteorological stations in the ARNC during 1978-2015. The 38 stations have ROS events occurring at least 5 a. Note that the figures are based on the standard map (GS(2020)4619) of the Map Service System (https://bzdt.ch.mnr.gov.cn/), and the standard map has not been modified. |
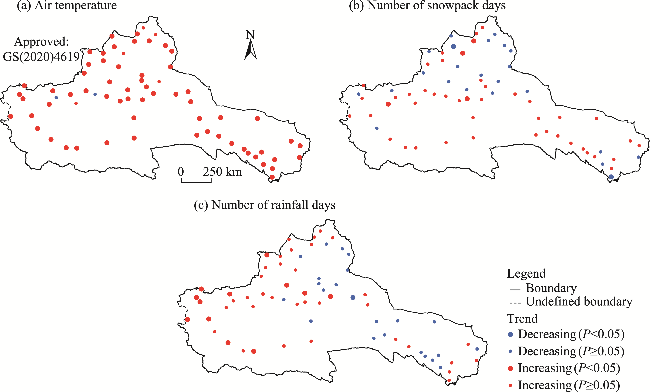
Fig. 6 Trends in air temperature (a), number of snowpack days (b), and number of rainfall days (c) at 68 meteorological stations in the ARNC during 1978-2015. Note that the figures are based on the standard map (GS(2020)4619) of the Map Service System (https://bzdt.ch.mnr.gov.cn/), and the standard map has not been modified. |
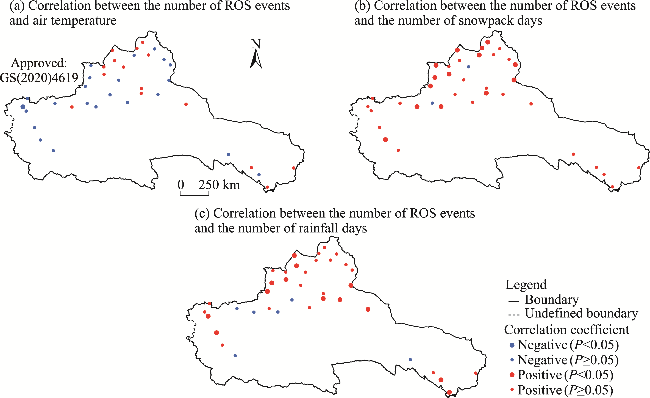
Fig. 7 Correlations of the number of ROS events with air temperature (a), the number of snowpack days (b), and the number of rainfall days (c) at 38 meteorological stations in the ARNC. The 38 stations have ROS events occurring at least 5 a. Note that the figures are based on the standard map (GS(2020)4619) of the Map Service System (https://bzdt.ch.mnr.gov.cn/), and the standard map has not been modified. |
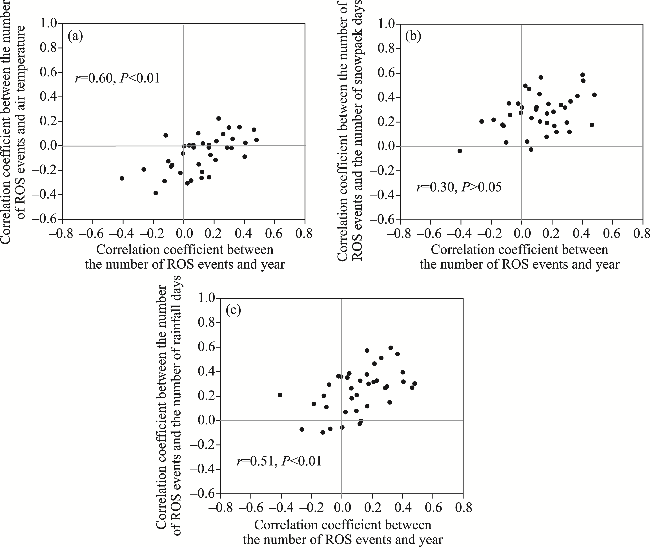
Fig. 8 Correlations between the trend in ROS events (indicated by the correlation between the number of ROS events and year) and the correlation of the number of ROS events with air temperature (a), the number of snowpack days (b), and the number of rainfall days (c). Data points correspond to 38 meteorological stations with ROS events occurring in at least 5 a. |
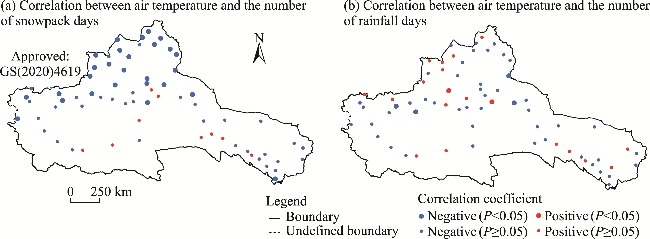
Fig. 9 Correlations of air temperature with the number of snowpack days (a) and the number of rainfall days (b) at 68 meteorological stations in the ARNC. Note that the figures are based on the standard map (GS(2020)4619) of the Map Service System (https://bzdt.ch.mnr.gov.cn/), and the standard map has not been modified. |
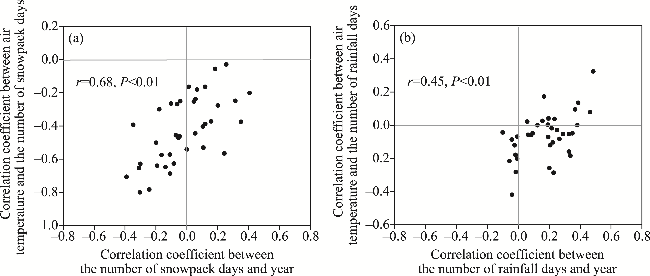
Fig. 10 Correlations between the trend in the number of snowpack days (indicated by the correlation between the number of snowpack days and year) and the correlation of air temperature with the number of snowpack days (a) as well as between the trend in the number of rainfall days (indicated by the correlation between the number of rainfall days and year) and the correlation of air temperature with the number of rainfall days (b). Data points correspond to 38 meteorological stations with ROS events occurring in at least 5 a. |
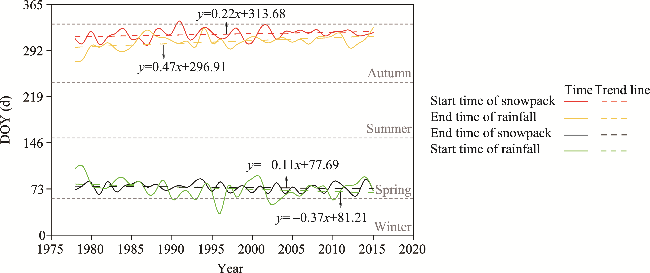
Fig. 11 Trends in the start time and end time of rainfall and snowpack in the ARNC from 1978 to 2015. DOY, day of the year. The dotted gray lines in the figure indicate the time boundaries of the four seasons. |
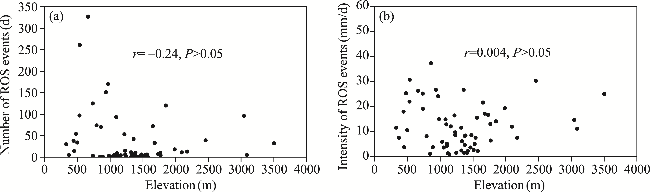
Fig. 12 Impact of elevation on the number of ROS events (a) and the intensity of ROS events (b) in the ARNC |
| [1] |
|
| [2] |
|
| [3] |
|
| [4] |
|
| [5] |
|
| [6] |
|
| [7] |
|
| [8] |
|
| [9] |
|
| [10] |
|
| [11] |
|
| [12] |
|
| [13] |
|
| [14] |
|
| [15] |
|
| [16] |
|
| [17] |
|
| [18] |
|
| [19] |
|
| [20] |
|
| [21] |
|
| [22] |
|
| [23] |
|
| [24] |
|
| [25] |
|
| [26] |
|
| [27] |
|
| [28] |
|
| [29] |
|
| [30] |
|
| [31] |
|
| [32] |
|
| [33] |
|
| [34] |
|
| [35] |
|
| [36] |
|
| [37] |
|
| [38] |
|
| [39] |
|
| [40] |
|
| [41] |
|
| [42] |
|
| [43] |
|
| [44] |
|
| [45] |
|
| [46] |
|
/
| 〈 |
|
〉 |