• WANG Xingbo 1 ,
  • ZHANG Shuanghu , 1, * ,
  • TIAN Yiman 1, 2
展开

收稿日期: 2023-10-07

  修回日期: 2024-02-05

  录用日期: 2024-03-04

  网络出版日期: 2024-04-30

Assessment of runoff changes in the sub-basin of the upper reaches of the Yangtze River basin, China based on multiple methods

  • WANG Xingbo 1 ,
  • ZHANG Shuanghu , 1, * ,
  • TIAN Yiman 1, 2
Expand
  • 1Department of Water Resources, China Institute of Water Resources and Hydropower Research, Beijing 100038, China
  • 2College of Hydrology and Water Resources, Hohai University, Nanjing 210098, China
*ZHANG Shuanghu (E-mail: )

Received date: 2023-10-07

  Revised date: 2024-02-05

  Accepted date: 2024-03-04

  Online published: 2024-04-30

本文引用格式

WANG Xingbo , ZHANG Shuanghu , TIAN Yiman . [J]. Journal of Arid Land, 2024 , 16(4) : 461 -482 . DOI: 10.1007/s40333-024-0010-6

Abstract

Quantitative assessment of the impact of climate variability and human activities on runoff plays a pivotal role in water resource management and maintaining ecosystem integrity. This study considered six sub-basins in the upper reaches of the Yangtze River basin, China, to reveal the trend of the runoff evolution and clarify the driving factors of the changes during 1956-2020. Linear regression, Mann-Kendall test, and sliding t-test were used to study the trend of the hydrometeorological elements, while cumulative distance level and ordered clustering methods were applied to identify mutation points. The contributions of climate change and human disturbance to runoff changes were quantitatively assessed using three methods, i.e., the rainfall-runoff relationship method, slope variation method, and variable infiltration capacity (Budyko) hypothesis method. Then, the availability and stability of the three methods were compared. The results showed that the runoff in the upper reaches of the Yangtze River basin exhibited a decreasing trend from 1956 to 2020, with an abrupt change in 1985. For attribution analysis, the runoff series could be divided into two phases, i.e., 1961-1985 (baseline period) and 1986-2020 (changing period); and it was found that the rainfall-runoff relationship method with precipitation as the representative of climate factors had limited usability compared with the other two methods, while the slope variation and Budyko hypothesis methods had highly consistent results. Different factors showed different effects in the sub-basins of the upper reaches of the Yangtze River basin. Moreover, human disturbance was the main factor that contributed to the runoff changes, accounting for 53.0%-82.0%; and the contribution of climate factors to the runoff change was 17.0%-47.0%, making it the secondary factor, in which precipitation was the most representative climate factor. These results provide insights into how climate and anthropogenic changes synergistically influence the runoff of the upper reaches of the Yangtze River basin.

1 Introduction

In recent decades, global warming has changed the hydrological cycle (Hiwasaki et al., 2014; Millan, 2014; Poschlod et al., 2020), further impacting runoff via changing precipitation and evapotranspiration (Francisco et al., 2022). Furthermore, human activities affect the generation and processing of runoff through direct and indirect influences, including reservoir construction and vegetation cover (Zhang et al., 2022; Zhao and Huang, 2022). These two became primary driving factors of runoff variability (Ye et al., 2013), clarifying the trends and determining the specific contributions of these changes to the runoff amount (Wang et al., 2013; Wang et al., 2022; Wu et al., 2022). In the second half of the 20th century, around one-third of 137 globally representative rivers with areas ranging from 0.03×10⁶ to 6.30×10⁶ km2 experienced about 30.0% runoff changes annually, while many of these mid-latitude rivers experienced a 60.0% decrease in annual runoff (Walling and Fang, 2003; Blum and Roberts, 2009). These varying degrees of runoff variability pose a significant challenge to water resource management. A quantitative analysis of the impact of climate change and human disturbance on runoff changes can provide theoretical support and decision-making references for the scientific development and utilization of water resources (Wang et al., 2013a; Yazdandoost and Morandian, 2021). Most of the existing studies investigating the impact of climate change and human activities on runoff used hydrological models (Bao et al., 2012), elasticity methods, or empirical statistical methods (Zhai and Tao, 2017). These methods can be applied under different conditions. Hydrological models, such as soil water assessment tool (SWAT) and variable infiltration capacity (Budyko) models, which evaluate the impact of climate changes and human activities by reconstructing the runoff time series (Setti et al., 2020), are usually limited by complicated calculation and very large amounts of data. Budyko-based elasticity methods use numerous derivative formulas and are relatively simple to be calculated (Feng et al., 2017; Liu et al., 2019). Although the physical foundations of empirical statistical methods are relatively simple, the satisfying precision and the simplicity of calculation process in these methods make them widely used (Hu et al., 2019).
Previous studies on attribution analyses of runoff changes in arid areas of China were extensively studied. Liu and Du (2017) found that human activities were the main factors in annual runoff changes in northern and middle-eastern China. Li et al. (2007) indicated that human activities accounted for 87.0% of the total reduction in annual runoff in the Wuding River, Loess Plateau, China. According to Yuan et al. (2018), climate variability and land use and land cover change contributed to 27.1%-49.8% and 50.2%-72.9% decreases of natural runoff in the Yellow River between natural and impacted periods, respectively. Du et al. (2011) found that human activities and climate changes increased discharge at the rates of 53.0% and 47.0%, respectively. The Yangtze River, the world's third-largest river and the main water source for China (Qian et al., 2012; Peng et al., 2018), provides abundant hydroelectric resources and has become the largest reservoir at the global scale. However, the number of natural disasters and water resource problems have increased in recent years (Qin et al., 2019; Cao et al., 2021; Hu and Zhang, 2022). Consequently, studying the variety of hydrological fluxes under these conditions and investigating changes in runoff processes and their impacts on the hydrological cycle of the Yangtze River basin attracted the attention of academic community (Li et al., 2016). However, most studies have focused on the impact of climate change and human activities on the hydrological processes of the entire Yangtze River basin, emphasizing the hydrological changes at the basin outlet. The lack of quantitative analysis between different catchment areas makes the comprehensive assessment of the impact of climate changes and human activities on the hydrological processes of the upper reaches of the Yangtze River basin difficult. Therefore, the focus of this study is on the attribution analysis of the changes in water resources in the upper reaches of the Yangtze River basin. The changes of runoff in each sub-basin of the upper reaches of the Yangtze River basin were studied, and the main causes of these changes were determined. The findings of this study are of the utmost importance for the planning and management of water resources in the upper reaches of the Yangtze River basin and similar areas around the world.

2 Materials and methods

2.1 Study area

The Yangtze River basin is located in southwestern China (24°27′-35°54′N, 90°33′-112°19′E; Fig. 1). The area of the upper reaches of the Yangtze River basin is 100.5×10⁴ km2, accounting for 71.4% of the total area of the Yangtze River basin.
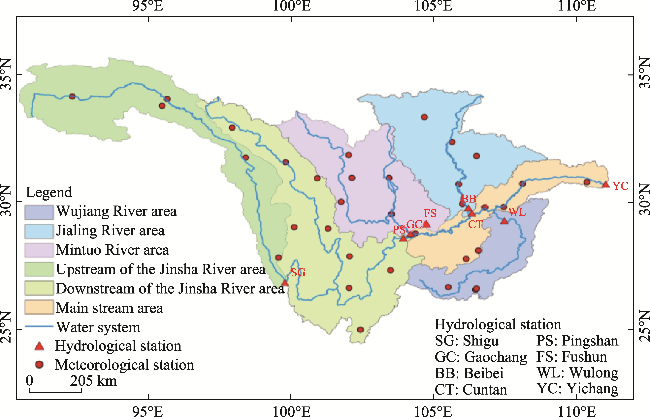
Fig. 1 Location and hydrological and meteorological stations of the study area

2.2 Data

We divided the upper reaches of the Yangtze River basin into several sub-basins according to topographical characteristics, including upstream of the Jinsha River (UJR), downstream of the Jinsha River (DJR), Mintuo River (MTR), Jialing River (JLR), Wujiang River (WR), and the main stream of the upper reaches of the Yangtze River. Eight hydrological stations, including Shigu (SG), Pingshan (PS), Gaochang (GC), Fushun (FS), Beibei (BB), Wulong (WL), Cuntan (CT), and Yichang (YC) were selected (Fig. 1). The PS station was moved downstream for 2 km because of the construction of the Xiangjiaba hydropower station in 2012. The data after 2012 were collected from the new station, but for the sake of consistency, we keep calling it the PS station. In this study, we selected the data from 1956 to 2020.
Monthly runoff data were obtained from the Hydrological Year Book of China. Meteorological data, i.e., mainly monthly precipitation and evaporation, were collected from the China Meteorological Data Sharing Service System (http://data.cma.gov.cn). Evaporation data were collected from 34 small evaporation dishes in the watershed and calculated using a conversion factor of 0.6 between small evaporation dishes and potential real evaporation, which was referenced from Sheng (2006). The missing data were interpolated and averaged from surrounding areas. Gross domestic product (GDP) and population data in the study area were gathered from the Provincial Statistical Yearbooks of Qinghai, Sichuan, Yunnan, and Hubei provinces and Chongqing City. Land use datasets, which were developed in the late 1980s and 2010, were obtained from the Science Data Center of the Chinese Academy of Sciences (http://www. resdc.cn). Five images were used in this study, including 1980, 1990, 2000, 2010, and 2020.

2.3 Methods

2.3.1 Characterization of hydrological variations

Four methods were used in this study, including the Mann-Kendall (MK) test, cumulative distance level method, ordered clustering method, and wavelet analysis. The MK test has good applicability in hydrometeorological data analysis because of fewer requirements for sample data distribution. The cumulative distance level method accumulates the deviation between measured value and mean value (Kong et al., 2016), and visualizes the trend of discrete data points through the curve changes, and then determines the sudden change in precipitation and runoff in different periods. The ordered clustering method is used to estimate the transition point of a given time series. Finding the critical year is achieved by separating time series into consecutive non-overlapping epochs, where the total sum of squared deviations (Sn) before and after is the minimum (Zhang et al., 2019). The wavelet analysis is used to identify periodic oscillations of signals in standardized runoff, precipitation, evaporation time series, and time-frequency correlations. And the Morlet wavelet was chosen for the wavelet transform.

2.3.2 Attribution analysis

Climate changes and human activities are generally considered the main factors that impact runoff. The rainfall-runoff relationship method, slope changing ratio of cumulative quantity (SCRCQ) method, and Budyko hypothesis method were used in this study.
(1) Rainfall-runoff relationship method
Because of the correlation between precipitation and runoff, the double mass curve built by cumulative runoff and precipitation in the same period can visualize the relationship between precipitation and runoff (Pirnia et al., 2019). The main equations are listed as follows:
$\sum{Q={{k}_{1}}\sum{P+{{k}_{_{2}}}}}$,
${{C}_{_{C}}}=\frac{\Delta {{\bar{Q}}_{C}}}{\Delta \bar{Q}}=\frac{{{\bar{\widehat{Q}}}_{B}}-{{\bar{Q}}_{A}}}{{{\bar{Q}}_{B}}-{{\bar{Q}}_{A}}}\times 100\%,$
${{C}_{_{H}}}=\frac{\Delta {{\bar{Q}}_{H}}}{\Delta \bar{Q}}=\frac{{{\bar{Q}}_{B}}-{{\bar{\widehat{Q}}}_{B}}}{{{\bar{Q}}_{B}}-{{\bar{Q}}_{A}}}\times 100\%,$
$\eta =\left| \frac{\Delta {{\bar{Q}}_{H}}}{\Delta {{\bar{\widehat{Q}}}_{B}}} \right|,$
where Q and P are the average annual runoff (×108 m3) and precipitation (mm), respectively; k1 and k2 are the parameters; $\Delta \bar{Q}$ is the total change in runoff (×108 m3), $\bar{Q}_{A}$ and $\bar{Q}_{B}$ are the measured runoff in the baseline period and the changing period, respectively (×108 m3); $\bar{\hat{Q}}_{B}$ is the estimated runoff (×108 m³); $\Delta \bar{Q}_{C}$ and $\Delta \bar{Q}_{H}$ are the amount of climate and anthropogenic impacts on runoff, respectively (×108 m³); ${{C}_{C}}$ and ${{C}_{H}}$ are the contribution of climate and human activities to runoff change, respectively (%); and η is the anthropogenic impact benefit. Considering different lengths of periods in the base and the changing periods, we performed calculations using average values.
(2) SCRCQ method
SCRCQ method was essentially used to decompose the effects of climate factors and human activities on runoff changes using the cumulative amount, which can avoid the right advertence defect from the double mass curve of runoff and precipitation and the multi-point abrupt change from the non-parameter MK detection (Wu et al., 2017). Climate impacts in this method include precipitation and evapotranspiration.
The change percentages of runoff (RSR; %), precipitation (RSP; %), and evaporation (RSE; %) are calculated as follows:
$R_{S R}=\left[\frac{S_{R b}-S_{R a}}{S_{R a}}\right] \times 100 \%$,
${{R}_{SP}}=\left[ \frac{{{S}_{Pb}}-{{S}_{Pa}}}{{{S}_{Pa}}} \right]\times 100\%$,
${{R}_{SE}}=\left[ \frac{{{S}_{Eb}}-{{S}_{Ea}}}{{{S}_{Ea}}} \right]\times 100\%$,
where SRa and SRb are the cumulative runoff in the baseline and changing periods, respectively (×108 m3/a); SPa and SPb are the cumulative precipitation in the baseline and changing periods, respectively (mm/a); and SEa and SEb are the cumulative evaporation in the baseline and changing periods, respectively (mm/a).
Normally, because precipitation is positively correlated with runoff and evaporation is negatively correlated with runoff, the contributions of precipitation (CP; %) and evaporation (CE; %) to runoff are defined as follows:
${{C}_{P}}=\frac{{{R}_{SP}}}{{{R}_{SR}}}\times 100\%$,
${{C}_{E}}=\frac{{{R}_{SE}}}{{{R}_{SR}}}\times 100\%$.
The contribution of climate change (CC; %) is calculated as follows:
${{C}_{C}}={{C}_{P}}+{{C}_{E}}$.
(3) Budyko hypothesis method
Based on the water balance equation, we described the balance in a basin as follows (Xu et al., 2014; Wu et al., 2017; He et al., 2019a):
$P=E+R+\Delta S$,
where P is the precipitation (mm); R is the runoff (mm); E is the actual evapotranspiration (mm); and$\Delta S$is the variation of water storage in the basin (mm), which is considered zero in a closed basin over a long period, such as 5–10 a.
We calculated the long-term annual evapotranspiration based on the following equation proposed by Zhang et al. (2001):
$\frac{E}{P}=\frac{1+\omega \frac{{{E}_{0}}}{P}}{1+\omega \frac{{{E}_{0}}}{P}+{{\left( \frac{{{E}_{0}}}{P} \right)}^{-1}}}$,
where ω is the plant-available water coefficient relating to the way of plants use soil water for transpiration (Xue et al., 2022); and E0 is the potential evapotranspiration (mm). Assuming P and E0 in Equtaion 12 are independent variables, and we can write Equation 12 as R=f(P, E0). Taking a partial derivative of it, and we can write the total differential of R as follows:
$\frac{dR}{R}=\frac{{\partial R}/{R}\;}{{\partial P}/{P}\;}\frac{dP}{P}+\frac{{\partial R}/{R}\;}{{\partial {{E}_{0}}}/{{{E}_{0}}}\;}\frac{d{{E}_{0}}}{{{E}_{0}}}$,
where d is the total differential; and $\partial $ is the partial derivative.
The ratio of the growth rates of two interrelated indicators in a given period is defined as the coefficient of elasticity, which can easily assess the influence of the variables' change on runoff easily (Zhang and He, 2016). The precipitation elasticity of runoff (${{\varepsilon }_{P}}$) and the potential evaporation elasticity of runoff (${{\varepsilon }_{{{E}_{0}}}}$) are calculated as follows:
${{\varepsilon }_{P}}=\frac{{\partial R}/{R}\;}{{\partial P}/{P}\;}$; ${{\varepsilon }_{{{E}_{0}}}}=\frac{{\partial R}/{R}\;}{{\partial {{E}_{0}}}/{{{E}_{0}}}\;}$
Then, ΔQC can be expressed as follows:
$\Delta {{Q}_{C}}={{\varepsilon }_{P}}\frac{\Delta PQ}{P}+{{\varepsilon }_{{{E}_{0}}}}\frac{\Delta {{E}_{0}}Q}{{{E}_{0}}}$.
CC can also be calculated as follows:
${{C}_{C}}=\frac{\Delta {{Q}_{C}}}{\Delta Q}\times 100\%$.

3 Results

3.1 Changes in hydrological variables

The variations in runoff and precipitation in the upper reaches of the Yangtze River basin are shown in Figure 2. According to the curve direction, runoff and precipitation exhibited different trend changes. The runoff from SG and PS stations fluctuated, the overall trend increased, and the change rates were 672.60×10⁸ and 227.00×10⁸ m3/10a, respectively, of which the maximum annual runoff from the SG station was 542.00×10⁸ m3 in 1965 and the minimum value was 294.00×10⁸ m3 in 1994. The remaining stations showed a decreasing trend, with the rate shown in Table 1.
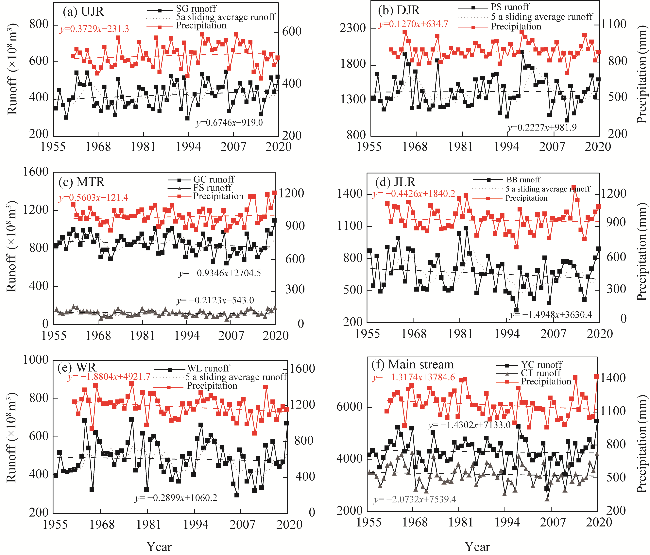
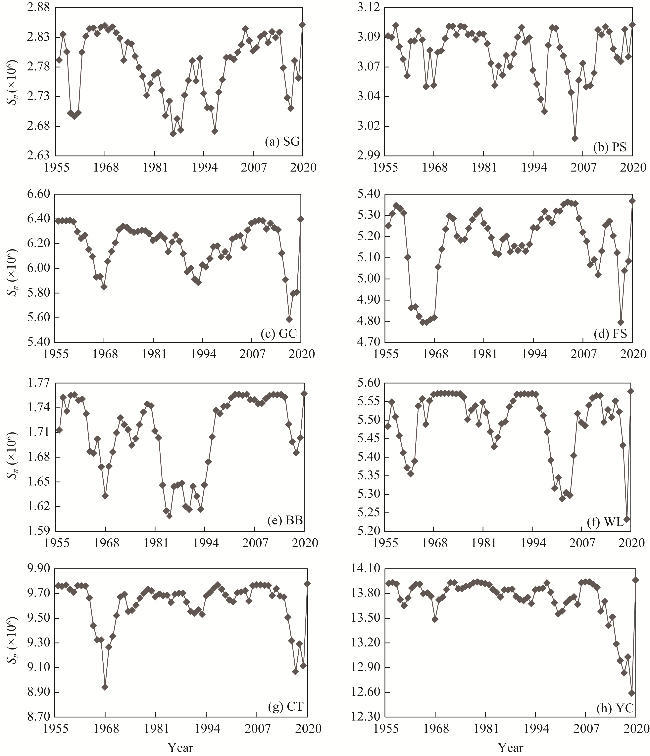
Fig. 2 Annual runoff trends of eight hydrological stations and surface precipitation in six sub-basins of the upper reaches of the Yangtze River basin. (a), UJR (upstream of the Jinsha River); (b), DJR (downstream of the Jinsha River); (c), MTR (Mintuo River); (d), JLR (Jialing River); (e), WR (Wujiang River); (f), main stream of the upper reaches of the Yangtze River basin. SG, Shigu; PS, Pingshan; GC, Gaochang; FS, Fushun; BB, Beibei; WL, Wulong; YC, Yichang; CT, Cuntan. The abbreviations are the same in the following figures.
Table 1 Mann-Kendall test results of runoff and precipitation
Station Location Area (km2) Runoff Precipitation
Rate |Z| Rate |Z|
SG UJR 215,840 0.675 1.551 0.375 1.148
PS DJR 256,328 0.223 0.724 0.123 0.498
GC MTR 135,378 -0.935 1.563 0.561 0.191
FS 19,613 -0.212 1.303
BB JLR 160,927 -1.495 1.313 -0.443 0.638
WL WR 87,731 -0.290 0.250 -1.880 2.347*
CT Main stream 100,837 -2.073 0.645 -1.317 1.887
YC -1.430 0.408

Note: SG, Shigu; PS, Pingshan; GC, Gaochang; FS, Fushun; BB, Beibei; WL, Wulong; YC, Yichang; CT, Cuntan; UJR, upstream of the Jinsha River; DJR, downstream of the Jinsha River; MTR, Mintuo River; JLR, Jialing River; WR, Wujiang River. The abbreviations are the same as in the following tables. |Z|, statistic factor value; *, P<0.05 level.

The MK test was used to determine the significance of trends further, and the values of |Z| statistic factor for each station are shown in Table 1. The significance level of the trend test is set as 0.05, that is, when |Z|=1.960, the trend of the series change is significant, passing a 95% significance test. The maximum test value (1.563) occurred at GC station, and it was less than 1.960 and failed to pass the significance test. The annual runoff of the remaining seven stations showed a non-significant trend. Among them, the runoff in UJR and DJR sub-basins exhibited a non-significant increasing trend, with a rate of 0.675 in the upstream area and 0.223 in the downstream area, while the rest of the sub-basins showed a non-significant decreasing trend too. For precipitation, the trends of surface precipitation in six sub-basins had different results; only WR exhibited a test value greater than 1.960, which passed the 95% significance test. Surface precipitation in the other five sub-basins shows a non-significant trend because they did not pass the trend test.
Cumulative anomaly curves indicating the changing characteristics of runoff at eight stations from 1956 to 2020 are shown in Figure 3. More than one inflection point appeared in the inter-annual variation of runoff in the upper reaches of the Yangtze River basin. The MK test and the ordered clustering method were employed to assess the results further. Taking the BB station as an example, images generated by the other two methods are shown in Figure 3b and c. The intersection point of two statistic series curves (UF and UB) within the range of the 0.05 significance level was the mutation point identified by the MK test; similarly, the ordered clustering method identified the mutation point based on a very small value. The runoff mutation points were examined using three separate methods; diagrams of the two remaining methods for the other seven stations are given in detail in Figures S1 and S2, and the results are summarized in Table 2.
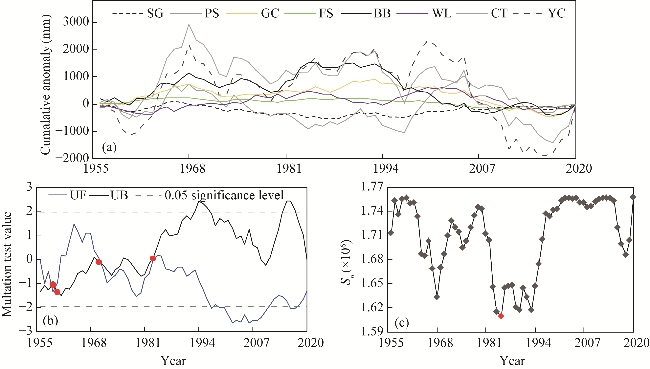
Fig. 3 Mutation test results of runoff. (a), cumulative anomalies of eight hydrological stations; (b), results of the Mann-Kendall test, the red points are intersection points of UF and UB (two statistic series curves); (c), ordered clustering method for the BB (Beibei) station, and the red point is the minimum Sn (total sum of squared deviation).
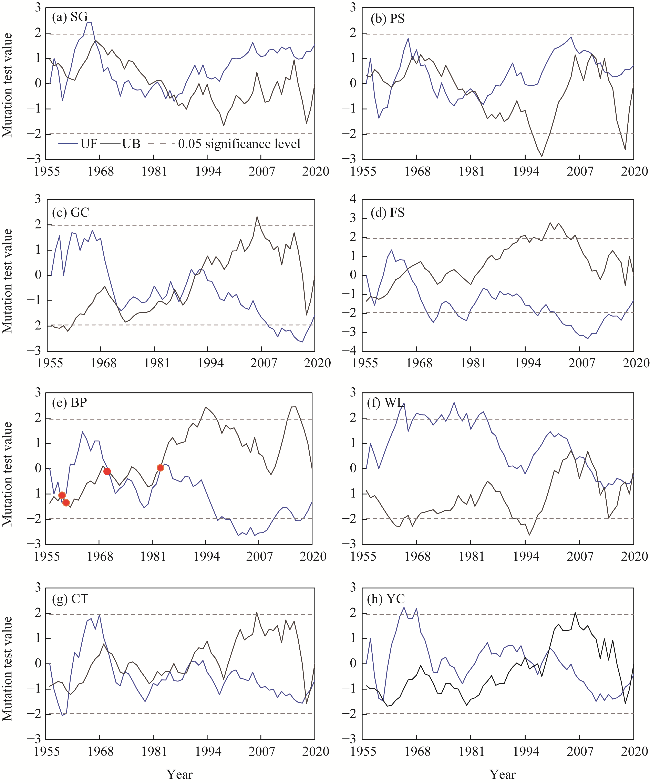
Fig. S1 Mann-Kendall mutation test results of runoff for eight hydrological stations. (a), SG (Shigu); (b), PS (Pingshan); (c), GC (Gaochang); (d), FS (Fushun); (e), BB (Beibei); (f), WL (Wulong); (g), CT (Cuntan); (h), YC (Yichang). The abbreviations are the same in the following figure.
Fig. S2 Runoff ordered clustering test results for eight hydrological stations. (a), SG; (b), PS;(c), GC; (d), FS; (e), BB; (f), WL; (g), CT; (h), YC. Sn is the total sum of squared deviation.
Table 2 Summary of the three mutation test methods
Station Cumulative anomaly method Mann-Kendall test Ordered clustering method
SG 1986#, 1997 1957, 1961, 1967, 1985# 1986#, 1988, 1997, 1960
PS 1997 1957, 1962, 1968, 1984#, 2012 2005, 1997, 1985#
GC 1993, 1968 1972, 1986#, 1992, 1993 2017, 1968
FS 1968 1959, 1966 1966, 2017
BB 1985# 1960, 1971, 1983# 1985#, 1990, 1993, 1968, 2018
WL 2002 2004, 2009, 2013, 2019 2019, 2002, 1985#, 1962
CT 1968, 2017 1957, 1961, 1969, 1986#, 1990, 2018 1968, 2017
YC 2000, 1968, 1993 1994, 1996, 2000, 2018 2019, 1968

Note: # represents the mutation point near 1985.

It is evident that SG, PS, GC, BB, WL, and CT stations had mutation points near 1985, among them, SG, PS, and BB stations showed mutation points identified by multiple methods, suggesting that 1985 could be considered as a significant mutation point. By considering factors such as the time length and the mutation sites identified by the three methods, and taking the comparability of results and process simplification into account, we ultimately identified the year 1985 as the mutation point of the entire upstream area.
The Morlet wavelet method was used to calculate the continuous one-dimensional complex wavelet transform for the 65-a dataset of measured annual runoff data at each hydrological station. The real part of the wavelet transform coefficients provides information about the distribution and phase of the signal over time at a specific time scale. Positive values in the graph indicate high runoff, corresponding to periods of abundant water, while negative values indicate low runoff, indicating dry periods.
The contour graphs of the real part of the wavelet coefficient of eight stations are shown in Figure 4. On the one hand, the runoff time series exhibited strong multi-timescale characteristics across all stations. In the first main period, spanning over a cycle of 55-56 a, SG, PS, WL, CT, and YC stations went through two transition periods of water abundance and dryness. On the other hand, GC, FS, and BB stations had a main period of 43-45 a, representing the most significant periodicity observed throughout the entire studied timeframe. For SG and PS stations, the second main period is 28 a, characterized by four alternating cycles of positive and negative signals within this specific timeframe. GC station exhibited the second main period of 57 a. FS and BB stations showed the second main period of 12-14 a, with a total of nine abundance-depletion transition periods occurring during this cycle. WL station experienced approximately three abundance-depletion transition periods within a cycle of 35 a. In CT and YC stations, the second main period ranged from 43 to 44 a, encompassing two abundance-depletion cycles. However, the second main cycle exhibited relatively weak periodicity, localized within specific regions. In annual runoff cycles shorter than 10 a, rapid changes occurred more often, characterized by a scattered distribution of extreme value points, which suggested that annual runoff at smaller scales fluctuated more frequently and displayed evident oscillation behavior.
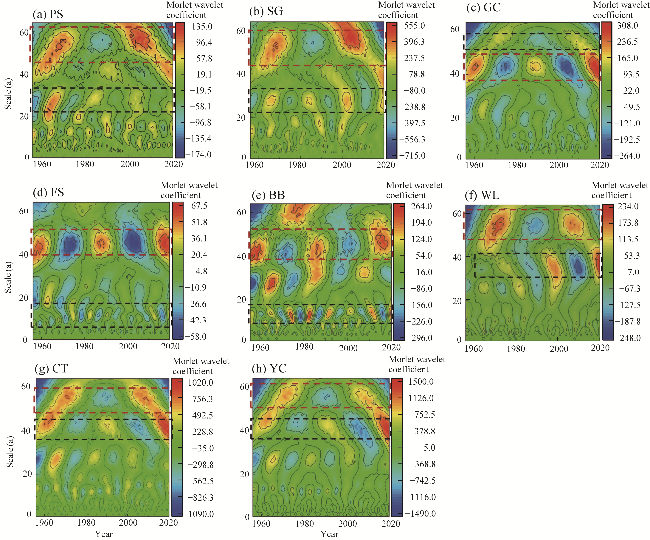
Fig. 4 Morlet wavelet coefficients of runoff of eight hydrological stations. (a), PS; (b), SG; (c), GC; (d), FS; (e), BB; (f), WL; (g), CT; (h), YC. Red dotted box shows the first main period, and black dotted box shows the second main period.
Wavelet variance analysis can also be utilized to analyze the periodic intensities. The wavelet variance curves and the wavelet coefficient curves of different main periods are illustrated in Figure 5. Significant peaks appeared in the wavelet variance of surface precipitation in each of the six sub-basins. The highest peak corresponded to the first main period, representing the periodic change in precipitation, while the next smaller peak aligned with the time scale of the second main period. Consequently, both runoff and precipitation exhibited similar multi-time scale characteristics with strong periodic features at larger time scales, confirming the significant influence of precipitation on runoff.
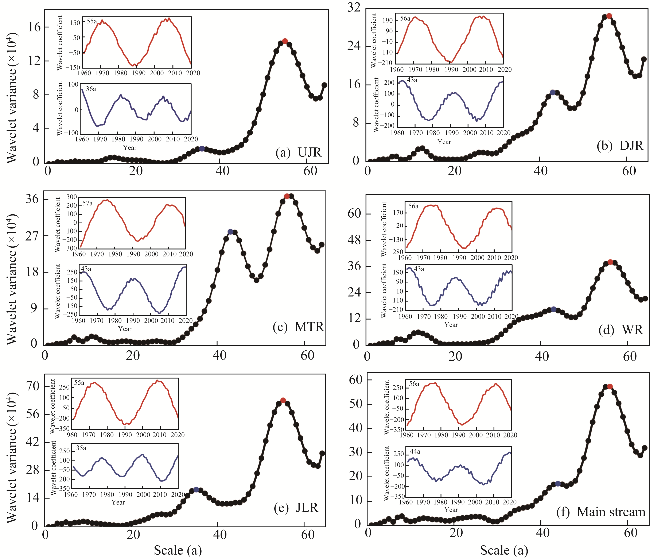
Fig. 5 Wavelet variance curves and wavelet coefficient curves of precipitation in different main periods of UJR (a), DJR (b), MTR (c), JLR (d), WR (e), and main stream (f) of the upper reaches the Yangtze River basin. Red line is the real part curve of the first main period, and blue line corresponds to the second main period.

3.2 Quantitative attribution of runoff variations

3.2.1 Rainfall-runoff relationship method

We categorized the precipitation and runoff series of the basin into a base period (1961-1985) and a changing period (1986-2020) according to the year of runoff mutation. The double mass curve showed the good agreement (Fig. 6). The correlation coefficient of R2 values was higher than 0.99, and there was no distinct transition point in the double mass curve, which agrees with the linear regression curve results.
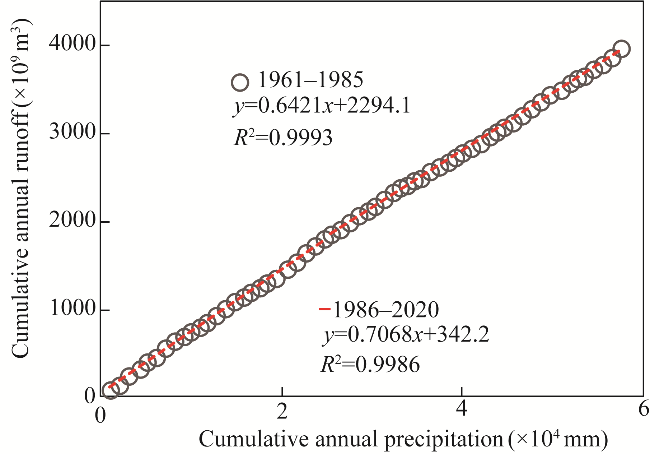
Fig. 6 Double mass curve between cumulative annual precipitation and annual runoff in JLR
Based on the accumulated rainfall-runoff relationship method, climate changes and human activities may either negatively or positively influence the total change in runoff. The relationships between precipitation and runoff are given in Table 3. Since the total contribution is normalized to 1, the sum of the contributions of climate changes and human disturbance must exceed 100.0% when they exert opposite effects. Therefore, the signs of the data listed in Table 3 only indicate the direction of the dominant factor. The results revealed varying contributions of precipitation to runoff in different sub-basins. In UJR and main stream, there were opposite contributions of climate changes and human activities. The contribution of climate changes was 111.6% for UJR and 213.9% for main stream. For DJR, JLR, and WR sub-basins, the contributions of climate change to runoff changes were 50.8%, 61.4%, and 70.0%, respectively. These values indicated that climate changes were the primary factors influencing runoff changes in these specific areas. In MTR, the contribution of climate influence was 45.6%. However, the main factor affecting runoff changes in this sub-basin was related to human activities.
Table 3 Contributions of climate factors and human activities to runoff
Sub-basin Period Measured value
(×108 m3)
Estimated value (×108 m3) Variation (×108 m3) Contribution (%)
Climate
factor
Human activity Climate factor Human activity
UJR 1961-1985 414.70 - - - - -
1986-2020 518.86 530.97 116.27 -12.11 111.60 -11.60
DJR 1961-1985 1409.50 - - - - -
1986-2020 1445.93 1427.90 18.49 17.95 50.80 49.30
MTR 1961-1985 996.20 - - - - -
1986-2020 943.40 972.10 -24.10 -28.70 45.60 54.40
JLR 1961-1985 722.00 - - - - -
1986-2020 614.84 656.23 -65.77 -41.38 61.40 38.60
WR 1961-1985 512.20 - - - - -
1986-2020 471.38 483.62 -28.58 -12.24 70.00 30.00
Main stream 1961-1985 4404.60 - - - - -
1986-2020 4240.43 4053.37 -351.23 187.06 213.90 -113.90

Note: - denotes a negative effect on the total change.

3.2.2 SCRCQ method

The rainfall-runoff relationship method typically focuses on rainfall as a climate factor and does not take into account the potential influence of evapotranspiration. However, by introducing the SCRCQ method, we considered both rainfall and evapotranspiration simultaneously. In cases where runoff variations in a watershed are affected only by changes in rainfall, the slope of the cumulative runoff-year relationship should be equal to that of the cumulative rainfall-year relationship. Irrespective of other factors influencing the system, the contribution of rainfall to runoff changes can be determined by calculating the change ratio of the cumulative rainfall slope to the cumulative runoff slope. Similarly, in this study, we divided the study periods into a reference period and a changing period using the year 1985 as the dividing point. The calculated slopes and change rates for both periods are shown in Table 4.
Table 4 Slopes in R (runoff), P (precipitation), and E (evaporation), and the results of SCRCQ (slope changing ratio of cumulative quantity)
Sub-basin RSR (%) RSP (%) RSE (%) CP (%) CE (%) CC (%) CH (%)
UJR 0.09 0.06 0.02 70.92 -17.08 53.84 46.16
DJR 0.05 0.02 -0.01 46.76 21.84 68.60 31.40
MTR -0.05 -0.01 0.01 15.64 21.73 37.37 62.63
JLR -0.14 -0.04 0.03 26.60 19.76 46.36 53.64
WR -0.09 -0.03 -0.00 38.20 -1.44 36.76 63.24
Main stream -0.03 -0.01 -0.01 32.78 -15.10 17.68 82.32

Note: RSR, RSP, and RSE are the change percentages of runoff, precipitation, and evaporation, respectively. CP and CE are the contributions of precipitation and evaporation to runoff, respectively. CC and CH are the contributions of climate changes and human activities to runoff, respectively.

As shown in Table 4, the six sub-basins showed varying slopes in terms of cumulative runoff, precipitation, and evaporation due to diverse hydro-meteorological and topographical conditions prevailing in the respective sub-basins. Among them, JLR exhibited the highest slope change in cumulative runoff of 0.14%. UJR had the highest slope change in cumulative precipitation, with a value of 0.06%, and evaporation also showed the highest change at JLR of 0.03%. When analyzing the contribution of climate changes to runoff, we found that the sub-basin DJR displayed the highest contribution rate (68.60%), indicating a substantial impact of climate changes on runoff, while the main stream showed the lowest contribution rate (17.68%).

3.2.3 Budyko hypothesis method

According to the Budyko water-energy balance theory, we divided the study period into the baseline period and changing period using the year 1985 as the dividing point. The contribution rates of climate variability and human disturbances to runoff changes were quantified, and the results are shown in Table 5.
Table 5 Parameter and result of Budyko hypothesis method
Sub-basin Aridity index εP εE ΔQc (m3) CC (%) CH (%)
Baseline period Changing period Baseline period Changing period Baseline period Changing period
UJR 1.99 1.70 0.14 0.20 -0.08 -0.11 8.58 42.08 57.92
DJR 1.12 1.06 0.47 0.51 -0.26 -0.28 24.43 67.11 32.89
MTR 0.79 0.83 0.79 0.74 -0.45 -0.42 -22.57 42.74 57.26
JLR 0.78 0.89 0.80 0.68 -0.46 -0.38 -41.16 38.40 61.60
WR 0.67 0.68 0.96 0.95 -0.56 -0.55 -14.65 35.91 64.09
Main stream 0.88 0.89 0.69 0.68 -0.39 -0.38 -69.16 25.67 74.33

Note: Aridity index can be calculated by E0/P. εP is the precipitation elasticity, εE is the potential evaporation elasticity, ΔQc is the amount of climate impacts on runoff; CC and CH are the contributions of climate changes and human activities to runoff, respectively.

The mean elasticity coefficients of runoff to precipitation and evapotranspiration are shown in Table 5, where εP had a positive value in all catchments and periods. The values ranged from 0.14 to 0.96, with an average of 0.64 in the baseline period and an average of 0.63 in the changing period. Moreover, both the baseline and the changing periods exhibited clear spatial variability in the precipitation elasticity coefficient. With an increasing trend in UJR and DJR and decreasing trends at the other sub-basins, εP was generally smaller than those of other sub-basins. The εE value is negative in all six sub-basins, showing the same spatial trend with εP. Table 5 also shows that human activities have a significant impact on the runoff variability in most sub-basins, except for DJR. Among them, the main stream exhibited the largest anthropogenic contribution, reaching up to 74.33%.
In Budyko hypothesis method, the parameter ω (plant-available water coefficient) is characterized by uncertainty. The ω value is related to soil and vegetation conditions, primarily reflecting the influence of surface characteristics on water balance. It is generally taken within the range of 1.0-3.0. In this study, ω was set to 2.0 for calculation, and sensitivity was tested within the range of 1.0-3.0. The results indicated that the contribution rates of climate changes were minimally affected by the selection of ω within this range (Fig. 7).
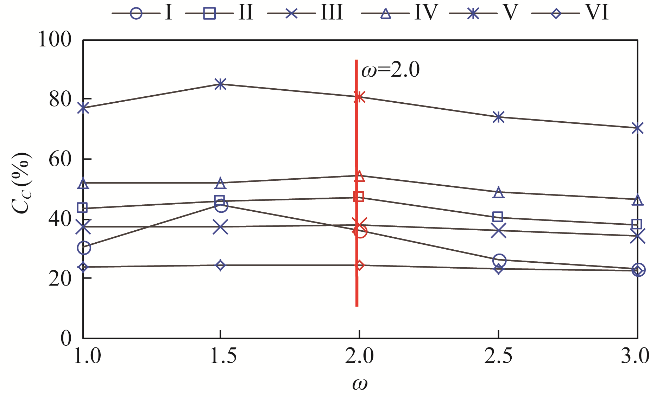
Fig. 7 Parameter sensitivity in Budyko hypothesis method of UJR (I), DJR (II), MTR (III), JLR (IV), WR (V), and main stream (VI) of the upper reaches of the Yangtze River basin. CC is the contribution of climate changes to runoff, and ω is the plant-available water coefficient.

3.2.4 Comparison among the three methods

Table 6 summarizes the results of the three methods. First, the observed discrepancy can be attributed to differences in calculation methods, since the precipitation-runoff relationship method normalizes the total contribution rate in the calculation process, summing up to 1. In cases where climate and anthropogenic contributions have opposite directions, it employs arithmetic averaging to represent the magnitude of changes. This can lead to situations where the absolute contribution exceeds 100.00%. Second, the latter two methods consider rainfall and evaporation as representative factors of climate changes, demonstrating higher reliability compared with the precipitation-runoff relationship method, which only considers precipitation as a factor. Therefore, only the results of the other two methods, which exhibit higher comparability and consistency, are considered in further comparative analysis. Comparing the results of the other two methods, which had high consistency of results, we found that the largest difference in results was only 11.76% in UJR, while the remaining sub-basins had a mean difference of only 4.60%.
Table 6 Summary of the results of the three methods
Sub-basin Precipitation-runoff relationship SCRCQ Budyko hypothesis method
CC (%) CH (%) CC (%) CH (%) CC (%) CH (%)
UJR 111.60 -11.60 53.84 46.16 42.08 57.92
DJR 50.80 49.30 68.12 31.88 67.11 32.89
MTR 45.60 54.40 37.37 62.63 42.74 57.26
JLR 61.40 38.60 46.36 53.64 38.40 61.60
WR 70.00 30.00 36.76 63.24 35.91 64.09
Main stream 213.90 113.90 17.68 82.32 25.67 74.33

Note: CC and CH are the contributions of climate and human activities to runoff, respectively. SCRCQ, slope changing ratio of cumulative quantity.

3.3 Adaptation and parameter sensitivity analysis

To assess the adaptability of the attribution methods, we extended the analysis from the mutation point in the year 1985 forward and backward to 1982-1988. The results of the attribution analysis of the seven change points were analyzed using slope variation method and Budyko hypothesis method to compare the relationship between the calculated results of the mutation point in 1985 and the rest of the points, and determine the adaptation of the two methods.
Figure 8 shows the contribution rates of climate change to runoff using slope variation method and Budyko hypothesis method. The contribution rate of climate change in 1985 fell in the range of results for the seven points, while the contribution rates of climate change of the seven points in the six sub-basins shown in Figure 8 were consistent. The slope variation method exhibited better adaptation than Budyko hypothesis method. Within the same basin among seven points, DJR exhibited the largest range of variation, still not exceeding 20%, while JLR and main stream varied only 3%-4%. However, compared with slope variation method, Budyko hypothesis method showed an anomaly in JLR, where the climate change contribution value in one of the seven years exceeded the normal range of variation. The basin's CC normally fluctuated between 32% and 38% during 1983-1990, while the contribution rate in 1982 was lower (23%). These findings were related to the larger ΔE0 due to the change in potential evapotranspiration. The CC value in the remaining sub-basins varied mostly in WR over the 7 a, reaching 17%, and UJR had the smallest variation range (<6%).
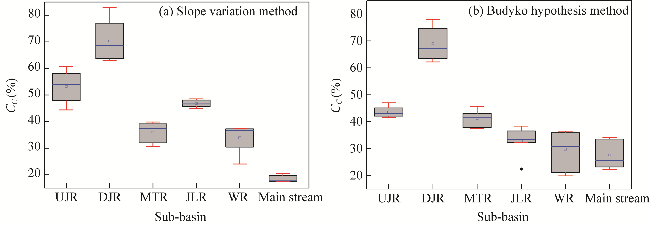
Fig. 8 Boxplot graph of adaptation of slope variation method (a) and Budyko hypothesis method (b). CC is the contribution of climate factors to runoff. Boxes indicate the IQR (interquartile range, 75th to 25th of the data). The median value is shown as a line within the box; square is shown as mean; and black diamond is outlier. Whiskers extend to the most extreme value within 1.5×IQR.

4 Discussion

In the second half of the 20th century, around one-third of among 137 globally representative rivers with basin areas ranging from 0.03×10⁸ to 6.30×10⁸ km2 experienced annual runoff changes exceeding 30% (Milliman et al., 2008; He et al., 2019b), and many of these mid-latitude rivers underwent a decrease in annual runoff by even 60%. While, as for the dominant factor on runoff change, human activities including dam construction, land use changes, social development, irrigation, and inter-basin water transfers, have been confirmed to be the primary factors in the Yellow River and its tributaries (Wang et al., 2012), the Zhujiang River (Wu et al., 2012), and the Huaihe River (Liu and Xia, 2013).

4.1 Impact of climate changes

Previous studies have shown that global warming-related intensification of the hydrological cycle affects runoff by increasing evapotranspiration (Chien et al., 2013; Wang et al., 2016). We found that precipitation and runoff in the study area exhibited parallel trends and cyclical changes, indicating a strong positive correlation. Taking JLR as an example, we analyzed the runoff from BB station and the surface precipitation in JLR (Fig. 9). Precipitation and runoff regression curve showed a good linear relationship, and R2 of baseline period was smaller than that of changing period, and the correlation between precipitation and runoff was reduced by human activities. Further details regarding the correlation at the other five sub-basins are given in Figure S3.
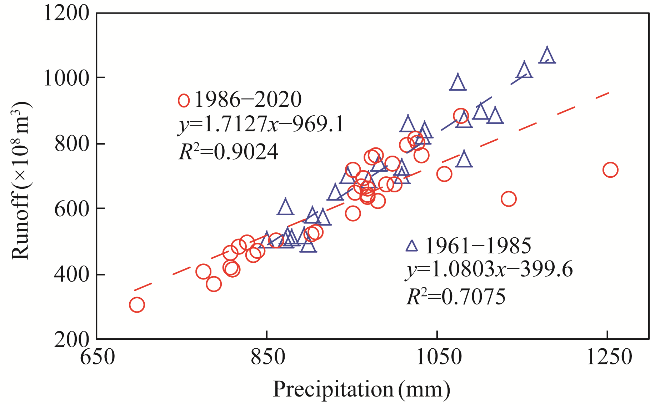
Fig. 9 Relationship between precipitation and runoff in different periods. 1961-1985, baseline period; 1886-2020, changing period.
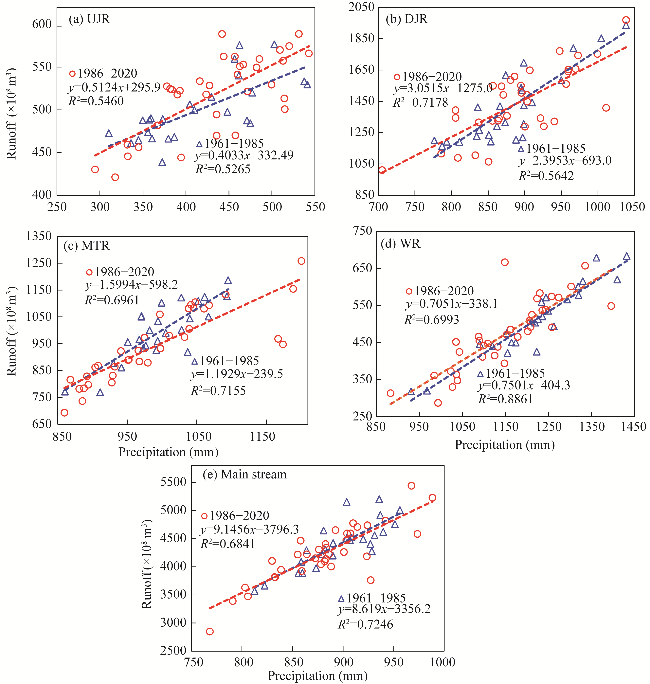
Fig. S3 Relationship between precipitation and runoff in different periods for five sub-basins. (a), UJR (upstream of the Jinsha River); (b), DJR (downstream of the Jinsha River); (c), MTR (Mintuo River); (d), WR, Wujiang River; (e), main stream of the upper reaches of the Yangtze River basin. 1961-1985, baseline period; 1886-2020, changing period.

4.2 Impact of hydraulic engineering

In addition, our studies implied that large-scale water projects played an important role in runoff redistribution, as confirmed in previous study (Zhang et al., 2021). Chinese government implemented a series of comprehensive water conservancy hubs with good regulation capacity and large reservoir capacity based on the joint operation of reservoir groups in the upper reaches of the Yangtze River basin (Xu et al., 2017), including the Jinsha River middle reaches reservoir group consisting of six reservoirs, the Jinsha River downstream reservoir group, the Yalong River reservoir group, the Minhe River reservoir group, the Jialing River reservoir group, the Wujiang River reservoir group, and the mainstream Three Gorges-Gezhouba cascade reservoir group. The total regulation capacity reaches 110.0×10⁹ m3. Furthermore, about 34.0×10³ km of dikes and more than 40 flood storage areas with a capacity of around 62.7×10⁹ m3 also interact with reservoirs to influence runoff. About 96 large-scale reservoirs existed by the end of 2020, including the Three Gorges-Gezhouba in the upper reaches of the Yangtze River basin, and the Liyuan, Xiluodu, and Xiangjiaba dams on the Jinsha River, with a total water storage capacity of 128.0×10⁹ m3. The reservoirs in JSR have a storage capacity of 648.0×10⁸ m3, the Three Gorges reservoir has a storage capacity of 393.0×10⁸ m3, and the group of reservoirs in WR has a storage capacity of 111.0×10⁸ m3. Compared with the year 2000, the number of large reservoirs increased by 78.0%, and the significant increase in the proportion of human activities during this period was closely related to the substantial completion of water projects.

4.3 Impact of land use condition

The land use condition affecting the hydrological and sedimentary changes in the basin by influencing vegetation greening and subsurface texture (Zeng et al., 2016; Mankin et al., 2019). For example, the reduction of farmland and the expansion of urban land decreasing soil precipitation infiltration rate and increasing runoff (Wang et al., 2023b). The expansion of water body can decrease runoff by enhancing evaporation. Also, the larger canopy area of forest land strongly enhances the ability of precipitation interception (Raz-Yaseef et al., 2010; Yu et al., 2022). Based on remote sensing monitoring data on the land use status, researchers constructed the land use transfer diagram. The increase in construction land was mainly transferred from farmland and forest land, with a significant rise of 231.6%. Also, a 15.8% decrease in unused land appeared, mainly shifting toward water body and grassland. These data are consistent with Wang et al. (2013b), who found that the Yangtze River basin has experienced a rapid urbanization process characterized by farmland reduction and urban land expansion.

4.4 Impact of socio-economic factors

Since the mid-20th century, the Yangtze River, as one of the Chinese crucial economic belts, experienced robust economic development and a rapid increase in population. The gross domestic product and population in the main provinces of the upper reaches of the Yangtze River exhibited strong upward trends, which had significantly increased water consumption for industrial, agricultural, and domestic purposes, further reducing the area of runoff (Wang et al., 2013b). Moreover, a land reform happened around 1980, farmers were encouraged to manage their lands, and water demand for agriculture irrigation was increased (Yang and Tian, 2009). According to the Bulletin of Water Resources in China, water consumption for the Yangtze River was 1737.1×108 m³in 1997 and increased up to 1957.6×108 m³in 2020.

4.5 Summary of change in sub-basins

The Jinsha River exhibits significant variations in topography, background conditions, and other characteristics that differ between UJR and DJR (Feng et al., 2017; Liu et al., 2017). Taken as a whole, climate changes and human activities influences varied around 50.0% throughout the Jinsha River. Also, Zhang et al. (2019) considered that climate changes explained 56.3% of the reduction in runoff, which the same conclusion that the runoff influence from climate and human activities were considered to be evenly matched (each was around 50.0%). MTR is the most important water system in Sichuan Province, and the Minjiang River basin covers multiple cities, representing a population and industrial agglomeration area (Zhou et al., 2008; Tang et al., 2013). However, a significant portion of the basin lies in a water-deficient region and the water shortage is addressed by water diversion from the Minjiang River. Such human activities affect runoff to a great extent, being the primary influencing factor for the runoff change, accounting for 60.0% based on our findings, which is consistent with Guo et al. (2022), being a 69.0% proportion based on Budyko hypothesis method. According to our results, the main influencing factor of runoff variability in JLR is human activities, with a contribution rate of around 50.0%-60.0%, which is due to the variety of areas interlaced with mountainous terrain and basins (Zeng et al., 2015; Shao et al., 2021), and the large scale of the hydraulic engineering with a total storage capacity of 78.0×10⁸ m3. WR sub-basin is located in a typical karst mountainous region with a dense population and abundant land resources (Wang et al., 2023a), with 11 levels of multi-level hydropower schemes ready to be implemented (Fu et al., 2023). There are more than 120 constructed or constructing hydroelectric stations, with capacities exceeding 500 kW. These extensive human activities contribute to approximately 63.0% of the runoff variability in the basin. The mainstream of the upper reaches of the Yangtze River basin is the most economically developed and densely populated region (Zhang et al., 2006; Xiao et al., 2018), with the primary human activities contributing to over 70.0% of the runoff variability, making it the most significant factor influencing the basin's runoff changes. Our results are consistent with the runoff change attribution results obtained in the study of Zhai and Tao (2017).

4.6 Uncertainty analysis

The amount of data is relatively limited due to the data from hydrological stations at the outlet of each sub-basin, which may not be sufficiently precise to represent the situation in the entire river basin. Additionally, our study treated climate changes and human activities as two independent variables for attribution analysis, while they cannot be completely separated and may influence each other. Interactions between human activities and climate changes are complex and challenging to determine, so further research is needed for their accurate quantification.

5 Conclusions

In this paper, we characterized the long-term runoff sequences at major stations in the upper reaches of the Yangtze River basin, China. The runoff showed a non-significant decreasing trend in other stations except for a slight increase in PS and SG stations of the Jinsha River. The abrupt change occurred in 1985. When comparing the results of runoff attribution using the precipitation-runoff relationship method, slope change method, and Budyko hypothesis method, it was found that the latter two methods exhibited a high degree of consistency and passed the adaptability test. Except that JSR showed a different result with a proportion of basically 50.0% each for climatic factors and human activities. Human activities in MTR, JLR, WR, and main stream sub-basins accounted for from 53.0% to 82.0% of the impact on runoff and were the main factors driving runoff change. The contribution of climate changes ranged from 17.0% to 46.0%, making them the secondary factor. Finally, climate and various human activities have diverse effects under different conditions. Managing according to the characteristics of each sub-basin ensures the sustainable use of water resources in the Yangtze River basin, facilitating better realization of complementary feedback among the water resources of sub-basins and providing a foundation for exploring differentiated water management strategies at the sub-regional scale.

Conflict of interest

The authors declare that they have no known competing financial interests or personal relationships that could have appeared to influence the work reported in this paper.

Acknowledgements

This research was supported by the National Natural Science Foundation of China (52009140).

Author contributions

Conceptualization: WANG Xingbo; Methodology: WANG Xingbo; Formal analysis: WANG Xingbo; Writing - original draft preparation: WANG Xingbo; Writing - review and editing: WANG Xingbo; Supervision: ZHANG Shuanghu, TIAN Yiman. All authors approved the manuscript.
[1]
Bao Z X, Zhang J Y, Wang G Q, et al. 2012. Attribution for decreasing streamflow of the Haihe River basin, northern China: Climate variability or human activities? Journal of Hydrology, 460-461: 117-129.

[2]
Cao H C, Yan D D, Ju Y L. 2021. Drought and flood characteristics in the farming-pastoral ecotone of northern China based on the standardized precipitation index. Journal of Arid Land, 13(12): 1244-1259.

[3]
Chien H C, Yeh P J F, Knouft J H. 2013. Modeling the potential impacts of climate change on streamflow in agricultural watersheds of the Midwestern United States. Journal of Hydrology, 491: 73-88.

[4]
Du J, He F, Zhang Z, et al. 2011. Precipitation change and human impacts on hydrologic variables in Zhengshui River Basin, China. Stochastic Environmental Research and Risk Assessment, 25: 1013-1025.

[5]
Feng A Q, Li Y Z, Gao J B, et al. 2017. The determinants of streamflow variability and variation in Three-River Source of China: Climate change or ecological restoration? Environmental Earth Sciences, 76(20): 696, doi: 10.1007/s12665-017-7026-6.

[6]
Francisco F, Malheiro A, Chaminé H I. 2022. Natural hazards and hydrological risks: Climate change-water-sustainable society nexus. SN Applied Sciences, 5: 36, doi: 10.1007/S42452-022-05214-6.

[7]
Fu J J, Wang W, Hunter P D, et al. 2023. Trends in normalized difference vegetation index time series in differently regulated cascade reservoirs in Wujiang Catchment, China . Ecological Indicators, 146: 109831, doi: 10.1016/j.ecolind.2022.109831.

[8]
Guo W X, Zhou H T, Zhang L, et al. 2022. Analysis of runoff changes and causes in Minjiang River basin. Water Resources and Power, 40(4): 32-36. (in Chinese)

[9]
He G H, Zhao Y, Wang J H, et al. 2019a. Attribution analysis based on Budyko hypothesis for land evapotranspiration change in the Loess Plateau, China. Journal of Arid Land, 11(6): 939-953.

[10]
He Y, Jiang X, Wang N, et al. 2019b. Changes in mountainous runoff in three inland river basins in the arid Hexi Corridor, China, and its influencing factors. Sustainable Cities and Society, 50: 101703, doi: 10.1016/j.scs.2019.101703.

[11]
Hiwasaki L, Luna E, Syamsidik, et al. 2014. Process for integrating local and indigenous knowledge with science for hydro-meteorological disaster risk reduction and climate change adaptation in coastal and small island communities. International Journal of Disaster Risk Reduction, 10: 15-27.

[12]
Hu C H, Zhang S H. 2022. Research on water security and ecological restoration strategy of the Yangtze River Economic Belt. China Engineering Science, 24(1): 166-175. (in Chinese)

[13]
Hu J F, Zhao G J, Mu X M, et al. 2019. Quantifying the impacts of human activities on runoff and sediment load changes in a Loess Plateau catchment. China Journal of Soils and Sediments, 19(11): 3866-3880. (in Chinese)

[14]
Kong D X, Miao C Y, Wu J W, et al. 2016. Impact assessment of climate change and human activities on net runoff in the Yellow River Basin from 1951 to 2012. Ecological Engineering, 91: 566-573.

[15]
Li L J, Zhang L, Wang H, et al. 2007. Assessing the impact of climate variability and human activities on streamflow from the Wuding River basin in China. Hydrological Processes, 21: 3485-3491.

[16]
Li Z W, Xu X L, Yu B F, et al. 2016. Quantifying the impacts of climate and human activities on water and sediment discharge in a karst region of Southwest China. Journal of Hydrology, 542: 836-849.

[17]
Liu J J, Chen J, Xu Y, et al. 2019. Attribution of runoff variation in the headwaters of the Yangtze River based on the Budyko hypothesis. International Journal of Environmental Research and Public Health, 16(14): 2506, doi: 10.3390/ijerph16142506.

[18]
Liu L L, Du J J. 2017. Documented changes in annual runoff and attribution since the 1950s within selected rivers in China. Advances in Climate Change Research, 8(1): 37-47.

[19]
Liu R, Xia J. 2013. Influence analysis of climate change and human activities on runoff of the upper Huaihe River. Yellow River, 35(9): 30-33. (in Chinese)

[20]
Liu X W, Peng D Z, Xu Z X. 2017. Identification of the impacts of climate changes and human activities on runoff in the Jinsha River Basin, China. Advances in Meteorology, 2017: 4631831, doi: 10.1155/2017/4631831.

[21]
Mankin J S, Seager R, Smerdon J E, et al. 2019. Mid-latitude freshwater availability reduced by projected vegetation responses to climate change. Nature Geoscience, 12: 983-988.

[22]
Millan M M. 2014. Extreme hydro meteorological events and climate change predictions in Europe. Journal of Hydrology, 518: 206-224.

[23]
Milliman J D, Farnsworth K L, Jones P D, et al. 2008. Climatic and anthropogenic factors affecting river discharge to the global ocean, 1951-2000. Global and Planetary Change, 62(3-4): 187-194.

[24]
Peng T, Tian H, Qin Z X, et al. 2018. Study on the impacts of climate change and human activities on runoff sediment in the Yangtze River. Sediment Research, 43(6): 54-60. (in Chinese)

[25]
Pirnia A, Golshan M, Darabi H, et al. 2019. Using the Mann-Kendall test and double mass curve method to explore stream flow changes in response to climate and human activities. Journal of Water and Climate Change, 10(4): 725-742.

[26]
Poschlod B, Zscheischler J, Sillmann J, et al. 2020. Climate change effects on hydrometeorological compound events over southern Norway. Weather and Climate Extremes, 28: 100253, doi: 10.1016/j.wace.2020.100253.

[27]
Qian K Z, Wan L, Wang X S, et al. 2012. Periodical characteristics of baseflow in the source region of the Yangtze River. Journal of Arid Land, 4(2): 113-122.

[28]
Qin P C, Liu M, Du L M, et al. 2019. Predicted impacts of climate change on runoff in the upper reaches of the Yangtze River. Progress in Climate Change Research, 15(4): 405-415. (in Chinese)

[29]
Raz-Yaseef N, Rotenberg E, Yakir D. 2010. Effects of spatial variations in soil evaporation caused by tree shading on water flux partitioning in a semi-arid pine forest. Agricultural and Forest Meteorology, 150(3): 454-462.

[30]
Setti S R, Maheswaran D, Radha V, et al. 2020. Attribution of hydrologic changes in a tropical river basin to rainfall variability and land-use change: Case study from India. Journal of Hydrologic Engineering, 25(8): 0001937, doi: 10.1061/(ASCE)HE.1943-5584.0001937.

[31]
Shao Y T, He Y, Mu X M, et al. 2021. Contributions of climate change and human activities to runoff and sediment discharge reductions in the Jialing River, a main tributary of the upper Yangtze River, China. Theoretical and Applied Climatology, 145(3-4): 1437-1450.

[32]
Sheng Q. 2006. Changes of evaporation from evaporation dishes in China over the past 45 a and analysis of the causes. MSc Thesis. Nanjing: Nanjing University of Information Science and Technology. (in Chinese)

[33]
Tang Q, He X B, Bao Y H, et al. 2013. Determining the relative contributions of climate change and multiple human activities to variations of sediment regime in the Minjiang River, China. Hydrological Processes, 27(25): 3547-3559.

[34]
Wang G Q, Zhang J Y, Pagano T C, et al. 2016. Simulating the hydrological responses to climate change of the Xiang River basin, China. Theoretical and Applied Climatology, 124(3-4): 769-779.

[35]
Wang H W, Qi Y, Lian X H, et al. 2022. Effects of climate change and land use/cover change on the volume of the Qinghai Lake in China. Journal of Arid Land, 14(3): 245-261.

[36]
Wang J C, Peng T, Xiang Y H, et al. 2023a. Analysis of the characteristics of uneven spatio-temporal distribution in Wujiang River basin over the last 60 years. Atmosphere, 14(9): 1356, doi: org/10.3390/atmos14091356.

[37]
Wang J F, Li Y W, Wang S, et al. 2023b. Determining relative contributions of climate change and multiple human activities to runoff and sediment reduction in the eastern Loess Plateau, China. Catena, 232: 107376, doi: 10.1016/j.catena.2023.107376.

[38]
Wang S, Yan M, Yan Y, et al. 2012. Contributions of climate change and human activities to the changes in runoff increment in different sections of the Yellow River. Quaternary International, 282: 66-77.

[39]
Wang W G, Shao Q X, Yang T, et al. 2013a. Quantitative assessment of the impact of climate variability and human activities on runoff changes: A case study in four catchments of the Haihe River basin, China. Hydrological Processes, 27(8): 1158-1174.

[40]
Wang Y, Ding Y J, Ye B S, et al. 2013b. Contributions of climate and human activities to changes in runoff of the Yellow and Yangtze rivers from 1950 to 2008. Science China (Earth Sciences), 56(8): 1398-1412.

[41]
Wu C S, Yang S L, Lei Y P, 2012. Quantifying the anthropogenic and climatic impacts on water discharge and sediment load in the Pearl River (Zhujiang), China (1954-2009). Journal of Hydrology, 452-453: 190-204.

[42]
Wu C X, Xu R R, Qiu D X, et al. 2022. Runoff characteristics and its sensitivity to climate factors in the Weihe River Basin from 2006 to 2018. Journal of Arid Land, 14(12): 1344-1360.

[43]
Wu L H, Wang S J, Bai X Y, et al. 2017. Quantitative assessment of the impacts of climate change and human activities on runoff change in a typical karst watershed, SW China. Science of the Total Environment, 601: 1449-1465.

[44]
Xiao Z W, Shi P, Jiang P, et al. 2018. The spatiotemporal variations of runoff in the Yangtze River basin under climate change. Advances in Meteorology, 2018: 5903451, doi: 10.1155/2018/5903451.

[45]
Xu X Y, Yang D W, Yang H B, et al. 2014. Attribution analysis based on the Budyko hypothesis for detecting the dominant cause of runoff decline in Haihe basin. Journal of Hydrology, 510: 530-540.

[46]
Xu S, Zhang Y Y, Dou M, et al. 2017. Characteristics of spatial and temporal land use changes in the Yangtze River Basin and its runoff effects. Progress in Geography, 36(4): 426-436.

[47]
Xue F, Zhang X P, Zhang L, et al. 2022. Identification of water-sand change attribution based on Budyko's hypothesis and fractal theory-A case study of Beiluo River Basin. Journal of Geography, 77(1): 79-92. (in Chinese)

[48]
Yang Y H, Tian F. 2009. Abrupt change of runoff and its major driving factors in Haihe River Catchment, China. Journal of Hydrology, 374(3-4): 373-383.

[49]
Yazdandoost F, Morandian S. 2021. Climate change impacts on the streamflow of Zarrineh River, Iran. Journal of Arid Land, 13(9): 891-904.

[50]
Ye X C, Zhang Q, Liu J, et al. 2013. Distinguishing the relative impacts of climate change and human activities on variation of streamflow in the Poyang Lake catchment, China. Journal of Hydrology, 494(6): 83-95.

[51]
Yu Y B, Tang G P, Niu X Y, et al. 2022. Effect of land use and climate change on runoff in Liuxi River reservoir basin. Soil and Water Conservation Research, 30(6): 32-39, 48. (in Chinese)

[52]
Yuan Z, Yan D H, Yang Z Y, et al. 2018. Attribution assessment and projection of natural runoff change in the Yellow River Basin of China. Mitigation and Adaptation Strategies for Global Change, 23(1): 27-49.

[53]
Zeng X F, Zhao N, Sun H W, et al. 2015. Changes and relationships of climatic and hydrological droughts in the Jialing River Basin, China. PloS ONE, 10(11): e0141648, doi: 10.1371/journal.pone.0141648.

[54]
Zeng Z Z, Zhu Z C, Lian X, et al. 2016. Responses of land evapotranspiration to Earth's greening in CMIP 5 Earth System Models. Environmental Research Letters, 11(10): 104006, doi: 10.1088/1748-9326/11/10/104006.

[55]
Zhai R, Tao F L. 2017. Contributions of climate change and human activities to runoff change in seven typical catchments across China. Science of the Total Environment, 605(12): 219-229.

[56]
Zhang B Q, He C S. 2016. A modified water demand estimation method for drought identification over arid and semiarid regions. Agricultural and Forest Meteorology, 230-231: 58-66.

[57]
Zhang J, Zhang Y, Feng Y, et al. 2021. Impact and prospects of water conservation on fish habitat and advances of ecobiology operation in Yangtze River, China: A review. Journal of Environmental Biology, 42(5): 1201-1212.

[58]
Zhang L, Dawes W R, Walker G R. 2001. Response of mean annual evapotranspiration to vegetation changes at catchment scale. Water Resources Research, 37(3): 701-708.

[59]
Zhang P P, Cai Y P, Xie Y L, et al. 2022. Effects of a cascade reservoir system on runoff and sediment yields in a river basin of southwestern China. Ecological Engineering, 179: 106616, doi: 10.1016/j.ecoleng.2022.106616.

[60]
Zhang Q, Xu C Y, Becker S, et al. 2006. Sediment and runoff changes in the Yangtze River basin during past 50 years. Journal of Hydrology, 331(3-4): 511-523.

[61]
Zhang X F, Yan H C, Yue Y, et al. 2019. Quantifying natural and anthropogenic impacts on runoff and sediment load: An investigation on the middle and lower reaches of the Jinsha River Basin. Journal of Hydrology, 25: 100617, doi: 10.1016/j.ejrh.2019.100617.

[62]
Zhao X, Huang G. 2022. Exploring the impact of landscape changes on runoff under climate change and urban development: Implications for landscape ecological engineering in the Yangmei River Basin. Ecological Engineering, 184: 106794, doi: 10.1016/j.ecoleng.2022.106794.

[63]
Zhou P, Luukkanen O, Tokola T, et al. 2008. Vegetation dynamics and forest landscape restoration in the Upper Min River watershed, Sichuan, China. Restoration Ecology, 16(2): 348-358.

文章导航

/