• Mohamed K EL-GHANNAM 1 ,
  • Fatma WASSAR , 2, 3, * ,
  • Sabah MORSY 4 ,
  • Mohamed HAFEZ 5 ,
  • Chiter M PARIHAR 6 ,
  • Kent O BURKEY 7 ,
  • Ahmed M ABDALLAH , 8, *
展开

收稿日期: 2022-06-05

  修回日期: 2022-09-13

  录用日期: 2022-10-01

  网络出版日期: 2023-04-30

Controlled drainage in the Nile River delta of Egypt: a promising approach for decreasing drainage off-site effects and enhancing yield and water use efficiency of wheat

  • Mohamed K EL-GHANNAM 1 ,
  • Fatma WASSAR , 2, 3, * ,
  • Sabah MORSY 4 ,
  • Mohamed HAFEZ 5 ,
  • Chiter M PARIHAR 6 ,
  • Kent O BURKEY 7 ,
  • Ahmed M ABDALLAH , 8, *
Expand
  • 1Soil, Water and Environment Research Institute, Agricultural Research Center, Giza 12112, Egypt
  • 2Higher Institute of Water Sciences and Techniques of Gabès, University of Gabès, Gabès 6072, Tunisia
  • 3Institute of Arid Regions, Medenine 4119, Tunisia
  • 4Crop Science Department, Faculty of Agriculture, Damanhour University, Damanhour 22516, Egypt
  • 5Land and Water Technologies Department, Arid Lands Cultivation Research Institute, City of Scientific Research and Technological Applications, New Borg El-Arab 21934, Egypt
  • 6Indian Council of Agricultural Research (ICAR)-Indian Agricultural Research Institute (IARI), New Delhi 110012, India
  • 7United States Department of Agriculture (USDA)-Agricultural Research Services (ARS), Plant Science Research Unit, North Carolina 27607, USA
  • 8Natural Resources and Agricultural Engineering Department, Faculty of Agriculture, Damanhour University, Damanhour 22516, Egypt
*Fatma WASSAR (E-mail: );
Ahmed M ABDALLAH (E-mail: )

Received date: 2022-06-05

  Revised date: 2022-09-13

  Accepted date: 2022-10-01

  Online published: 2023-04-30

本文引用格式

Mohamed K EL-GHANNAM , Fatma WASSAR , Sabah MORSY , Mohamed HAFEZ , Chiter M PARIHAR , Kent O BURKEY , Ahmed M ABDALLAH . [J]. Journal of Arid Land, 2023 , 15(4) : 460 -476 . DOI: 10.1007/s40333-023-0095-3

Abstract

North Africa is one of the most regions impacted by water shortage. The implementation of controlled drainage (CD) in the northern Nile River delta of Egypt is one strategy to decrease irrigation, thus alleviating the negative impact of water shortage. This study investigated the impacts of CD at different levels on drainage outflow, water table level, nitrate loss, grain yield, and water use efficiency (WUE) of various wheat cultivars. Two levels of CD, i.e., 0.4 m below the soil surface (CD-0.4) and 0.8 m below the soil surface (CD-0.8), were compared with subsurface free drainage (SFD) at 1.2 m below the soil surface (SFD-1.2). Under each drainage treatment, four wheat cultivars were grown for two growing seasons (November 2018-April 2019 and November 2019-April 2020). Compared with SFD-1.2, CD-0.4 and CD-0.8 decreased irrigation water by 42.0% and 19.9%, drainage outflow by 40.3% and 27.3%, and nitrate loss by 35.3% and 20.8%, respectively. Under CD treatments, plants absorbed a significant portion of their evapotranspiration from shallow groundwater (22.0% and 8.0% for CD-0.4 and CD-0.8, respectively). All wheat cultivars positively responded to CD treatments, and the highest grain yield and straw yield were obtained under CD-0.4 treatment. Using the initial soil salinity as a reference, the soil salinity under CD-0.4 treatment increased two-fold by the end of the second growing season without negative impacts on wheat yield. Modifying the drainage system by raising the outlet elevation and considering shallow groundwater contribution to crop evapotranspiration promoted water-saving and WUE. Different responses could be obtained based on the different plant tolerance to salinity and water stress, crop characteristics, and growth stage. Site-specific soil salinity management practices will be required to avoid soil salinization due to the adoption of long-term shallow groundwater in Egypt and other similar agroecosystems.

1 Introduction

Countries in Middle East and North Africa (MENA countries) are characterized by their hot-dry climate with an average annual rainfall below 300 mm (Radhouane, 2013). The resulting acute water shortage limits crop growth and production as a function of water availability (Abdallah et al., 2018). The problem of water shortage in MENA countries is expected to increase due to climate change and rapid population growth (Hamed et al., 2018). The predicted increase in rainfall variability and air temperature is expected to increase crop evapotranspiration and result in more frequent drought events (Zekry et al., 2020, 2022; Abdallah et al., 2021). Under such conditions, attaining food sufficiently is a daunting task. Despite this situation, over-irrigation and free drainage dominate agricultural production in many regions of MENA countries, such as the Nile River delta of Egypt, leading to over-drainage (El-Ghannam et al., 2021). Excessive drainage results in inefficient use of water and fertilizers as well as adverse socio-economic and environmental effects (Campus, 2019; Sojka et al., 2019).
Controlled drainage (CD) was found to be a promising tool that could decrease the amount of drainage water, maintain crop yield, and reduce drainage off-site effects, i.e., nitrate and phosphorus (P) outflow to the surface water and groundwater (Ayars et al., 2006a; Ritzema 2016; Javani et al., 2018; Sojka et al., 2019; Li et al., 2021). CD is a tool to manage the water table by maintaining water at the desired depth, assuring sufficient aeration and watering of the root zone (Lavaire et al., 2017). In CD system, the water table is elevated to a particular depth, either by the shallower placement of drains or by blocking the drains at the required depth. Therefore, CD has the potential to decrease drainage outflow and increase upward water flow by capillary action, thus substituting the depleted soil moisture with evapotranspiration (Lu et al., 2016). In this way, CD increases water availability during dry periods, thereby lessening the negative impact of water shortage stress on rainfed agriculture and limiting water use in irrigated agriculture (Skaggs et al., 2012). The adoption of CD was found to decrease drained water volumes by 16%-85% (Skaggs et al., 2010, 2012) and decrease nitrogen (N) and P transport by 18%-75% and 35%-45%, respectively (Helmers et al., 2012; Lavaire et al., 2017; Craft et al., 2018; Liu et al., 2019). Such reduction in drainage outflow and transport of nutrients has been shown not only to decrease drainage off-site impacts but also to enhance crop yields and the use efficiencies of water and nutrient in many parts of the world, including Canada (Drury et al., 2009), Sweden (Wesström and Messing, 2007), Egypt (El-Ghannam et al., 2021), the USA (Youssef et al., 2018; Zhang et al., 2019), Iran (Javani et al., 2018), and Netherlands (Rozemeijer et al., 2016). However, the potential benefits of CD on wheat yield, nitrate loss, and water use efficiency (WUE) in the northern Nile River delta of Egypt have not been investigated.
Egypt imports large quantities of wheat because local production provides only about 50% of the country's wheat consumption. As a most-populated country in the MENA countries, Egypt is below the water poverty limit and the problem is aggravated due to the rapid population growth (World Water Assessment Programme, 2020). Rainfall is rare in most regions of Egypt. The highest rainfall is received on the north coast with an average annual rainfall of 150-200 mm, mainly during the winter season (November-February). Despite this situation, flood irrigation dominates in the Nile River delta because farmers have small land holdings and adopt conventional crop management practices (El-Ghannam et al., 2021). In the northern Nile River delta, the region is served by subsurface free drainage (SFD) in which the drains are laid at 1.2 m below the soil surface. The use of flood irrigation and SFD leads to excessive drainage and inefficient use of water and fertilizers. Optimizing WUE could be achieved through several options including agronomic water management and planting drought-tolerant crop cultivars. However, any increase in WUE must not be attained at the cost of yield to ensure farmer acceptance of the proposed practices. The adoption of CD and the cultivation of water-efficient cultivars could maximize WUE while maintaining the crop yield. It is widely accepted that different wheat cultivars respond differently to agronomic practices (Elbasyoni et al., 2019; Morsy et al., 2021). Information about the potential benefits of CD on WUE of wheat in the northern Nile River delta is lacking. Moreover, the response of different wheat cultivars to CD has not yet been investigated. Therefore, this study investigated the effect of different CD treatments on drainage outflow, nitrate loss, grain yield, and WUE of various wheat cultivars. We hypothesized that wheat cultivars may respond differently to the adoption of CD in the northern Nile River delta, leading to decreased application of irrigation water while maintaining crop productivity. The results of this study could identify water-saving techniques that can be utilized in Egypt and other countries or regions to enhance future food security through attaining higher WUE while maintaining crop productivity and farmer profitability.

2 Materials and methods

2.1 Experimental site and climatic condition

A two-year field experiment (2018-2019 and 2019-2020) on CD was carried out at three isolated fields at Sakha research farm, Motobus District (31°15′51″N, 30°47′06″E) in the northern Nile River delta of Egypt. The climate of the study area is typically arid Mediterranean (El-Ghannam et al., 2021). The meteorological data were collected from a weather station located at the field site. The five-year average (2015-2020) of meteorological data showed that the lowest monthly average temperature was recorded in January, while the highest value was recorded in July (Fig. S1). The average annual rainfall is 134 mm (five-year average). The highest rainfall was recorded in December, while no rainfall was observed during the summer season (May-September) (Fig. 1). As for the study period (2018-2019 and 2019-2020), the highest rainfall was recorded in December (91.5 and 71.5 mm for 2019 and 2020, respectively; Fig. 1). The region is served by SFD at 1.2 m below the soil surface (SFD-1.2) and is irrigated by Nile River water. The soil is silt clay in texture and classified as typic Torrifluvents (Soil Survey Staff, 2014). Before the experiment was established, representative soil samples were collected from each field (0-30, 30-60, and 60-90 cm). Summaries of the soil's physical and chemical characteristics are shown in Table 1. Soil texture was performed using the pipette method (Baruah and Barthakur, 1999) and the textural class was identified by the United States Department of Agriculture (USDA) system (Soil Survey Division Staff, 1993). Soil bulk density was measured using the core method (Blake and Hartge, 1986). Soil pH was measured in a soil water suspension with a ratio of air-dried soil to distilled water of 1.0:2.5, while electrical conductivity (EC), cations, and anions were determined in soil paste extract following the standard methods of Jackson (1973).
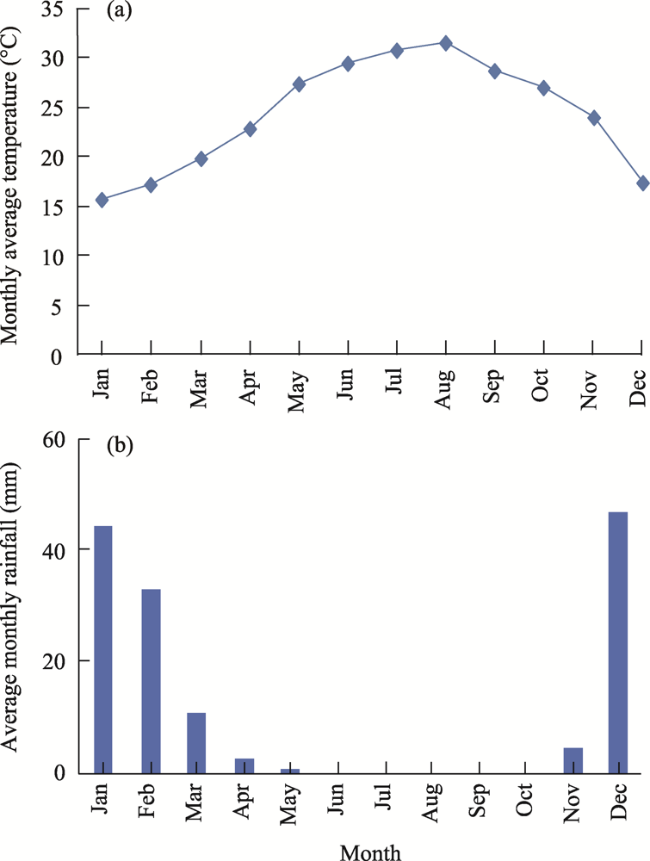
Fig. S1 Monthly average temperature (a) and average monthly rainfall (b) from 2016 to 2020 in Motobus District, Kafr El-Sheikh Governorate, Egypt
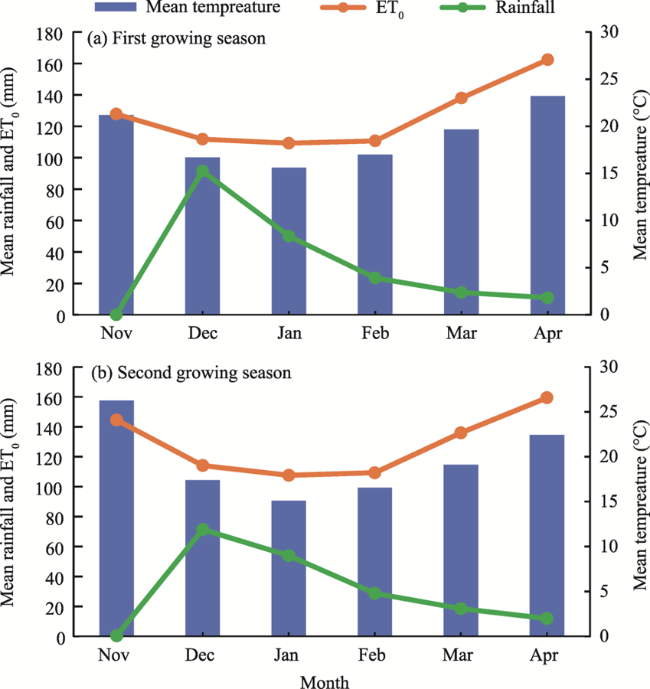
Fig. 1 Mean temperature, rainfall, and reference evapotranspiration (ET0) of the study area in the first (a) and second (b) growing seasons (i.e., during November 2018-April 2019 and during November 2019-April 2020, respectively)
Table 1 Physical and chemical characteristics of the soil in the study area
Sampling depth
(cm)
Bulk density
)g/cm3(
pH EC
)dS/m(
SAR
)%(
Ks
)m/h(
Particle size distribution Texture
Clay )%( Silt )%( Sand )%(
0-30 1.33 8.37 3.90 6.04 0.092 52.18 33.54 14.28 Silt clay
30-60 1.36 8.36 3.26 6.93 0.0341 47.54 39.80 12.66 Silt clay
60-90 1.35 8.40 3.48 7.80 0.040 43.44 18.35 38.21 Clay loam

Note: EC, electrical conductivity; SAR, sodium adsorption ratio; Ks, saturated hydraulic conductivity.

In the northern Nile River delta, the dominant irrigation system is flood irrigation using high-quality Nile River water (EC=0.5 dS/m) with subsurface drainage at 1.2 m depth. The region is dominated by the rice-wheat cropping system which is a water- and energy-intensive system, therefore, less-water-demanding alternative systems (e.g., maize-wheat and sunflower-wheat) are emerging (El-Ghannam et al., 2021). The groundwater level ranges from 0.9 (in summer) to 1.1 m (in winter), and the groundwater salinity ranges from 0.90 (in winter) to 1.23 dS/m (in summer) (El-Ghannam et al., 2021). The quaternary Nile River aquifer is a renewable shallow aquifer that underlies the Nile River delta and is considered a semi-confined aquifer due to the upper clay layer (Negm et al., 2018). Groundwater resources in the Nile River delta provide approximately 85% of total groundwater abstractions (6.1×10⁹ m3/a) in Egypt (Negm et al., 2018). The aquifer is characterized by a high productivity rate with relatively shallow wells at relatively low pumping costs (Abd El Moniem, 2009; El-Rawy et al., 2021). The aquifer is replenished by seepage from the Nile River, canals, and drain networks (Abd El Moniem, 2009; Negm et al., 2018; El-Rawy et al., 2021).

2.2 Experimental design and description of treatments

The experimental site consisted of three separate and isolated fields within the same farm. The area of each field was 0.6 hm2. One field was drained with SFD-1.2, and two fields were under CD with drains at 1.2 m below the soil surface and connected to a weir (outlet elevation) at either 0.4 m below the soil surface (CD-0.4) or 0.8 m below the soil surface (CD-0.8). Each field was drained separately with a control unit fixed at the existing drainage system (in each field) allowing the water table to possibly rise to the depth of 0.4 and 0.8 m (Fig. 2). The outlet elevation did not change throughout the growing season. Within each field, the parallel laterals (inner diameter of 75 mm and drain spacing of 20 m) were connected to a manhole in which the control unit was installed. Each field (drainage treatment) was divided into 12 plots, each plot with an area of 300 m2 (12 m width×25 m length), and four wheat cultivars, i.e., Sakha95, Misr3, Giza171, and Sids14, were randomly arranged into three replicates. The selected cultivars represent the most widely grown commercial cultivars characterized as highly productive in terms of grain yield and straw yield (straw yield is also vital for the farmers in the region as animal feed).
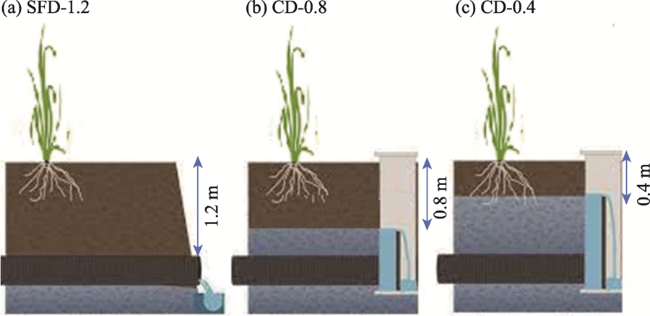
Fig. 2 Experimental design and diagram of different treatments used in this study. (a), subsurface free drainage (SFD) at 1.2 m below the soil surface (SFD-1.2); (b), controlled drainage (CD) with drains at 1.2 m below the soil surface and connected to a weir (outlet elevation) at 0.8 m below the soil surface (CD-0.8); (c), CD with drains at 1.2 m below the soil surface and connected to a weir (outlet elevation) at 0.4 m below the soil surface (CD-0.4).

2.3 Crop management

All wheat cultivars were sown on rows (25 cm apart) at a seeding rate of 110 kg/hm2. In the first growing season (2018-2019), all wheat cultivars were sown on 15 November 2018, and harvested on 25 April 2019. In the second growing season (2019-2020), all wheat cultivars were sown on 20 November 2019, and harvested on 27 April 2020. Recommended doses of N, P, and potassium (K) fertilizers were applied at one dose in which P fertilizer (15.0% P2O5; 350 kg/hm2) and K fertilizer (48.0% K2O; 120 kg/hm2) were applied during land preparation before the planting. N fertilizer (46.5% N; 360 kg/hm2) was applied at two equal doses, i.e., before the irrigation and planting and before the second irrigation. Weeds were controlled using the recommended rates and types of herbicides.

2.4 Irrigation water input and drain discharge

At the first irrigation, equal water depth was applied by flooding to all treatments to ensure uniform crop germination and establishment. A water flow meter was installed for each field (drainage treatment) to quantify the applied water volume. Subsequent irrigation for all drainage treatments was applied based on crop requirements. After 50.00% depletion of available water capacity (soil moisture of 30.84%) for the SFD-1.2 treatment, all treatments were re-watered to the field capacity. The moisture content in the soil between irrigation intervals was measured for all main-plot treatments using time-domain reflectometry (HH2 Moisture Meter, Delta-T Devices, Cambridge, England). We calculated the irrigation depth for each field based on the root depth (measured directly before irrigation) and soil water content before irrigation. The required irrigation depth for each drainage treatment varied according to the moisture content prior to irrigation. The available water capacity was computed by subtracting soil water content at the permanent wilting point (21.70%) from their corresponding values at field capacity (39.98%).
Throughout the growing season, drains were monitored after each irrigation or rainfall event. Drain discharge (mm/d) was determined twice a day until the drains showed negligible drainage. The quantity of water running from the drain for a specific period of time was determined using a calibrated tank and a stopwatch (Javani et al., 2018; El-Ghannam et al., 2021). The cumulative drainage water (mm/(hm2•season)) was computed. Drainage water samples were collected at different times of the day and composite daily samples were analyzed for nitrate concentration. To estimate the daily nitrate loss (kg/(hm2•d)) from each field, we calculated the loss by multiplying the daily nitrate content by the daily drainage water volume and then computed the cumulative nitrate loss (kg/(hm2•season)).

2.5 Water table observation

To monitor the water table level throughout the season, three observation wells were installed within each drainage treatment (main plot). The wells were fixed using polyethylene tubes (5 cm diameter and 200 cm length; including 30 cm perforated at the lower end). The tubes were inserted in well-prepared auger-holes to 140 cm below the soil surface and the left 60 cm length was above the soil surface. The perforated lower 30 cm was covered with a permeable screen to avoid clogging. The water table level in observation wells was regularly recorded using a sounder device and averaged for every month.

2.6 Crop water uptake from the shallow groundwater

To estimate the crop water uptake from the shallow groundwater, we calculated evapotranspiration (ETc; mm) according to Allen et al. (1998). The formula is as follows:
$\text{ETc=E}{{\text{T}}_{\text{0}}}\times Kc$,
where ET0 is the reference evapotranspiration (mm/d); and Kc is the crop coefficient (0.4, 0.8, 1.2, and 0.7 for the first, second, third, and fourth growth stages, respectively). The ET0 was calculated using the ET-calculator software (Raes, 2012), which applies the Penman-Monteith formula recommended by the Food and Agriculture Organization of the United Nations (FAO).
We estimated the crop water uptake from the shallow groundwater according to El-Ghannam et al. (2021), the calculation process is as follows:
${{G}_{i}}=\text{ETc}(\text{Retained water in the root zone})$,
${{G}_{i}}=\text{ETc}-\left[ \left( \left( {{I}_{i}}+\text{P} \right)-{{D}_{i}} \right)\pm \Delta S \right]$,
where Gi (mm) is the crop water uptake from shallow groundwater for a certain treatment that received a certain amount of irrigation water Ii (mm) and has a certain amount of drainage water Di (mm); P is the precipitation (mm); and ∆S is the change of soil moisture (%), which was measured as the increase or decrease in measured soil water content (prior to an irrigation event) with respect to soil water content after depleting 50.00% of the available water capacity (30.84%).

2.7 Crop growth and yield parameters

Plant height (cm), the distance from the base to the top of the main stem spike, was measured for ten plants and then averaged. The whole plot was harvested, air-dried, and threshed, and grain yield (kg/hm2) was measured. The straw yield (kg/hm2) for each plot was also measured. Lastly, 1000 grains were counted, and the corresponding mass (g) was determined.

2.8 Drainage ratio and water use efficiency (WUE)

The drainage ratio (DR) is the ratio between the amount of drainage (D; mm/season) and the amount of water involved in crop production (VW; mm/season), i.e., the sum of irrigation and rainfall, the formula is as follows (Bahçecİ, 2016):
$\text{DR}=\dfrac{D}{VW}$.
The WUE (kg/m3) was computed as the ratio of grain yield (GY; kg/hm2) to the total amount of water involved in crop production (VT; m3/hm2) (Abdallah et al., 2018; Javani et al., 2018). Irrigation WUE (IWUE; kg/m3) was computed as the ratio of grain yield to the volume of applied irrigation water alone (VI; m3/hm2). The calculation formulas are as follows:
$\text{WUE}=\frac{\text{GY}}{VT}$,
$\text{IWUE}=\frac{\text{GY}}{VI}$.

2.9 Soil salinity analysis

For each field, soil salinity was determined before sowing the wheat cultivars (the first growing season) and after the final harvest (the second growing season). The soil samples were collected at soil depth of 0-20, 20-40, 40-60, and 60-80 cm. Soil salinity was measured in saturated soil paste extract following the standard method of Jackson (1973).

2.10 Statistical analysis

The data of crop growth parameters and WUE of each wheat cultivar were subjected to analysis of variance (ANOVA) using one-way completely randomized design (CRD) in Glmmix procedure in SAS 9.4. Differences between means were separated using Tukey's test at P≤0.05. The mean values were calculated to compare non-randomized parameters, i.e., drainage outflow, water table level, drainage ratio, WUE, and nitrate loss, as data were non-randomized.

3 Results

3.1 Drainage outflow, irrigation input, nitrate loss, and drainage ratio

Across the two growing seasons, the deployment of CD decreased drainage time and average drain discharge. As a result, drainage outflow decreased. The reduction in drainage outflow was proportional to drainage depth (Fig. 3). Compared with SFD-1.2, CD reduced drainage outflow by 36.0% and 17.0% for CD-0.4 and CD-0.8, respectively, in the first growing season; and CD reduced drainage outflow by 44.6% and 37.6% for CD-0.4 and CD-0.8, respectively, in the second growing season (Fig. 3). Moreover, the use of CD led to a decrease in the irrigation water input during the two growing seasons (Fig. 3). CD decreased irrigation water by 39.1% and 18.7% for CD-0.4 and CD-0.8, respectively, in the first growing season. In the second growing season, irrigation water decreased by 45.0% and 22.0% for CD-0.4 and CD-0.8, respectively. A reduction in the drainage ratio was observed due to the implementation of CD, where the drainage ratio decreased by 19.0% and 17.1% for CD-0.4 and CD-0.8, respectively, compared with SFD-1.2 (Fig. 3). The use of CD decreased nitrate loss in the drainage water. Lower nitrate loss was observed for CD-0.4 (19.1% and 51.5%, for the first and second growing seasons, respectively) and CD-0.8 (9.0% and 32.6%, for the first and second growing seasons, respectively) compared with SFD-1.2 (Fig. 3).
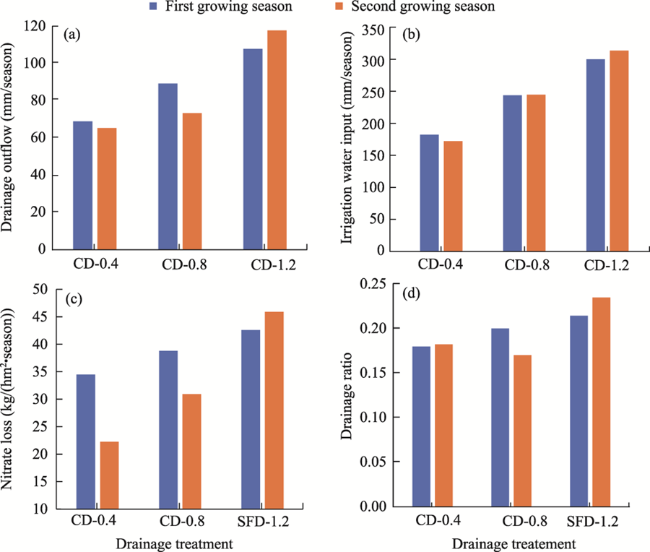
Fig. 3 Effects of CD-0.4 and CD-0.8 in comparison to SFD-1.2 on drainage outflow (a), irrigation water input (b), nitrate loss (c), and the drainage ratio (d) in the first and second growing seasons

3.2 Water table level

The monthly average water table level of drainage treatments for the two growing seasons was given in Figure 4. As expected, the use of CD raised the water table level, particularly in the CD-0.4 treatment. The seasonal average water table level decreased from 110 to 64 cm for CD-0.4 and from 110 to 90 cm for CD-0.8 in the first growing season. Similar trends were observed in the second growing season. In addition, there was a fluctuation in water table level in response to the rainfall and irrigation under CD-0.4 treatment. During the rainfall period (December-February), CD-0.4 maintained a water table level ranging from 45 to 50 cm, after which, water table level decreased to around 65 to 70 cm. However, CD-0.8 and SFD-1.2 showed a constant water table level from December to May, i.e., 85-95 and 115-120 cm for CD-0.8 and SFD-1.2, respectively.
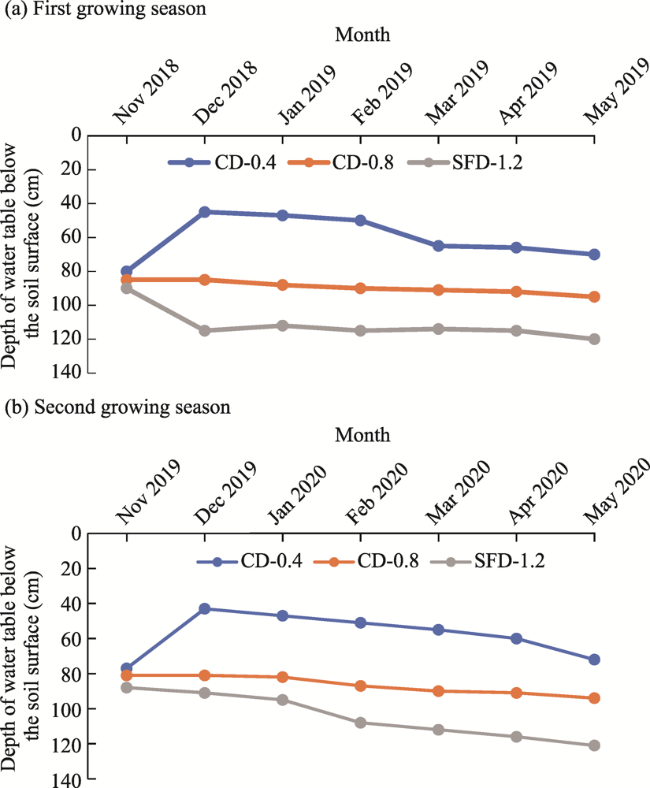
Fig. 4 Effect of CD-0.4 and CD-0.8 in comparison to SFD-1.2 on water table level in the first (a) and second (b) growing seasons

3.3 Water uptake from the shallow groundwater

In this study, actual-evapotranspiration was calculated as the difference between the total water input (the sum of irrigation and rainfall) and drainage water of the control treatment (SFD-1.2). SFD-1.2 treatment with water management practices designed to prevent water stress was used as a reference. Using this approach, the whole treatments were assumed to have the same actual-evapotranspiration (396.7 and 385.3 mm, respectively, for the first and second growing seasons). The water uptake from the shallow groundwater was higher for CD treatments, in particular for CD-0.4 (Table 2). During the first growing season, the water uptake from the shallow groundwater was 95.0 and 52.7 mm/season for CD-0.4 and CD-0.8, respectively, amounting to 23.1% and 12.8% of actual-evapotranspiration. In the second growing season, the groundwater contribution was 105.7 and 40.5 mm/season for CD-4.0 and CD-0.8, respectively, amounting to 26.4% and 10.1% of actual-evapotranspiration (Table 2).
Table 2 Effect of controlled drainage in comparison to subsurface free drainage (SFD) on water uptake from shallow ground water in the first and second growing seasons (i.e., during November 2018-April 2019 and during November 2019-April 2020, respectively)
Parameter CD-0.4 CD-0.8
First growing season Second growing season First growing season Second growing season
Water uptake from shallow groundwater (mm/season) 95.0 105.7 52.7 40.5
Percentage of groundwater contribution relative to the actual-evapotranspiration (%) 23.1 12.8 26.4 10.1

Note: CD-0.4 and CD-0.8 represent controlled drainage (CD) with drains at 1.2 m below the soil surface and connected to a weir (outlet elevation) at 0.4 and 0.8 m below the soil surface, respectively.

3.4 Grain and straw yields of wheat cultivars

Irrespective of the wheat cultivars, CD had a minimal effect on the 1000-grain weight (Table 3). However, CD increased plant height, grain yield, and straw yield (Table 3). Compared with SFD-1.2, irrespective of the wheat cultivars, CD increased plant height by 9.6% and 11.7% for CD-0.4 and CD-0.8, respectively, in the first growing season; and CD increased plant height by 5.0% and 6.0% for CD-0.4 and CD-0.8, respectively, in the second growing season. More importantly, the average grain yield under CD treatment was higher than that under CD-0.4 and CD-0.8 treatments (10.3% and 8.3%, respectively) in the first growing season. In the second growing season, grain yield under CD treatment was higher than that under CD-0.4 and CD-0.8 treatments (4.8% and 3.3%, respectively). The straw yield under CD-0.4 and CD-0.8 treatments was 15.0% higher than that under the control for the two growing seasons.
Table 3 Effects of CD-0.8 and CD-0.4 in comparison to subsurface free drainage at 1.2 m below the soil surface (SFD-1.2) on plant height, 1000-grain weight, grain yield, and straw yield of the four tested wheat cultivars in the first and second growing seasons
Treatment Wheat cultivar Plant height (cm) 1000-grain weight (g) Grain yield (kg/hm2) Straw yield (kg/hm2)
First growing season Second growing season First growing season Second growing season First growing season Second growing season First growing season Second growing season
CD-0.4 Sakha95 92.90a 110.40a 48.44a 42.56a 6222.07a 6643.77a 6127.00a 6900.40a
Misr3 87.33b 108.10b 47.27b 35.66b 5861.57b 6363.33c 5690.00c 6660.00b
Giza171 86.33b 103.10c 42.03c 31.84c 5792.57b 5731.90b 5850.00b 6300.00c
Sids14 78.16c 99.06d 39.49d 29.59d 5714.10b 4906.00d 5401.00d 5899.60d
Mean 96.18 105.16 44.31 34.91 5897.58 5911.00 5767.00 6440.00
CD-0.8 Sakha95 90.53a 105.22a 49.57a 41.46a 6037.90a 6275.00a 5940.00a 6870.00a
Misr3 83.80b 101.63b 47.36b 39.46b 5721.00b 5965.00b 5750.00b 6450.00b
Giza171 80.50c 98.50c 43.73c 36.70c 5570.40b 5392.00c 5701.00c 6200.00c
Sids14 75.13d 95.21d 41.47d 30.13d 5257.20c 4924.00d 5660.00d 6140.00d
Mean 82.49 100.12 45.53 36.94 5646.65 5639.00 5762.00 6415.00
SFD-1.2 Sakha95 88.20a 100.31a 51.40a 42.76a 5678.13a 6031.00a 5300.00a 6100.00b
Misr3 79.13b 95.23b 49.44b 37.61b 5544.87a 5700.80b 5050.00b 6850.00a
Giza171 76.20c 92.32c 45.31c 33.67c 5231.00b 5349.00c 4850.00c 5346.70c
Sids14 71.96d 88.80d 43.48d 30.83d 4935.07c 5662.30d 4699.00d 4999.70d
Mean 71.96 91.12 47.41 36.22 5347.27 5752.00 4975.00 5824.20

Note: SFD-1.2 represents subsurface free drainage (SFD) at 1.2 m below the soil surface. Different lowercase letters within the same column under the same treatment indicate significant differences among different wheat cultivars at P≤0.05 level.

Among the tested wheat cultivars, Sakha95 showed the highest grain and straw yields across the drainage treatments (Table 3), whereas Sids14 showed the lowest grain and straw yields. Irrespective of the drainage treatments, the highest average grain yield (6150.00 kg/hm2; two-season average) and straw yield (6210.00 kg/hm2) were recorded for Sakha95, while Sids14 recorded the lowest average grain yield (5000.00 kg/hm2) and average straw yield (5500.00 kg/hm2). The highest grain yield (6430.00 kg/hm2) and the highest straw yield (6500.00 kg/hm2) were recorded for Sakha95 under CD-0.4 treatment. In contrast, Sids14 recorded the lowest grain yield (4800.00 kg/hm2) and the lowest straw yield (4850.00 kg/hm2). Adoption of CD increased grain yield of Sakha95 by 500.00 and 600.00 kg/hm2 for the CD-0.4 in the first and second growing seasons, respectively, while CD-0.8 enhanced grain yield by 350.00 and 240.00 kg/hm2, for the first and second growing seasons, respectively. Similar trends have been observed for straw yield.

3.5 WUE

Irrespective of the wheat cultivars, CD had a significant positive effect on WUE and IWUE (Table 4). The WUE under CD-0.4 and CD-0.8 treatments was 55.60% and 18.86% higher than that under SFD-1.2 treatment, respectively, for the first growing season. Similar trends were observed for the second growing season. Interestingly, CD-0.4 and CD-0.8 increased IWUE by 1.85 and 1.28 times (two-season average) relative to SFD-1.2. Irrespective of drainage treatments, Sakha95 showed the highest WUE (1.45 kg/m3), while Sids14 recorded the lowest value (1.25 kg/m3). The highest WUE (1.71-1.85 kg/m3) was recorded for Sakha95 under CD-0.4 treatment. In contrast, the lowest WUE (0.98-1.13 kg/m3) and Giza171 (1.04-1.06 kg/m3) was observed for Sids14 under SFD-1.2 treatment. As for IWUE, Sakha95 showed the highest IWUE (2.65 kg/m3), while Sids14 recorded the lowest value (2.23 kg/m3), irrespective of CD treatments. The highest IWUE (3.80 kg/m3) was recorded for Sakha95 under CD-0.4 treatment, whereas the lowest IWUE (1.62 kg/m3) was observed for Sids14 under SFD-1.2 treatment.
Table 4 Effects of CD-0.4 and CD-0.8 in comparison to SFD-1.2 on water use efficiency (WUE) and irrigation water use efficiency (IWUE) of the four tested wheat cultivars in the first and second growing seasons
Treatment Wheat cultivar WUE (kg/m3) IWUE (kg/m3)
First growing season Second growing season First growing season Second growing season
CD-0.4 Sakha95 1.71a 1.85a 3.36a 3.80a
Misr3 1.64b 1.77b 3.17b 3.64a
Giza171 1.62bc 1.59c 3.13c 3.28b
Sids14 1.60c 1.36f 3.09d 2.56c
CD-0.8 Sakha95 1.35d 1.45d 2.44e 2.53c
Misr3 1.28e 1.38e 2.31f 2.40c
Giza171 1.24f 1.24g 2.25g 2.27cd
Sids14 1.17g 1.14i 2.12h 1.98de
SFD-1.2 Sakha95 1.13h 1.20h 1.86i 1.89e
Misr3 1.10i 1.13j 1.82j 1.79e
Giza171 1.04j 1.06k 1.72k 1.68e
Sids14 0.98k 1.13j 1.62l 1.78e

Note: Different lowercase letters within the same column under the same treatment indicate significant differences among different wheat cultivars at P≤0.05 level.

3.6 Soil salinity

Soil salinity was affected by CD under the wheat cropping system during the two growing seasons as shown in Figure 5. Before establishing the study (2018-2019), the values of soil salinity were 2.50, 2.95, 3.00, and 3.45 dS/m at the soil depths of 0-20, 20-40, 40-60, and 60-80 cm, respectively, with an average soil salinity of 2.97 dS/m. After the second wheat harvest, the values of soil salinity increased under CD-0.4 treatment, particularly in the upper soil layers, while soil salinity under SFD-1.2 treatment was not affected (Fig. 5a). As for the upper surface layer (0-20 cm), soil salinity was significantly higher under CD-0.4 and CD-0.8 treatments compared to both initial soil salinity and SFD-1.2. At the soil depth of 20-40 cm, soil salinity under CD-0.4 treatment was greater relative to that under other treatments (Fig. 5a). Below the soil depth of 40 cm (40-60 and 60-80 cm), there was no significant difference in soil salinity between SFD-1.2 and CD, but soil salinity at the soil depth of 40-60 cm was significantly greater than the initial soil salinity and the soil salinity under CD treatment (Fig. 5a).
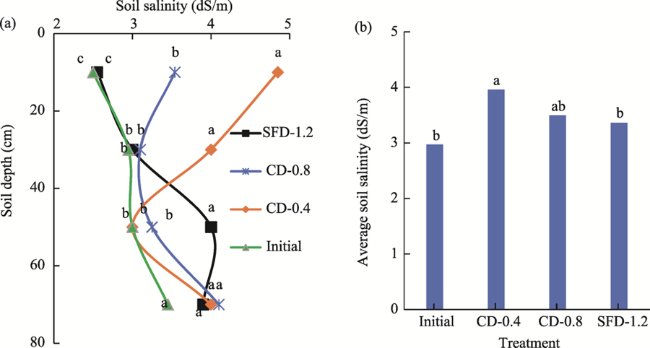
Fig. 5 (a), changes of soil salinity at different soil depths under CD-0.4, CD-0.8, and SFD-1.2 treatments compared with the initial soil salinity; (b), comparison of average soil salinity affected by CD-0.4, CD-0.8, and SFD-1.2 treatments with the initial soil salinity. Different lowercase letters in the left figure indicate significant differences among controlled drainage tenements within the same soil depth at P≤0.05 level, and different lowercase letters in the right figure indicate significant differences among different controlled drainage treatments at P≤0.05 level.
At the end of the study, the average soil salinity across the soil profile (Fig. 6b) was significantly higher under CD-0.4 treatment relative to that under SFD-1.2 treatment and the initial soil salinity, while CD-0.8 showed an intermediate response (Fig. 5b). By the end of the second growing season, CD-0.4, CD-0.8, and SFD-1.2 increased soil salinity by 33.2%, 17.5%, and 13.0%, respectively, as compared to the initial soil salinity. At the soil depth of 0-40 cm, CD-0.4, CD-0.8, and SFD-1.2 increased soil salinity by 32.4%, 22.0%, and 1.8%, respectively, relative to the initial soil salinity. In summary, soil salinity after the second growing season increased significantly for CD-0.4, while CD-0.8 and SFD-1.2 showed a non-significant trend toward increased average soil salinity.

4 Discussion

Globally, water is a critical resource for food security. Thus, there is a vital interest in reducing water losses and enhancing WUE, particularly in the MENA countries representing the driest region. Optimizing WUE could be achieved through adopting water-saving practices and cultivating drought-tolerant crops or cultivars. However, any increase in WUE must not be attained at the cost of yield to ensure farmer acceptance of the proposed practices (Abdallah, 2017). The potential impact of water-saving while maintaining productivity through the adoption of CD is great. CD decreases drainage outflow, thus preserving soil water in the rhizosphere to support plant growth. In the northern Nile River delta of Egypt, we evaluated the effects of CD-0.4, CD-0.8, and SFD-1.2 on drainage outflow, nitrate loss, water table level, grain yield, straw yield, and WUE of different wheat cultivars.

4.1 Water table level, drainage outflow, and applied irrigation water

It is well established that blocking the water outflow from a drainage network retains water availability for use by plants when evaporative demand is the highest (Wesström and Messing, 2007; Ritzema, 2015; Liu et al., 2019). In this study, the decreased drainage time and drainage discharge of CD treatments led to a reduction in overall drainage outflow. Such reduction in drainage outflow (27.3%-40.3%) was confirmed by the higher water table of CD treatments, particularly after irrigation events. The observed decline in drainage outflow resulting from CD treatments has been widely observed by many scholars around the world (Wesström and Messing, 2007; Drury et al., 2009; Helmers et al., 2012; Jaynes, 2012; Ritzema, 2015; Rozemeijer et al., 2016; Sunohara et al., 2016; Negm et al., 2017; Poole et al., 2018; Youssef et al., 2018; Liu et al., 2019; El-Ghannam et al., 2021). Compared to SFD, individual case studies have reported decreased drainage outflows in the amounts of 33%-45% (Javani et al., 2018), 30% (Youssef et al., 2018), 17%-80% (Skaggs et al., 2010, 2012), 25% (Negm et al., 2017), and 40%-100% (Gunn et al., 2015). Such variability in the drainage outflow could be due to the variation in soil properties, drainage network technical parameters that vary with the irrigation system, as well as rainfall amount, distribution, and intensity (Negm et al., 2017; Youssef et al., 2018). The lowest drainage outflow has been recorded under CD-0.4 treatment. Our results support the findings obtained by other researchers in different regions (Sojka et al., 2019; El-Ghannam et al., 2021).
The saved water through decreasing drainage outflow remains in the soil for utilization by plant roots (Rozemeijer et al., 2016), leading to a significant decline in applied irrigation water as observed for CD treatments. Under SFD-1.2 treatment, irrigation water requirements were 1.72 and 1.38 times higher than CD-0.4 and CD-0.8, respectively. Interestingly, adopting CD approach, particularly CD-0.4 treatment, raised the water table level increased groundwater storage in the root zone. This observation supported the results of Rozemeijer et al. (2016) who revealed that CD led to a decrease in drainage outflow and augmented the shallow groundwater stored in the effective root zone. Sustaining a shallow water table in silty clay soil enhances groundwater abundance in the root zone through the capillary rise (Ayars et al., 2006a, b; El-Ghannam et al., 2016, 2021). The significant increase in soil salinity under CD-0.4 and CD-0.8 treatments reinforces this conclusion (Ayars et al., 2006b). In this study, the water uptake from the shallow groundwater amounted to 22.0% and 8.0% of the total evapotranspiration for CD-0.4 and CD-0.8, respectively (two seasons on average). Similarly, the groundwater contribution to plant water uptake amounted to 37.0%, 29.0%, 53.0%, 63.0%, and 31.0% of crop evapotranspiration for cotton, corn, wheat, sugar beet, and sunflower, respectively (Ayars et al., 2006b; El-Ghannam et al., 2021).

4.2 Wheat growth, yield, and yield attributes

The observed increase in crop productivity resulting from CD was also previously observed (Drury et al., 2009; Nash et al., 2015; Sunohara et al., 2016). Such yield improvements have been mainly attributed to mitigating drought stress and decreasing nitrate loss. In this study, yield improvements amounted to only 9.3%. Based on the fact that all treatments were designed not to impose water stress across the two seasons, the observed increase in grain and straw yields could be explained by the reduction in drainage outflow and limited nitrate outflow, subsequently increasing N availability for plant growth. The observed reduction in nitrate loss (35.3% and 20.8% for CD-0.4 and CD-0.8, respectively) supports this interpretation. Under different environmental conditions, the adoption of CD led to a reduction in nitrate loss ranging from 18.0% to 75.0% (Ale et al., 2012; Craft et al., 2018; Liu et al., 2019; Sojka et al., 2019). Researchers attributed the low nitrate loss under CD treatments to the lower drainage outflow (Negm et al., 2017; Poole et al., 2018; Liu et al., 2019; Sojka et al., 2019). In addition to measurements of nitrate outflow, the measurements of nitrate in the soil and plant N status should be considered in future studies. The results showed that Sakha95 achieved the highest grain and straw yields and yield attributes compared with the other tested wheat cultivars, i.e., Misr3, Giza171, and Sids14. The superiority of Sakha95 over the other tested cultivars could be explained by its better grain filling that has been translated to a higher test weight (1000-grain weight).

4.3 WUE of different wheat cultivars

CD enhances WUE through a direct effect on the two main factors, i.e., enhancing grain yield and decreasing applied irrigation water. The marked increase in WUE under CD treatments is in accordance with the findings in arid regions, i.e., Iran (Javani et al., 2018) and Egypt (El-Ghannam et al., 2021). Increasing the outlet elevation minimizes drainage outflow and increases soil moisture between irrigation events. Several studies reported higher irrigation system efficiency under CD treatments (Bonaiti and Borin, 2010; Javani et al., 2018; Youssef et al., 2018; El-Ghannam et al., 2021).

4.4 Soil salinity affected by controlled drainage treatments

It is clear from the data that a shallow water table leads to salt accumulation, in particular in the topsoil layers. For example, the soil salinity values of the top layer under CD-0.4 treatment were almost two-fold greater than the deepest layers. The upward water movement, in particular within fine-textured soils, leads to evaporation at the soil surface or uptake by the plant, leaving the soluble salts within the topsoil layers. In this study, the increased soil salinity associated with CD had no detrimental effect on grain and straw yields because the maximum soil salinity (4.00 dS/m) was lower than the salinity threshold (6.00 dS/m) known to negatively affect wheat crop growth. However, soil salinity under SFD-1.2 treatment was not affected across the two seasons, suggesting over-drainage as indicated by drainage ratio and drainage outflow (El-Ghannam et al., 2021; Li et al., 2021). Similarly, Christen et al. (2001) observed the association between over-drainage and lower soil salinity for most SFD systems in Australia. Due to the expected soil salinization associated with CD, careful soil salinity management must be considered to avoid salt accumulation in the long term which will eventually lead to yield losses.
The present study demonstrated that CD and the selection of suitable cultivars could contribute to enhancing the WUE of the wheat crop in the northern Nile River delta. In addition, the adoption of CD could decrease surface and groundwater pollution by decreasing nitrate outflow (Ritzema, 2015). Similarly, in arid and semi-arid regions, the main adjustment required in subsurface drainage systems is raising the outlet elevation and considering plant water uptake from shallow groundwater (Ayars et al., 2006a; Darzi-Naftchali et al., 2013; Javani et al., 2018; El-Ghannam et al., 2021). Although the increase of observed soil salinity during the two seasons had a non-significant influence on crop yield, long-term shallow groundwater table depth could lead to soil salinity accumulation which could result in significant yield losses, thus adversely affecting farmer profitability. Therefore, monitoring and management of soil salinity when adopting CD is vital in the long term. Careful water management and appropriate cropping systems (salt-tolerant crops and cultivars), crop establishment techniques (e.g., raised beds), and agronomic practices (e.g., balanced fertilization and mulching crop residues to decrease water evaporation from the soil surface) could decrease the risk of salinity accumulation and mitigate the detrimental impacts of soil salinity (Ayars et al., 2006a). Adoption of CD can contribute to considerable water savings with the saved water used for expanding wheat cultivation in other regions to minimize the gap between production and consumption. Long-term studies are required to investigate the effect of the long-term adoption of CD on soil salinity and to determine the most suitable production system that benefits most from the CD while minimizing soil salinity.

5 Conclusions

This study aimed at improving agricultural WUE in the northern Nile River delta of Egypt, using a CD approach. CD substantially reduced drainage outflow, irrigation water, and nitrate loads compared to SFD-1.2, thus limiting the off-site effects of drainage. Under CD treatment, plants acquired part of their required evapotranspiration from the shallow groundwater that provided 22.0% and 8.0% of wheat evapotranspiration for CD-0.4 and CD-0.8, respectively. In addition to irrigation water saving, modifying the SFD by increasing the outlet elevation leads to a decrease in nitrate loss while increasing the WUE. In the northern Nile River delta, the adoption of CD could be a viable approach for enhancing WUE. Careful salinity management, such as the use of salt-tolerant crops and cultivars, raised bed cultivation methods, and maintaining crop residue on the soil surface, should be considered for decreasing salinity accumulation and avoiding future yield losses.

Acknowledgements

We sincerely acknowledge Dr. Antar SHABAAN for his assistance in data collection. Special thanks to Prof. Mahmoud SAIED, working at the Water and Environment Research Institute, Agricultural Research Center, Egypt, for providing suggestions on the first version of this manuscript.
[1]
Abd El Moniem A A. 2009. Overview of water resources and requirements in Egypt; the factors controlling its management and development. Environmental Studies, 2: 82-97.

[2]
Abdallah A M. 2017. Impacts of Kaolin and Pinoline foliar application on growth, yield and water use efficiency of tomato (Solanum lycopersicum L.) grown under water deficit: A comparative study. Journal of the Saudi Society of Agricultural Sciences, 18: 256-268.

[3]
Abdallah A M, Mashaheet A M, Zobel R, et al. 2019. Physiological basis for controlling water consumption by two snap beans genotypes using different anti-transpirants. Agriculture Water Management, 214: 17-27.

[4]
Abdallah A M, Burkey K O, Mashaheet A M. 2018. Reduction of plant water consumption through anti-transpirants foliar application in tomato plants (Solanum lycopersicum L). Science Horticulture, 235: 373-381.

[5]
Abdallah A M, Mashaheet A M, Burkey K O. 2021. Super absorbent polymers mitigate drought stress in corn (Zea mays L.) grown under rainfed conditions. Agriculture Water Management, 254: 106946, doi: 10.1016/j.agwat.2021.106946.

[6]
Ale S, Bowling L C, Owens P R, et al. 2012. Development and application of a distributed modeling approach to assess the watershed-scale impact of drainage water management. Agriculture Water Management, 107: 23-33.

[7]
Allen R G, Pereira L S, Raes D, et al. 1998. Crop evapotranspiration-guidelines for computing crop requirements. FAO: Rome, Italy.

[8]
Ayars J E, Christen E, Services P, et al. 2006a. Controlled drainage for improved water management in arid zone irrigated agriculture. Agriculture Water Management, 86: 128-139.

[9]
Ayars J E, Christen E, Soppe R W, et al. 2006b. The resource potential of in-situ shallow ground water use in irrigated agriculture: a review. Irrigation Science, 24: 147-160.

[10]
Bahçecİ İ. 2016. Impacts of different drainage managements on water saving, salt balance and nutrients losses in the Harran Plain, South East Turkey. Soil Water Journal, 5: 22-28.

[11]
Baruah T, Barthakur H. 1999. A Text Book of Soil Analysis. New Delhi: Vikas Publishing House.

[12]
Blake G R, Hartge K H. 1986. Bulk density. In: Klute A. Methods of Soil Analysis. Part 1. Physical and Mineralogical Methods. Madison: American Society of Agronomy—Soil Science Society of America, 363-375.

[13]
Bonaiti G, Borin M. 2010. Efficiency of controlled drainage and subirrigation in reducing nitrogen losses from agricultural fields. Agriculture Water Management, 98: 343-352.

[14]
Campus M. 2019. Water table management and fertilizer application impacts on CO2, N2O and CH4 fluxes in a corn agro-ecosystem. Scientific Reports, 9: 2692, doi: 10.1038/s41598-019-39046-z.

[15]
Christen E W, Ayars J E, Hornbuckle J W. 2001. Subsurface drainage design and management in irrigated areas of Australia. Irrigation Science, 21: 35-43.

[16]
Craft K J, Helmers M J, Malone R W, et al. 2018. Effects of subsurface drainage systems on water and nitrogen footprints simulated with RZWQM2. Transactions of the American Society of Agricultural and Biological Engineers, 61(1): 245-261.

[17]
Darzi-Naftchali A, Mirlatifi S M, Shahnazari A, et al. 2013. Effect of subsurface drainage on water balance and water table in poorly drained paddy fields. Agriculture Water Management, 130: 61-68.

[18]
Drury C F, Tan C S, Reynolds W D, et al. 2009. Managing tile drainage, subirrigation, and nitrogen fertilization to enhance crop yields and reduce nitrate loss. Environment Quality, 38: 1193-1204.

[19]
El-Ghannam M K, Abo Waly M E, Gaheen S A, et al. 2016. Controlled drainage effects on nitrate leaching, salinity buildup and sugar beet production (Egypt). Agriculture Sciences and Soil Sciences, 4: 23-32.

[20]
El-Ghannam M K, Aiad M A, Abdallah A M. 2021. Irrigation efficiency, drain outflow and yield responses to drain depth in the Nile delta clay soil, Egypt. Agriculture Water Management, 246: 106674, doi: 10.1016/j.agwat.2020.106674.

[21]
El-Rawy M, Makhloof A A, Hashem M D, et al. 2021. Groundwater management of quaternary aquifer of the Nile Valley under different recharge and discharge scenarios: A case study Assiut Governorate, Egypt. Ain Shams Engineering, 12: 2563-2574.

[22]
Elbasyoni I S, Abdallah A M, Morsy S, et al. 2019. Effect of deprivation and excessive application of nitrogen on nitrogen use efficiency-related traits using wheat cultivars, lines, and landraces. Crop Science, 59: 994-1006.

[23]
Gunn K M, Fausey N R, Shang Y, et al. 2015. Subsurface drainage volume reduction with drainage water management: Case studies in Ohio, USA. Agriculture Water Management, 149: 131-142.

[24]
Hamed Y, Hadji R, Redhaounia B, et al. 2018. Climate impact on surface and groundwater in North Africa: A global synthesis of findings and recommendations. Euro-Mediterranean Journal for Environmental Integration, 3(25): 25, doi: 10.1007/s41207-018-0067-8.

[25]
Helmers M, Christianson R, Brenneman G, et al. 2012. Water table, drainage, and yield response to drainage water management in southeast Iowa. Soil Water Conservation, 67: 495-501.

[26]
Jackson M. 1973. Soil Chemical Analysis. New Delhi: Prentice Hall.

[27]
Javani H, Liaghat A, Hassanoghli A, et al. 2018. Managing controlled drainage in irrigated farmers' fields: A case study in the Moghan plain, Iran. Agriculture Water Management, 208: 393-405.

[28]
Jaynes D B. 2012. Changes in yield and nitrate losses from using drainage water management in central Iowa, United States. Soil Water Conservation, 67: 485-494.

[29]
Lavaire T, Gentry L E, David M B, et al. 2017. Fate of water and nitrate using drainage water management on tile systems in east-central Illinois. Agriculture Water Management, 191: 218-228.

[30]
Li S, Wu M, Jia Z, et al. 2021. Influence of different controlled drainage strategies on the water and salt environment of ditch wetland: A model-based study. Soil and Tillage Research, 208: 104894, doi: 10.1016/j.still.2020.104894.

[31]
Liu Y, Youssef M A, Chescheir G M, et al. 2019. Effect of controlled drainage on nitrogen fate and transport for a subsurface drained grass field receiving liquid swine lagoon effluent. Agriculture Water Management, 217: 440-451.

[32]
Lu B, Shao G, Yu S, et al. 2016. The effects of controlled drainage on N concentration and loss in paddy field. Journal of Chemistry, 2016: 1073691, doi: 10.1155/2016/1073691.

[33]
Morsy S, Elbasyoni I S, Baenziger S, et al. 2022. Gypsum amendment influences performance and mineral absorption in wheat cultivars grown in normal and saline-sodic soils. Journal of Agronomy and Crop Science, 208(5): 675-692.

[34]
Morsy S M, Elbasyoni I S, Abdallah A M, et al. 2021. Imposing water deficit on modern and wild wheat collections to identify drought-resilient genotypes. Journal of Agronomy and Crop Science, 208(4): 427-440.

[35]
Nash P R, Nelson K A, Motavalli P P, et al. 2015. Reducing phosphorus loss in tile water with managed drainage in a claypan soil. Environment Quality, 44: 585-593.

[36]
Negm A M, Sakr S, Abd-Elaty I, et al. 2018. An overview of groundwater resources in Nile Delta aquifer. n: Negm A. Groundwater in the Nile Delta. The Handbook of Environmental Chemistry. Springer: Cham.

[37]
Negm L M, Youssef M A, Jaynes D B. 2017. Evaluation of DRAINMOD-DSSAT simulated effects of controlled drainage on crop yield, water balance, and water quality for a corn-soybean cropping system in central Iowa. Agriculture Water Management, 187: 57-68.

[38]
Poole C A, Skaggs R W, Youssef M A, et al. 2018. Effect of drainage water management on nitrate nitrogen loss to tile drains in North Carolina. American Society of Agricultural and Biological Engineers, 61: 233-244.

[39]
Radhouane L. 2013. Climate change impacts on North African countries and on some Tunisian economic sectors. Journal of Agriculture and Environment for International Development, 107: 101-113.

[40]
Raes D. 2012. The ET0 Calculator Reference Manual. [2022-07-20]. www.fao.org/nr/water/eto.html.

[41]
Ritzema H P, Stuyt L C P M. 2015. Land drainage strategies to cope with climate change in the Netherlands. Soil Plant Science, 65: 80-92.

[42]
Ritzema H P. 2016. Drain for gain: Managing salinity in irrigated lands-A review. Agriculture Water Management, 176: 18-28.

[43]
Rozemeijer J C, Visser A, Borren W, et al. 2016. High-frequency monitoring of water fluxes and nutrient loads to assess the effects of controlled drainage on water storage and. Hydrology and Earth System Sciences, 20: 347-358.

[44]
Shavrukov Y, Kurishbayev A, Jatayev S, et al. 2017. Early flowering as a drought escape mechanism in plants: How can it aid Wheat production? Frontiers in Plant Science, 8: 1950, doi: 10.3389/fpls.2017.01950.

[45]
Skaggs R W, Youssef M A, Gilliam J W, et al. 2010. Effect of controlled drainage on water and nitrogen balances in drained lands. American Society of Agricultural and Biological Engineers, 53: 1843-1850.

[46]
Skaggs W R, Fausey N R, Evans R O. 2012. Drainage water management. Journal of Soil and Water Conservation, 67(6): 167-172.

[47]
Soil Survey Division Staff. 1993. Soil Survey Manual. Washington DC: Government Printing Office.

[48]
Soil Survey Staff. 2014. Keys to Soil Taxonomy. [2022-07-20].https://www.nrcs.usda.gov/resources/guides-and-instructions/keys-to-soil-taxonomy.

[49]
Sojka M, Kozłowski M, Stasik R, et al. 2019. Sustainable water management in agriculture-the impact of drainage water management on groundwater table dynamics and subsurface outflow. Sustainability, 11(15): 4201, doi: 10.3390/su11154201.

[50]
Sunohara M D, Gottschall N, Craiovan E, et al. 2016. Controlling tile drainage during the growing season in Eastern Canada to reduce nitrogen, phosphorus, and bacteria loading to surface water. Agriculture Water Management, 178: 159-170.

[51]
Wesström I, Messing I. 2007. Effects of controlled drainage on N and P losses and N dynamics in a loamy sand with spring crops. Agriculture Water Management, 87: 229-240.

[52]
World Water Assessment Programme. 2020. World Water Development Report 2020-Water and Climate Change. [2022-07-20]. https://en.unesco.org/themes/water-security/wwap/wwdr/2020.

[53]
Youssef M A, Abdelbaki A M, Negm L M, et al. 2018. DRAINMOD-simulated performance of controlled drainage across the U.S. Midwest. Agriculture Water Management, 197: 54-66.

[54]
Zekry M, Nassar I, Salim H, et al. 2020. The potential of super absorbent polymers from diaper wastes to enhance water retention properties of the soil. Soil Environment, 39: 27-37.

[55]
Zekry M, Salim H, Nassar I, et al. 2022. The role of used disposable diapers for improving the growth and survival of Eucalyptus alaticaulis seedling under drought conditions. Soil and Environment, 41: 63-74.

[56]
Zhang Q, Liu S M, Wang T, et al. 2019. Urbanization impacts on greenhouse gas (GHG) emissions of the water infrastructure in China: Trade-offs among sustainable development goals (SDGs). Cleaner Production, 232: 474-486.

文章导航

/