
基于遥感影像的新疆渭干河—库车河三角洲土壤水盐与植被覆盖度的关系
|
郑柳娜(1998-),女,硕士研究生,主要从事生态学研究. E-mail: 18833064955@163.com |
收稿日期: 2023-08-28
修回日期: 2024-03-28
网络出版日期: 2025-08-14
基金资助
新疆维吾尔自治区自然科学基金重点项目(2021D01D06)
国家自然科学基金(41561081)
新疆绿洲生态重点实验室开放课题(2023D04060)
新疆大学博士启动基金(BS190205)
Correlations between soil water content, salinity, and fractional vegetation cover in the Ugan-Kuqa River Delta Oasis of Xinjiang ascertained based on remote sensing images
Received date: 2023-08-28
Revised date: 2024-03-28
Online published: 2025-08-14
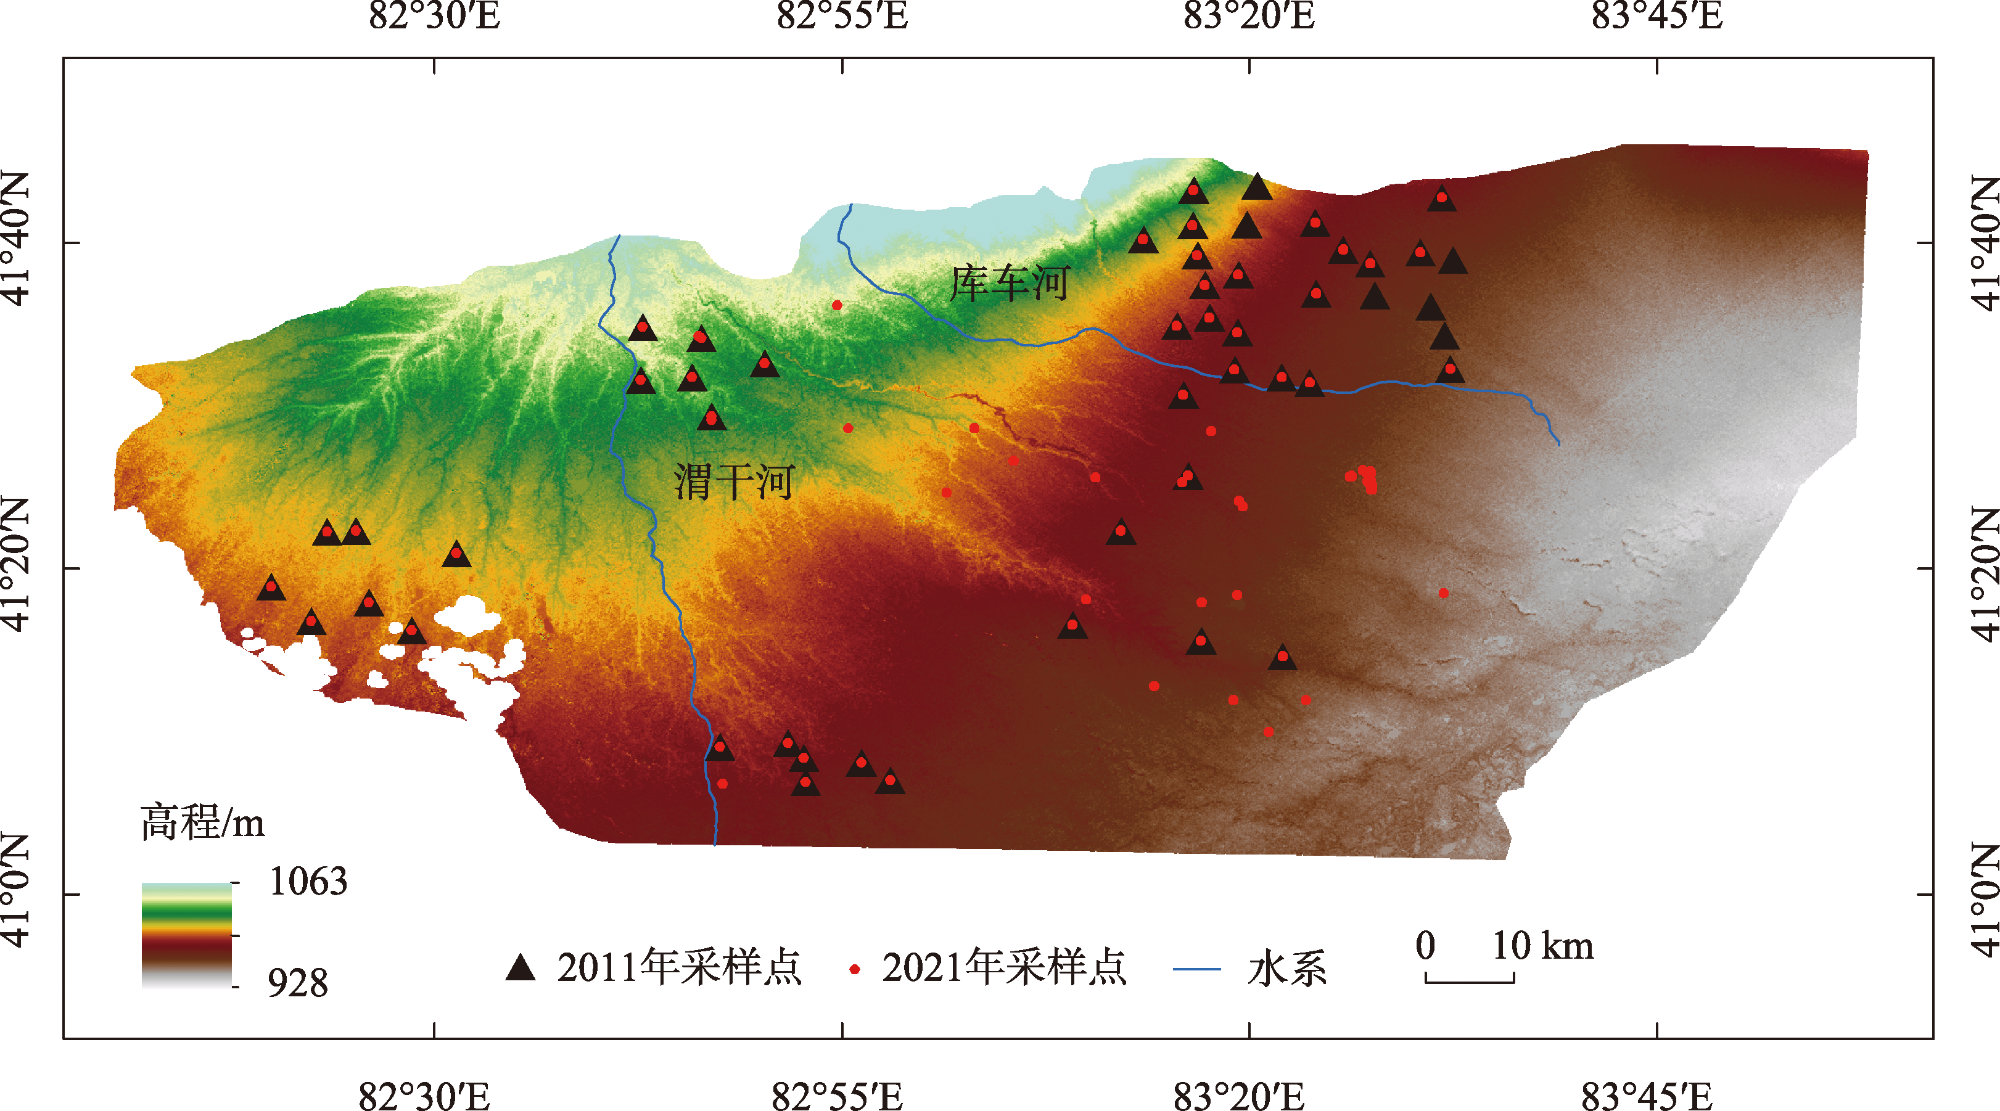
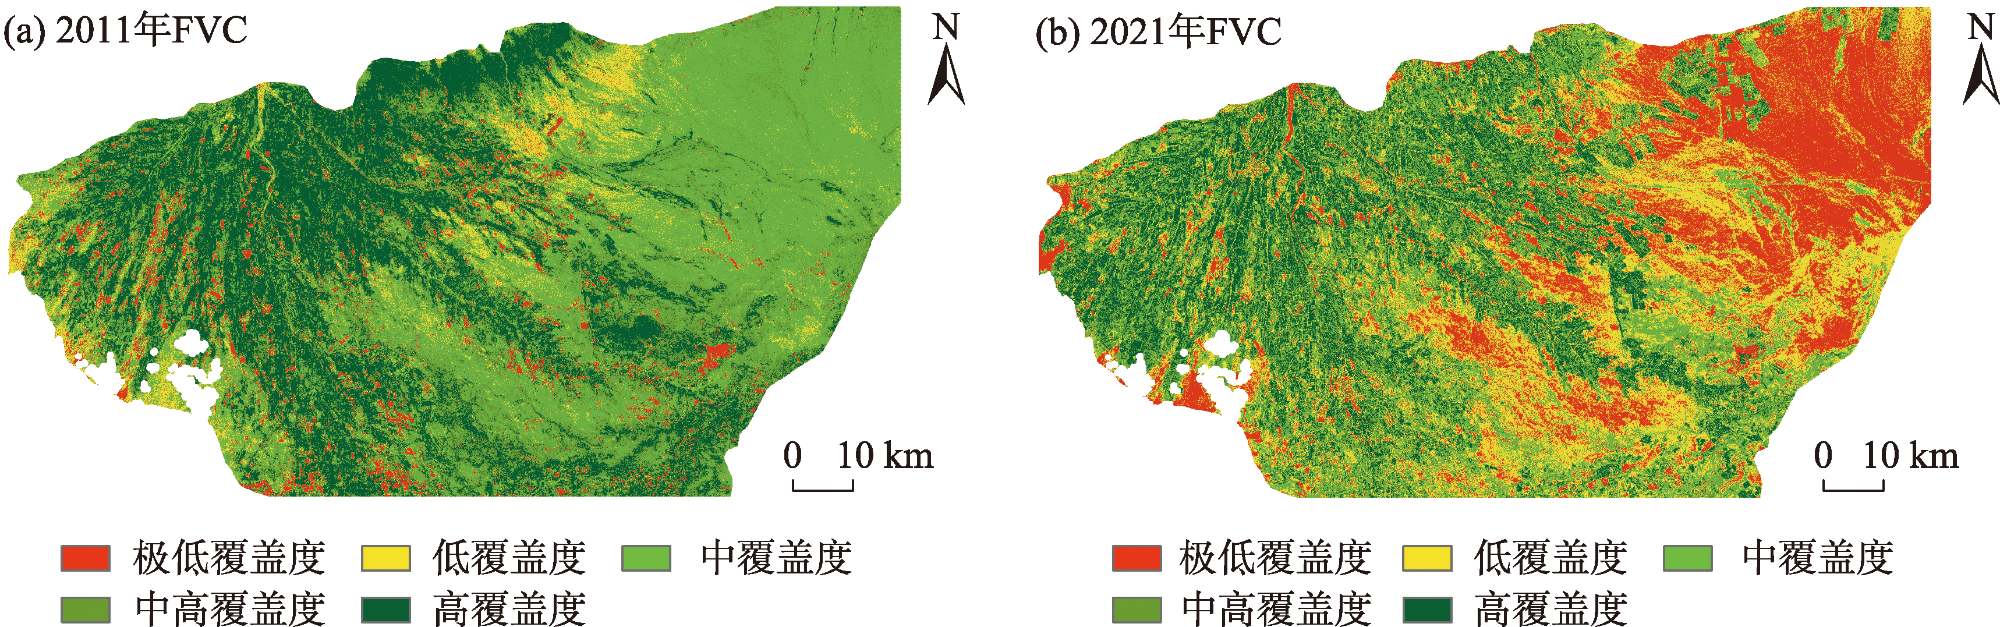
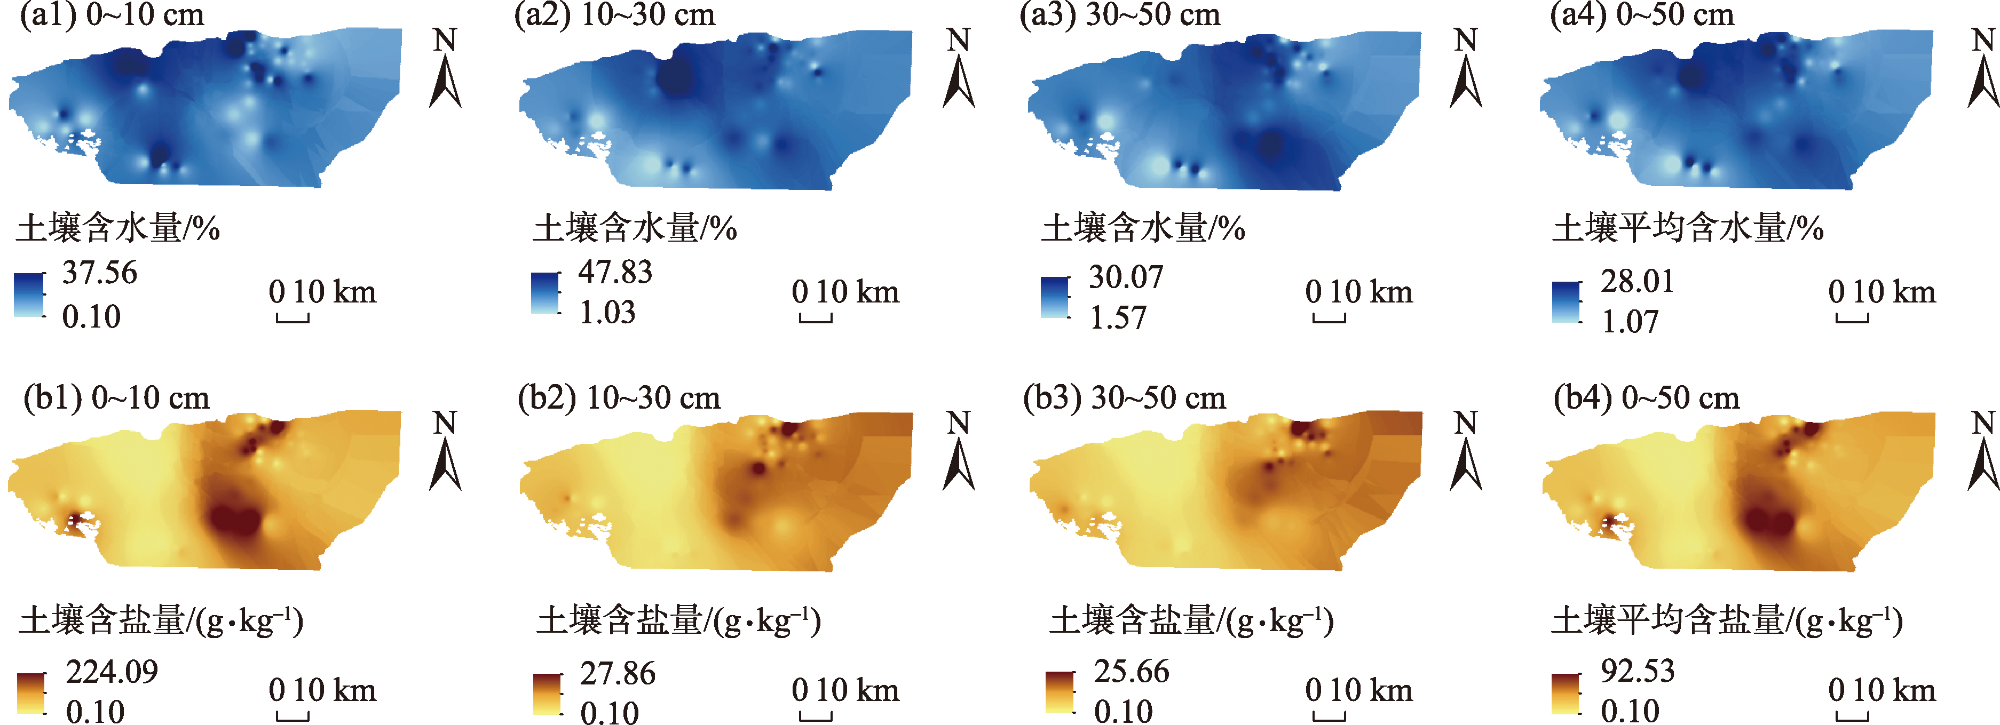
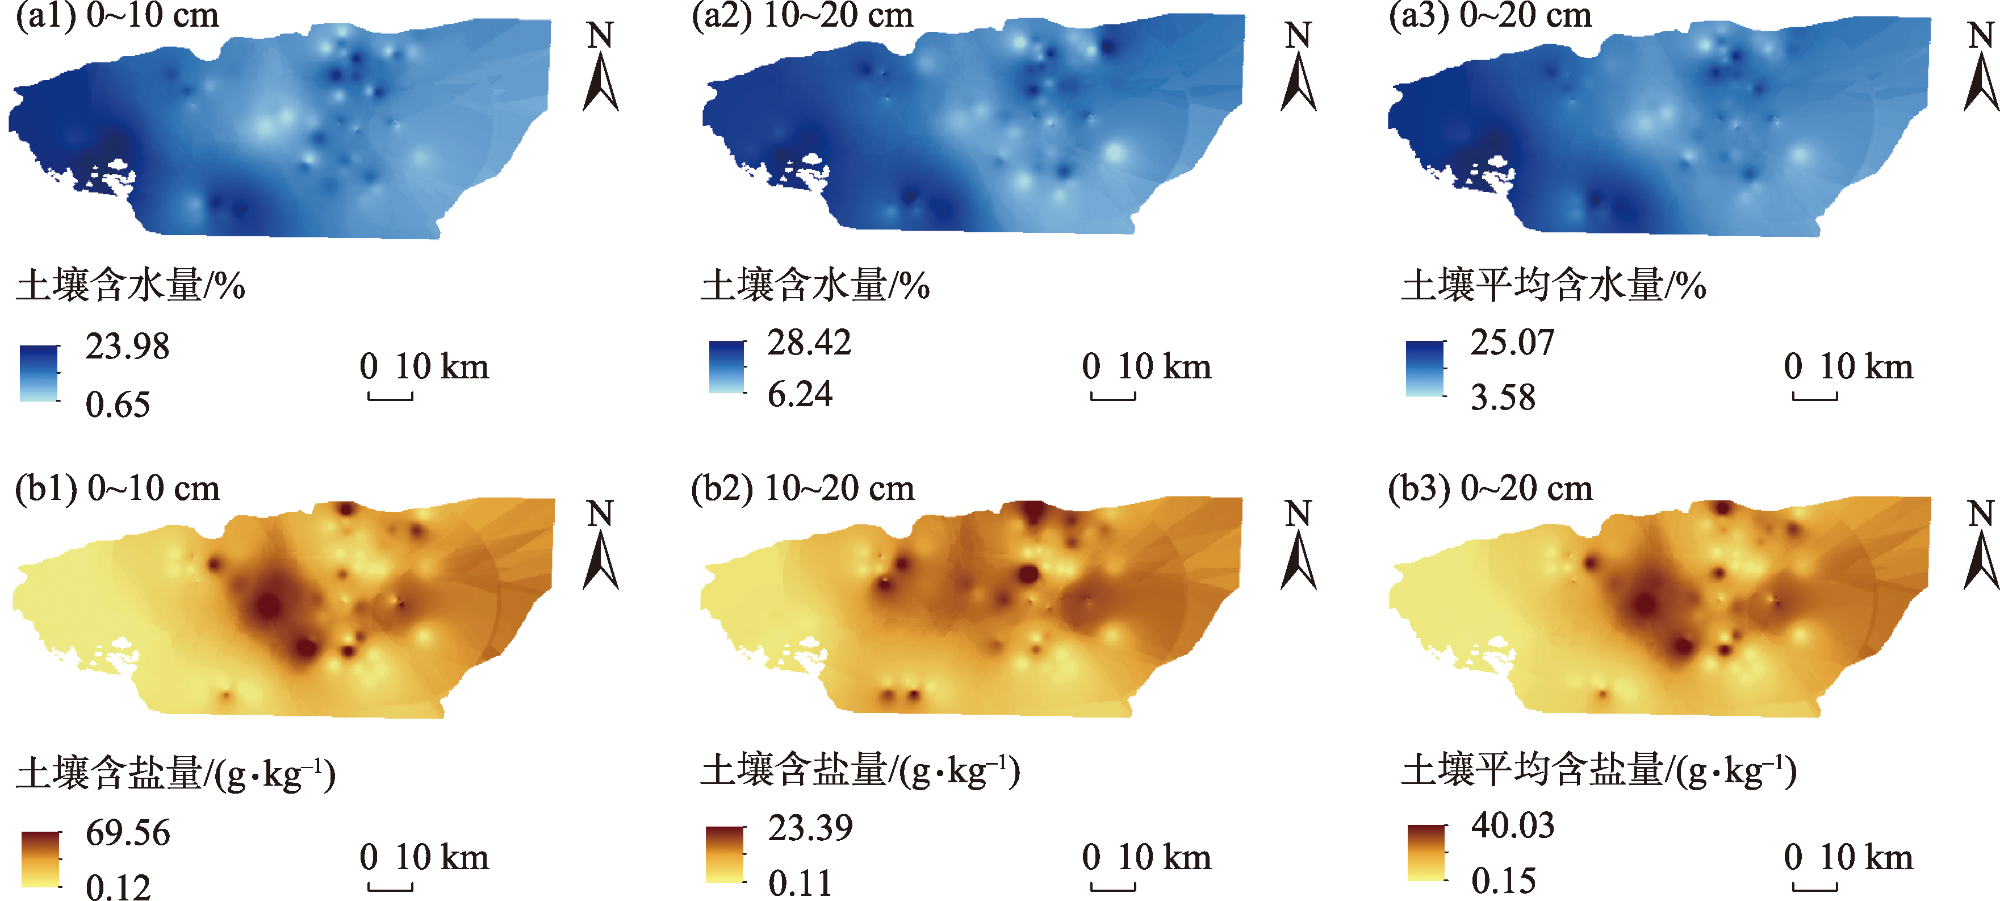
基于土壤样本实测数据及遥感影像数据,以典型干旱区新疆渭干河—库车河三角洲绿洲为研究区,采用像元二分模型估算植被覆盖度(Fractional vegetation cover,FVC),利用反距离权重插值及相关、中介效应等统计学分析方法,研究0~50 cm不同深度土壤水盐含量与FVC的关系,可为干旱区优化资源配置和制定生态恢复措施提供理论依据。结果表明:(1) FVC在空间上呈现由西向东逐渐减少的趋势,且随着土壤含水量的减少和含盐量的增加而减少。(2) 各土层含水量均呈自上而下逐渐增加的趋势,各土层含盐量均呈自上而下逐渐减少的趋势,且不同深度水盐含量呈中等及以上变异性。(3) 仅10~20 cm土壤含水量、FVC和0~10 cm土壤含水量间有中介效应的存在。深层10~20 cm、10~30 cm和30~50 cm土壤含盐量、FVC和0~10 cm表层土壤含盐量间有中介效应,即深层土壤含盐量通过影响表层土壤含盐量而对FVC产生影响。(4) 0~10 cm表层土壤含盐量对FVC的影响最大,47.90%以上的FVC空间变异会受到该层土壤含盐量的影响,且不同深度土壤含盐量对FVC的影响效果均大于土壤含水量的影响效果。
关键词: 渭干河—库车河三角洲绿洲; 土壤含水量; 土壤含盐量; 植被覆盖度; 相关分析
郑柳娜 , 江红南 , 孙梦婷 . 基于遥感影像的新疆渭干河—库车河三角洲土壤水盐与植被覆盖度的关系[J]. 干旱区研究, 2024 , 41(7) : 1131 -1139 . DOI: 10.13866/j.azr.2024.07.05
Based on the soil samples and remote sensing image data, this paper takes the Ugan-Kuqa River Delta Oasis, a typical arid region in Xinjiang, as the study area. FVC was calculated utilizing the pixel dichotomous model. Inverse distance weight interpolation and statistical analysis methods such as correlation and mediating effect analyses were used to study the impact of soil water content and salinity at depths of 0-50 cm on the spatial changes of FVC. This paper can provide a theoretical basis for optimizing resource allocation and formulating ecological restoration measures in arid areas. The results were: (1) FVC showed a west-east decreasing trend in space, directly proportional to the water content and inversely with the salinity. (2) The water content of each soil layer gradually enhanced from top to bottom, and the salinity revealed an inverse trend, with≥moderate variability in water content and salinity at different depths. (3) The soil water content at the 10-20 cm layer alone exhibited a mediating effect between FVC and the water content of the 0-10 cm surface layer. The salinity in the deeper layers of 10-20, 10-30, and 30-50 cm exhibits a mediating effect between FVC and salinity in the 0-10 cm layer. In other words, the salinity in deeper soil layers influenced FVC by affecting the salinity of the surface soil. (4) The salinity in the 0-10 cm layer most significantly impacted the FVC, influencing>47.90% of the spatial variability of FVC. Additionally, the impact of salinity at various soil depths on FVC surpasses that of water content.
表1 渭—库绿洲各土层含水量和含盐量统计特征Tab. 1 Statistical characteristics of soil water content and soil salinity of each soil layer in the Ugan-Kuqa River Delta Oasis |
| 年份 | 不同土层 | 土壤含水量/% | 变异系数/% | 土壤含盐量/(g·kg-1) | 变异系数/% | ||||||
|---|---|---|---|---|---|---|---|---|---|---|---|
| 最小值 | 最大值 | 均值 | 标准差 | 最小值 | 最大值 | 均值 | 标准差 | ||||
| 2011年 | 0~10 cm | 0.05 | 37.62 | 7.26 | 8.01 | 110.33 | 0.10 | 224.4 | 51.65 | 54.45 | 105.42 |
| 10~30 cm | 1.02 | 47.90 | 15.68 | 8.65 | 55.17 | 0.10 | 27.90 | 5.90 | 5.26 | 89.15 | |
| 30~50 cm | 1.55 | 30.08 | 16.05 | 7.75 | 48.29 | 0.10 | 25.70 | 4.31 | 4.36 | 101.16 | |
| 2021年 | 0~10 cm | 0.61 | 23.99 | 10.73 | 6.51 | 60.68 | 0.10 | 69.70 | 21.56 | 21.25 | 98.55 |
| 10~20 cm | 6.23 | 30.15 | 16.70 | 5.84 | 35.00 | 0.10 | 23.40 | 5.86 | 5.02 | 85.67 | |
表2 渭—库绿洲表层土壤含水量、含盐量与FVC的相关性Tab. 2 The correlation between surface soil water content, soil salinity and FVC in the Ugan-Kuqa River Delta Oasis |
| 变量 | 2011年FVC | 2021年FVC |
|---|---|---|
| 0~10 cm土壤含水量 | 0.394** | 0.488** |
| 0~10 cm土壤含盐量 | -0.587** | -0.584** |
注:**表示在0.01水平上显著相关。下同。 |
表3 渭—库绿洲表层土壤水盐含量与FVC的多类型函数拟合精度(R2)评价Tab. 3 Evaluation of the fitting accuracy (R2) of multiple types of functions for surface soil water content, soil salinity and FVC in the Ugan-Kuqa River Delta Oasis |
| 年份 | 影响因素 | 对数 | 二次多项式回归模型 | 三次多项式回归模型 | |||||
|---|---|---|---|---|---|---|---|---|---|
| R2 | P值 | R2 | P值 | R2 | P值 | ||||
| 2011年 | 0~10 cm土壤含水量 | 0.074 | 0.055 | 0.180 | 0.009** | 0.254 | 0.003** | ||
| 0~10 cm土壤含盐量 | 0.543 | 0.000** | 0.457 | 0.000** | 0.519 | 0.000** | |||
| 2021年 | 0~10 cm土壤含水量 | 0.160 | 0.000** | 0.255 | 0.000** | 0.255 | 0.000** | ||
| 0~10 cm土壤含盐量 | 0.479 | 0.000** | 0.401 | 0.000** | 0.439 | 0.000** | |||
表4 渭—库绿洲深层土壤含水量、含盐量与FVC的偏相关分析Tab. 4 Partial correlation analysis of deep soil water content, soil salinity and FVC in the Ugan-Kuqa River Delta Oasis |
| 2011年 | 2021年 | |||||
|---|---|---|---|---|---|---|
| 控制变量 | 实验变量 | 偏相关系数 | 控制变量 | 实验变量 | 偏相关系数 | |
| 0~10 cm土壤含水量 | r10~30 cm土壤含水量、FVC 0~10 cm土壤含水量 | -0.025 | 0~10 cm土壤含水量 | r10~20 cm土壤含水量、FVC 0~10 cm土壤含水量 | 0.119 | |
| 0~10 cm土壤含水量 | r30~50 cm土壤含水量、FVC 0~10 cm土壤含水量 | -0.210 | 0~10 cm土壤含盐量 | r10~20 cm土壤含盐量、FVC 0~10 cm土壤含盐量 | -0.282* | |
| 0~10 cm土壤含盐量 | r10~30 cm土壤含盐量、FVC 0~10 cm土壤含盐量 | -0.288* | ||||
| 0~10 cm土壤含盐量 | r30~50 cm土壤含盐量、FVC 0~10 cm土壤含盐量 | -0.205 | ||||
注:*表示在0.05水平上显著相关。下同。 |
表5 渭—库绿洲各土层水盐含量与FVC的中介效应Tab. 5 Mediating effect between soil water content and soil salinity in different soil layers and FVC in the Ugan-Kuqa River Delta Oasis |
| 2011年 | 2021年 | |||||||
|---|---|---|---|---|---|---|---|---|
| 检验步骤 | 标准化方程 | 自变量 | P值 | 检验步骤 | 标准化方程 | 自变量 | P值 | |
| 第一步 | FVC=0.135W30 | W30 | 0.349 | 第一步 | FVC=0.403W20 | W20 | 0.000** | |
| 第二步 | W10=0.397W30 | W30 | 0.004** | 第二步 | W10=0.665W20 | W20 | 0.000** | |
| 第三步 | FVC=-0.025W30+0.405W10 | W30 | 0.863 | 第三步 | FVC=0.140W20+0.396W10 | W20 | 0.301 | |
| W10 | 0.008** | W10 | 0.004** | |||||
| 第一步 | FVC=0.019W50 | W50 | 0.896 | 第一步 | FVC=-0.561S20 | S20 | 0.000** | |
| 第二步 | W10=0.478W50 | W50 | 0.00** | 第二步 | S10=0.671S20 | S20 | 0.000** | |
| 第三步 | FVC=-0.220W50+0.499W10 | W50 | 0.148 | 第三步 | FVC=-0.308S20-0.377S10 | S20 | 0.014* | |
| W10 | 0.002** | S10 | 0.003** | |||||
| 第一步 | FVC=-0.571S30 | S30 | 0.000** | |||||
| 第二步 | S10=0.682S30 | S30 | 0.000** | |||||
| 第三步 | FVC=-0.319S30-0.370S10 | S30 | 0.045* | |||||
| S10 | 0.021* | |||||||
| 第一步 | FVC=-0.501S50 | S50 | 0.000** | |||||
| 第二步 | S10=0.624S50 | S50 | 0.000** | |||||
| 第三步 | FVC=-0.210S50-0.468S10 | S50 | 0.163 | |||||
| S10 | 0.003** | |||||||
注:S10、S20、S30、S50分别代表0~10 cm、10~20 cm、10~30 cm、30~50 cm土壤含盐量;W10、W20、W30、W50分别代表0~10 cm、10~20 cm、10~30 cm、30~50 cm土壤含水量。 |
| [1] |
|
| [2] |
|
| [3] |
|
| [4] |
|
| [5] |
高瑜莲, 柳锦宝, 柳维扬, 等. 近14 a新疆南疆绿洲地区地表蒸散与干旱的时空变化特征研究[J]. 干旱区地理, 2019, 42(4): 830-837.
[
|
| [6] |
|
| [7] |
|
| [8] |
|
| [9] |
|
| [10] |
康满萍, 赵成章, 白雪, 等. 苏干湖湿地植被覆盖度时空变化格局[J]. 生态学报, 2020, 40(9): 2975-2984.
[
|
| [11] |
|
| [12] |
|
| [13] |
江红南. 新疆不同区域土壤盐渍化光学遥感定量监测研究[D]. 武汉: 武汉大学, 2018.
[
|
| [14] |
何宝忠, 丁建丽, 刘博华, 等. 渭库绿洲土壤盐渍化时空变化特征[J]. 林业科学, 2019, 55(9): 185-196.
[
|
| [15] |
|
| [16] |
|
| [17] |
李苗苗. 植被覆盖度的遥感估算方法研究[D]. 北京: 中国科学院研究生院(遥感应用研究所), 2003.
[
|
| [18] |
边慧芹. 渭干河-库车河三角洲绿洲植被覆盖度与土壤盐渍化响应关系研究[D]. 乌鲁木齐: 新疆师范大学, 2020.
[
|
| [19] |
温忠麟, 叶宝娟. 中介效应分析: 方法和模型发展[J]. 心理科学进展, 2014, 22(5): 731-745.
[
|
| [20] |
|
/
| 〈 |
|
〉 |