
河西走廊东部不同气候态气温变化及其对气候评价的影响
|
杨晓玲(1971-),女,高级工程师,主要从事天气预报及气候变化研究. E-mail: wwqxj6150343@163.com |
收稿日期: 2024-02-18
修回日期: 2024-05-12
网络出版日期: 2025-08-14
基金资助
国家自然科学基金(42175192)
国家自然科学基金(41975015)
国家自然科学基金(41775107)
Temperature in different climate states and their influence on climate evaluation in the Hexi Corridor Eastern
Received date: 2024-02-18
Revised date: 2024-05-12
Online published: 2025-08-14
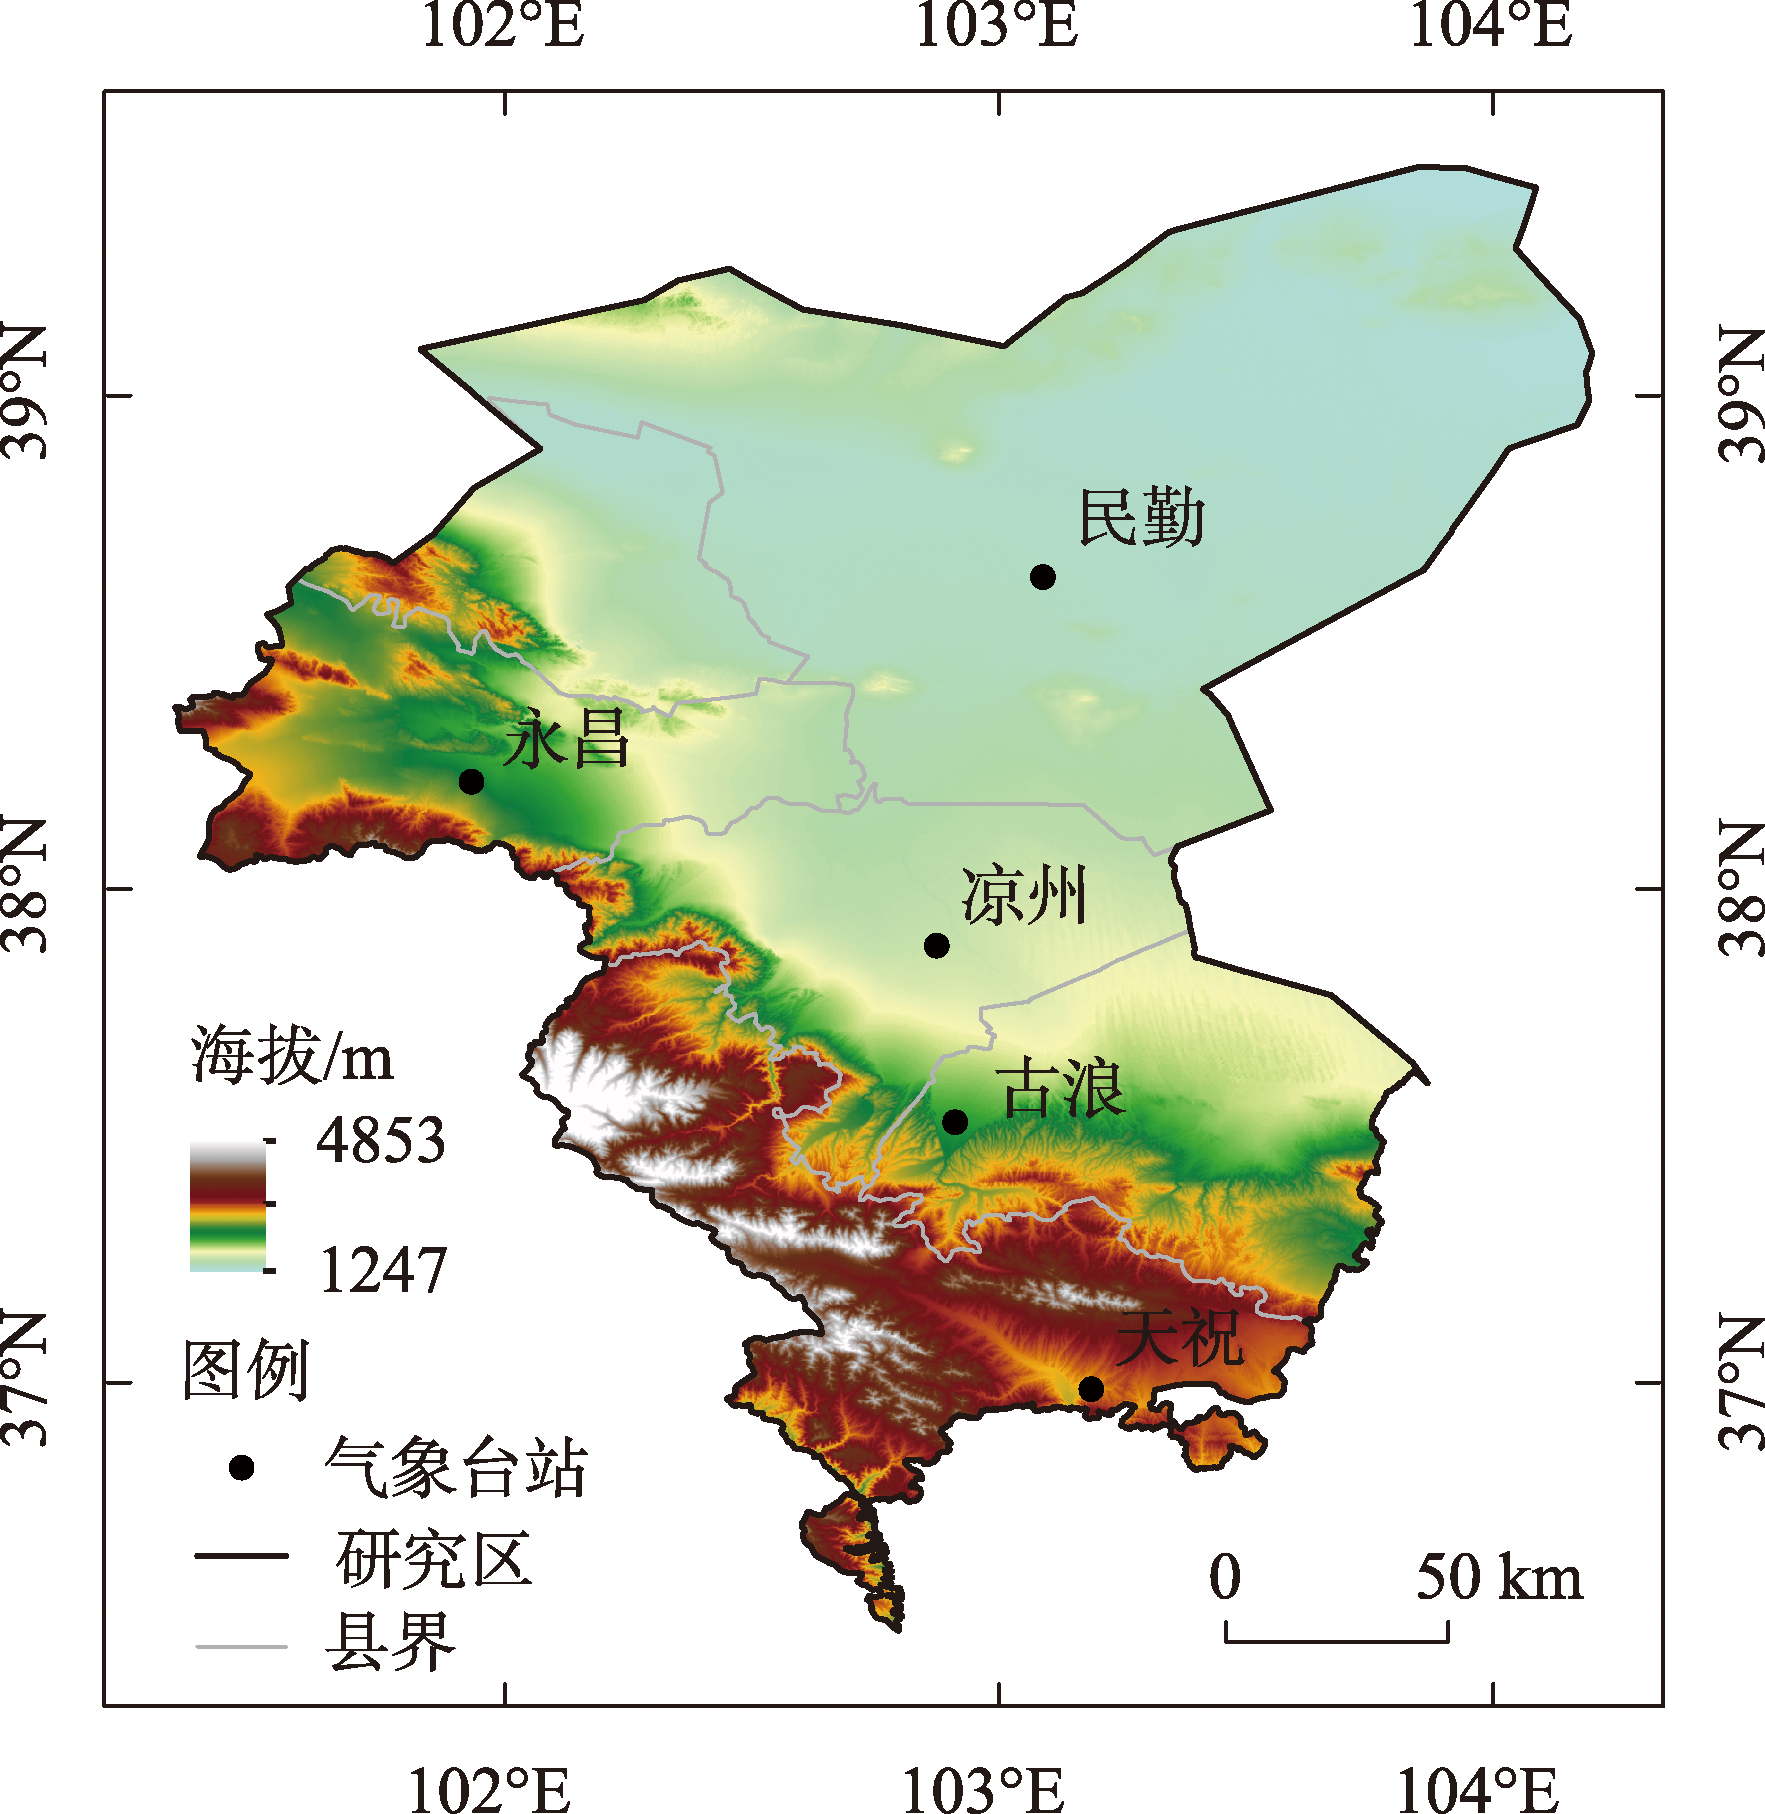
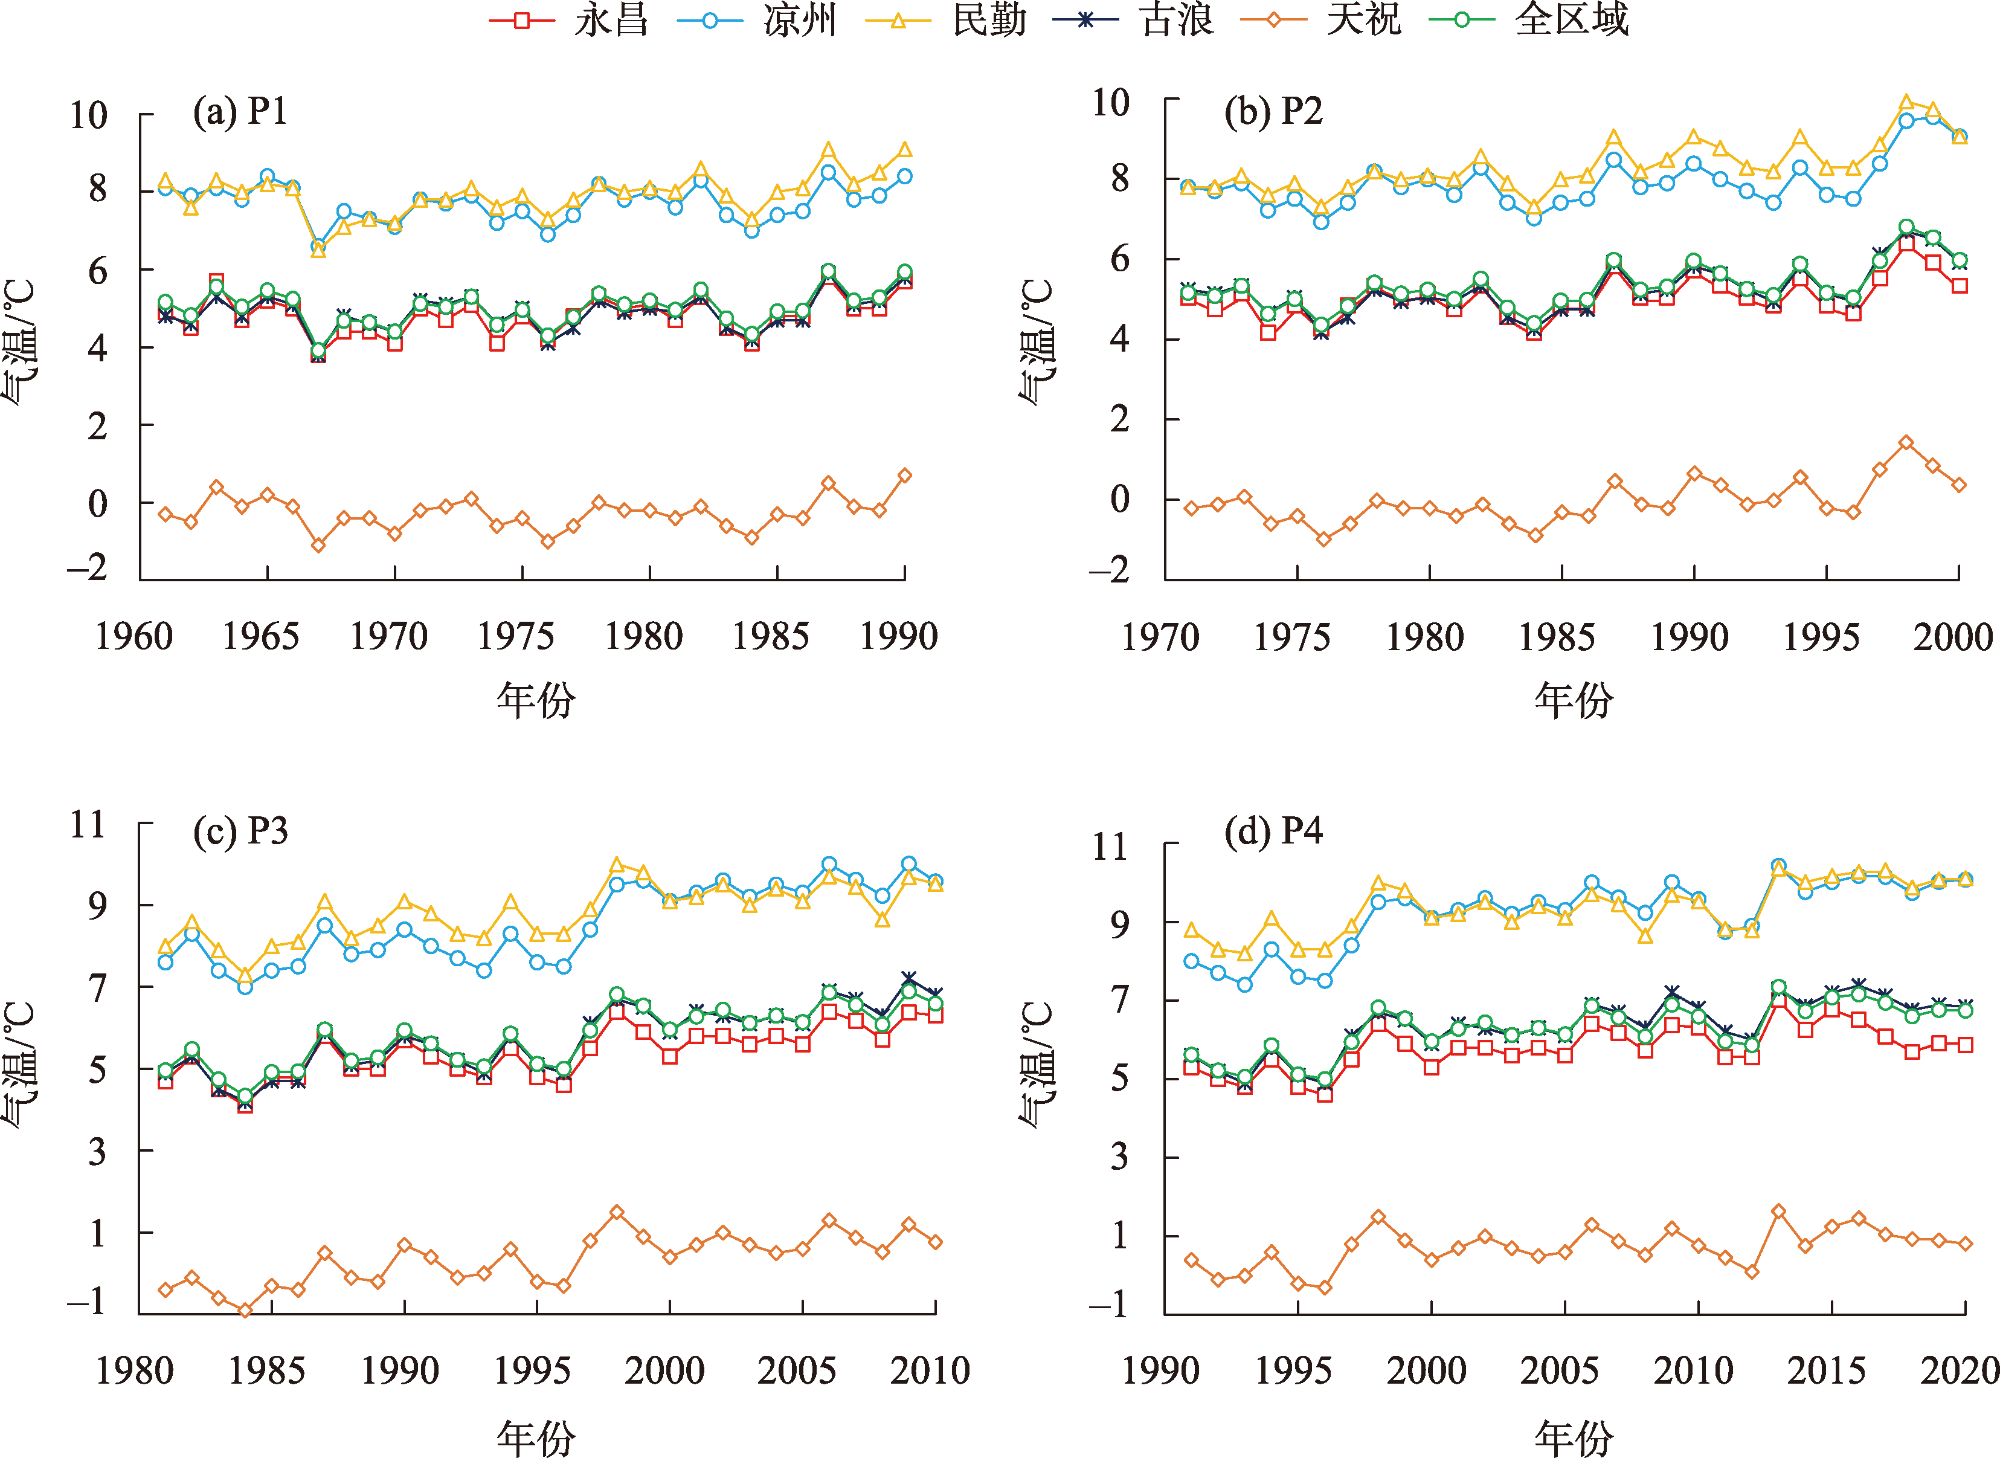
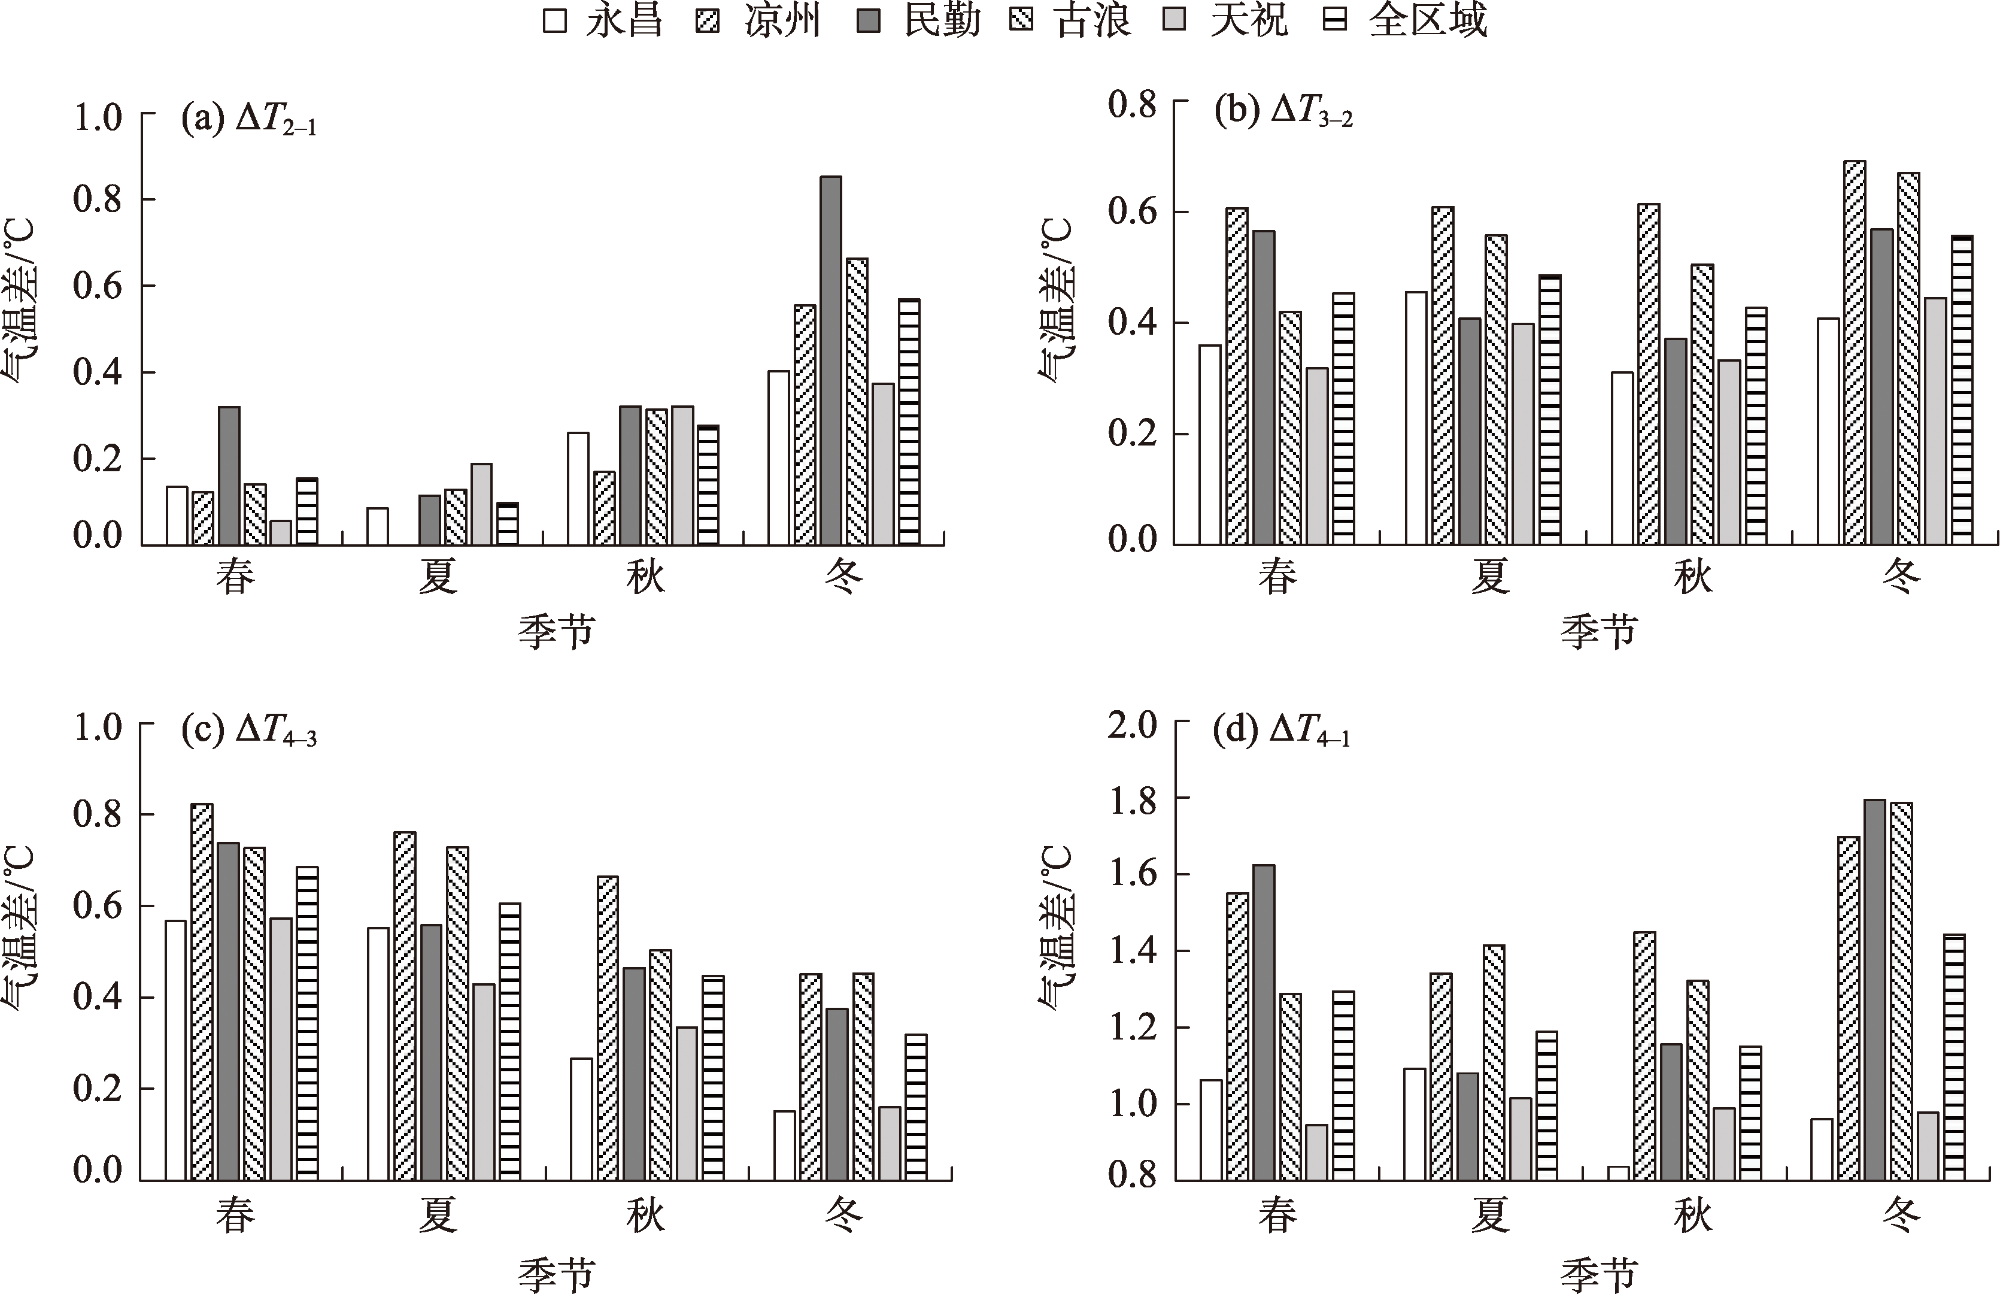
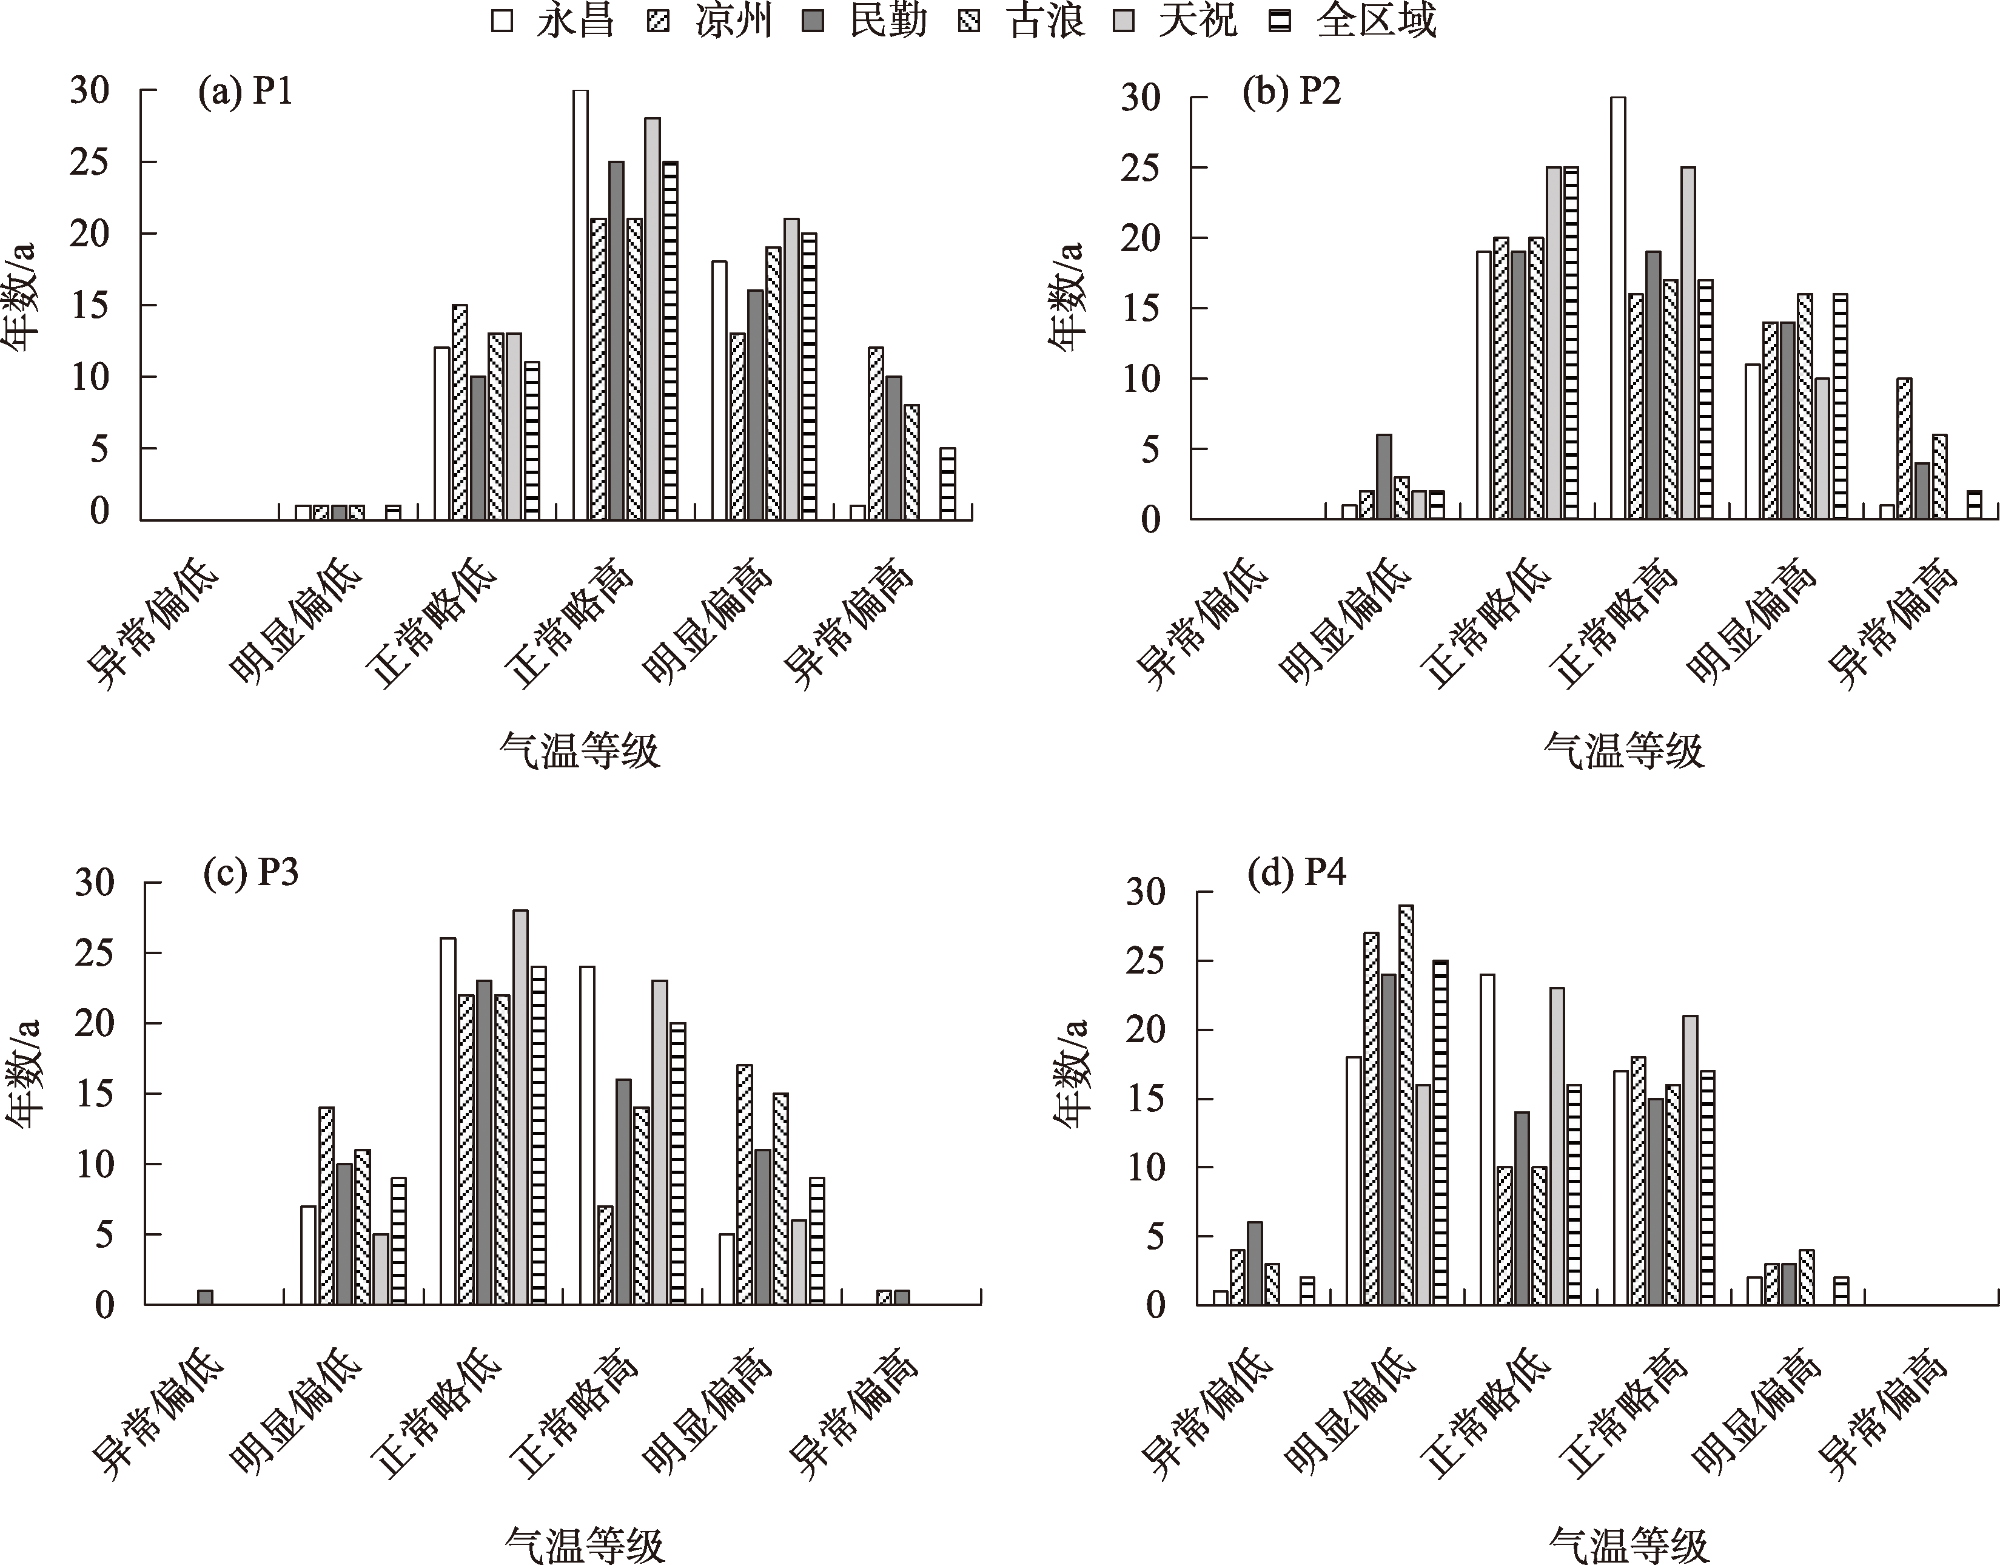
河西走廊东部是气候变化的敏感区,其气候态的更替对气候评价影响较大。采用河西走廊东部5个国家气象站的1961─2022年逐月气温数据,对比分析河西走廊东部1961─1990年、1971─2000年、1981─2010年和1991─2020年4个气候态气温的差异及其对气候业务评价的影响。结果表明:全区域及各地4个气候态年平均气温均呈升高趋势,P2(1971—2000年气候态)~P4(1991—2020年气候态)气温升高趋势均极显著。从4个气候态气温的差值来看,全区域及各地年、季、月气温基本一致升温,除P3(1981—2010年气候态)和P4外,其他气候态表现为冬季升幅最大,夏季升幅最小,各月升温差异较大,同一季度、同一月份气温升幅存在明显空间差异。气候态平均值更替后,河西走廊东部气温距平明显偏大的特征弱化了,其等级由正距平向负距平方向调整,P1(1961—1990年气候态)~P4年平均气温评价等级高达56%~87%向偏低一级转变,冷冬年份增多17~28 a,暖冬年份减少15~23 a。本研究将为了解河西走廊东部气温的变化规律以及气候业务、决策服务和气象科学研究提供参考依据。
杨晓玲 , 周华 , 陈静 , 赵慧华 , 吴雯 . 河西走廊东部不同气候态气温变化及其对气候评价的影响[J]. 干旱区研究, 2024 , 41(7) : 1089 -1098 . DOI: 10.13866/j.azr.2024.07.01
Hexi Corridor Eastern is an area sensitive to changes in climate and climate states, greatly affecting climate evaluation. Using the monthly temperature data of five national meteorological stations in Hexi Corridor Eastern from 1961 to 2022, differences in the average temperatures of four climate states, including 1961-1990, 1971-2000, 1981-2010 and 1991-2020 were compared, and their influence on the climate assessment business was analyzed. The results showed that the annual temperatures of the four climate states increased in various and whole regions, most notably in the P2 (1971-2000) and P4 (1991-2020) states. The temperature differences in the climate states revealed the following: (1) the monthly, seasonal, and yearly temperatures consistently warmed up in the whole basin and various regions, and (2) except for the P3 (1981-2010) to P4 climate states, others showed maximal and minimal elevation in winter and summer, respectively. The monthly variations in enhanced temperatures were apparent, and the growth rate demonstrated obvious spatial differences in the same season and month. After the replacement of the climate state means, the conspicuous characteristics of temperature variations were weakened in the Hexi Corridor Eastern, and their grades were adjusted from positive to negative; temperature rating was as high as 56%-87% to a lower level; the cold winter years increased by 17-28 years, and the warm winter years reduced by 15-23 years from P1(1961-1990) to P4 climate states. This study can provide a reference for understanding temperature changes, climate business, decision-making service, and meteorological science research in Hexi Corridor Eastern.
表1 气温评价标准及等级Tab. 1 Evaluation criteria and grades of temperature |
| 序号 | 评价标准/℃ | 等级 |
|---|---|---|
| 1 | ΔA≤-2.0 | 异常偏低 |
| 2 | -2.0<ΔA≤-1.0 | 明显偏低 |
| 3 | -1.0<ΔA<0.0 | 正常略低 |
| 4 | 0.0≤ΔA<1.0 | 正常略高 |
| 5 | 1.0≤ΔA<2.0 | 明显偏高 |
| 6 | ΔA≥2.0 | 异常偏高 |
表2 河西走廊东部4个气候态年平均气温的均值、气候倾向率、趋势系数及气候倾向率的差Tab. 2 Mean value and climate tendency rate and trend coefficient and difference of climate tendency of annual average temperature of four climatic states in Hexi Corridor Eastern |
| 项目 | 永昌 | 凉州 | 民勤 | 古浪 | 天祝 | 全区域 | |
|---|---|---|---|---|---|---|---|
| 均值(T1)/℃ | 4.8 | 7.7 | 7.9 | 4.9 | -0.3 | 5.0 | |
| 倾向率(a1)/[℃·(10a)-1] | 0.139 | 0.029 | 0.272 | 0.127 | 0.064 | 0.126 | |
| 趋势系数 | 0.250 | 0.054 | 0.433** | 0.244 | 0.137 | 0.243 | |
| 均值(T2)/℃ | 5.0 | 7.9 | 8.3 | 5.2 | 0.0 | 5.3 | |
| 倾向率(a2)/[℃·(10a)-1] | 0.298 | 0.407 | 0.548 | 0.418 | 0.385 | 0.411 | |
| 趋势系数 | 0.505* | 0.551* | 0.739* | 0.594* | 0.612* | 0.621* | |
| 均值(T3)/℃ | 5.4 | 8.5 | 8.8 | 5.7 | 0.3 | 5.8 | |
| 倾向率(a3)/[℃·(10a)-1] | 0.412 | 0.792 | 0.541 | 0.626 | 0.293 | 0.533 | |
| 趋势系数 | 0.629* | 0.795* | 0.719* | 0.787* | 0.523* | 0.736* | |
| 均值(T4)/℃ | 5.8 | 9.2 | 9.4 | 6.3 | 0.7 | 6.3 | |
| 倾向率(a4)/[℃·(10a)-1] | 0.528 | 0.894 | 0.554 | 0.770 | 0.519 | 0.653 | |
| 趋势系数 | 0.750* | 0.842* | 0.730* | 0.844* | 0.753* | 0.810* | |
| Δa2-1/[℃·(10a)-1] | 0.159 | 0.378 | 0.276 | 0.291 | 0.321 | 0.285 | |
| Δa3-2/[℃·(10a)-1] | 0.114 | 0.385 | -0.007 | 0.208 | -0.092 | 0.122 | |
| Δa4-3/[℃·(10a)-1] | 0.116 | 0.102 | 0.013 | 0.144 | 0.226 | 0.120 | |
| Δa4-1/[℃·(10a)-1] | 0.389 | 0.865 | 0.282 | 0.643 | 0.455 | 0.527 | |
注:Δa2-1是P2的倾向率(a2)减去P1的倾向率(a1)的差,依次类推;Δa4-1是P4的倾向率(a4)减去P1的倾向率(a1)的差。**、*分别表示趋势系数通过了α=0.05、0.01显著性水平检验。 |
表3 河西走廊东部4个气候态年平均气温的差Tab. 3 Difference of annual average temperature of four climatic states in Hexi Corridor Eastern /℃ |
| 差值 | 永昌 | 凉州 | 民勤 | 古浪 | 天祝 | 全区域 |
|---|---|---|---|---|---|---|
| ΔT2-1 | 0.2 | 0.2 | 0.4 | 0.3 | 0.2 | 0.3 |
| ΔT3-2 | 0.4 | 0.6 | 0.5 | 0.5 | 0.4 | 0.5 |
| ΔT4-3 | 0.4 | 0.7 | 0.5 | 0.6 | 0.4 | 0.5 |
| ΔT4-1 | 1.0 | 1.5 | 1.4 | 1.5 | 1.0 | 1.3 |
注:ΔT2-1是T2减去T1的差,依次类推;ΔT4-1是T4减去T1的差。下同。 |
表4 河西走廊东部4个气候态月气温的差Tab. 4 Monthly temperature difference of four climate states in Hexi Corridor Eastern /℃ |
| 差值 | 站点 | 1月 | 2月 | 3月 | 4月 | 5月 | 6月 | 7月 | 8月 | 9月 | 10月 | 11月 | 12月 |
|---|---|---|---|---|---|---|---|---|---|---|---|---|---|
| ΔT2-1 | 永昌 | 0.2 | 0.6 | 0.1 | 0.4 | -0.1 | -0.1 | 0.1 | 0.2 | 0.4 | -0.1 | 0.5 | 0.4 |
| 凉州 | 0.3 | 0.7 | 0.1 | 0.3 | -0.1 | -0.1 | 0.0 | 0.0 | 0.2 | -0.1 | 0.4 | 0.7 | |
| 民勤 | 0.6 | 1.0 | 0.4 | 0.5 | 0.1 | 0.1 | 0.1 | 0.1 | 0.2 | 0.1 | 0.6 | 1.0 | |
| 古浪 | 0.5 | 0.8 | 0.2 | 0.3 | 0.0 | 0.2 | 0.2 | 0.0 | 0.3 | 0.0 | 0.6 | 0.7 | |
| 天祝 | 0.2 | 0.5 | 0.1 | 0.2 | -0.1 | 0.2 | 0.2 | 0.1 | 0.4 | -0.1 | 0.7 | 0.4 | |
| 全区域 | 0.4 | 0.7 | 0.2 | 0.3 | 0.0 | 0.1 | 0.1 | 0.1 | 0.3 | 0.0 | 0.5 | 0.6 | |
| ΔT3-2 | 永昌 | 0.3 | 0.7 | 0.5 | 0.3 | 0.2 | 0.5 | 0.6 | 0.3 | 0.3 | 0.3 | 0.3 | 0.2 |
| 凉州 | 0.6 | 1.0 | 0.8 | 0.5 | 0.5 | 0.8 | 0.7 | 0.3 | 0.5 | 0.7 | 0.7 | 0.4 | |
| 民勤 | 0.4 | 0.9 | 0.7 | 0.4 | 0.5 | 0.6 | 0.5 | 0.1 | 0.2 | 0.4 | 0.5 | 0.4 | |
| 古浪 | 0.6 | 1.0 | 0.6 | 0.3 | 0.3 | 0.7 | 0.7 | 0.3 | 0.4 | 0.5 | 0.6 | 0.4 | |
| 天祝 | 0.4 | 0.7 | 0.5 | 0.2 | 0.2 | 0.5 | 0.5 | 0.2 | 0.4 | 0.2 | 0.4 | 0.2 | |
| 全区域 | 0.5 | 0.9 | 0.6 | 0.4 | 0.4 | 0.6 | 0.6 | 0.3 | 0.4 | 0.4 | 0.5 | 0.3 | |
| ΔT4-3 | 永昌 | 0.0 | 0.5 | 0.8 | 0.7 | 0.2 | 0.6 | 0.6 | 0.4 | 0.2 | 0.3 | 0.3 | -0.1 |
| 凉州 | 0.3 | 0.8 | 1.1 | 0.8 | 0.5 | 1.0 | 0.7 | 0.6 | 0.6 | 0.7 | 0.7 | 0.3 | |
| 民勤 | 0.2 | 0.7 | 1.0 | 0.8 | 0.4 | 0.7 | 0.5 | 0.5 | 0.4 | 0.4 | 0.6 | 0.3 | |
| 古浪 | 0.3 | 0.8 | 1.1 | 0.8 | 0.3 | 0.8 | 0.8 | 0.6 | 0.4 | 0.5 | 0.7 | 0.2 | |
| 天祝 | 0.0 | 0.6 | 0.8 | 0.7 | 0.2 | 0.5 | 0.4 | 0.4 | 0.3 | 0.3 | 0.3 | -0.1 | |
| 全区域 | 0.1 | 0.7 | 1.0 | 0.8 | 0.3 | 0.7 | 0.6 | 0.5 | 0.4 | 0.4 | 0.5 | 0.1 | |
| ΔT4-1 | 永昌 | 0.5 | 1.9 | 1.5 | 1.4 | 0.3 | 1.0 | 1.3 | 0.9 | 0.9 | 0.5 | 1.1 | 0.6 |
| 凉州 | 1.2 | 2.5 | 2.0 | 1.7 | 1.0 | 1.7 | 1.4 | 0.8 | 1.3 | 1.3 | 1.8 | 1.4 | |
| 民勤 | 1.2 | 2.6 | 2.2 | 1.7 | 1.0 | 1.5 | 1.1 | 0.7 | 0.8 | 1.0 | 1.6 | 1.6 | |
| 古浪 | 1.4 | 2.6 | 1.8 | 1.4 | 0.7 | 1.6 | 1.6 | 1.0 | 1.1 | 1.0 | 1.9 | 1.3 | |
| 天祝 | 0.6 | 1.9 | 1.4 | 1.1 | 0.4 | 1.1 | 1.1 | 0.7 | 1.1 | 0.5 | 1.4 | 0.5 | |
| 全区域 | 1.0 | 2.3 | 1.8 | 1.5 | 0.7 | 1.4 | 1.3 | 0.8 | 1.0 | 0.8 | 1.6 | 1.1 |
图4 河西走廊东部4个气候态年平均气温等级评价年数变化Fig. 4 Years change of annual average temperature grade evaluation of four climate states in Hexi Corridor Eastern |
表5 河西走廊东部气候态更替后气温等级偏离气候平均值的年数Tab. 5 Years of temperature grade deviation from climate average after climate states supersedure in Hexi Corridor Eastern /a |
| 气候态 | 永昌 | 凉州 | 民勤 | 古浪 | 天祝 | 全区域 |
|---|---|---|---|---|---|---|
| P1~P2 | 6 | 7 | 17 | 10 | 12 | 12 |
| P2~P3 | 8 | 12 | 5 | 4 | 4 | 6 |
| P3~P4 | 14 | 4 | 10 | 12 | 12 | 12 |
| P1~P4 | 28 | 23 | 32 | 26 | 28 | 30 |
表6 河西走廊东部4个气候态下冷暖冬年数Tab. 6 Years of cold and warm winter of four climate states in Hexi Corridor Eastern /a |
| 气候态 | 永昌 | 凉州 | 民勤 | 古浪 | 天祝 | 全区域 | |
|---|---|---|---|---|---|---|---|
| 冷冬年数 | P1 | 10 | 6 | 10 | 14 | 14 | 11 |
| P2 | 18 | 22 | 20 | 19 | 21 | 19 | |
| P3 | 30 | 30 | 31 | 28 | 28 | 29 | |
| P4 | 34 | 33 | 38 | 31 | 33 | 35 | |
| 暖冬年数 | P1 | 34 | 33 | 38 | 30 | 34 | 34 |
| P2 | 28 | 26 | 26 | 23 | 26 | 25 | |
| P3 | 17 | 19 | 17 | 16 | 17 | 17 | |
| P4 | 13 | 14 | 15 | 15 | 13 | 15 | |
| [1] |
世界气象组织. WMO气候平均值计算指南[R]. 瑞士日内瓦: 主席出版物委员会, 2017.
[World Meteorological Organization. WMO Guidelines on the Calculation of Climate Mean[R]. Switzerland Geneva: Chairperson Publications Board, 2017.]
|
| [2] |
中国气象局预报与网络司. 《关于做好气候业务中气候平均值更新工作的通知》[Z]. 北京: 中国气象局, 2021.
[Forecast and network department of China Meteorological Administration. Notice on updating the climate average value in climate business[Z]. Beijing: China Meteorological Administration, 2021.]
|
| [3] |
王永光. 多年平均值的改变对中国气候业务的影响[J]. 气象, 2002, 28(8): 41-43.
[
|
| [4] |
王秀文, 李月安. 新气候平均值在中期预报业务中的应用[J]. 气象, 2003, 29(1): 43-45.
[
|
| [5] |
林婧婧, 张强. 中国气候态变化特征及其对气候变化分析的影响[J]. 高原气象, 2015, 34(6): 1593-1600.
[
|
| [6] |
梅梅, 侯威, 周星妍. 新、旧气候态差异及对中国地区气候和极端事件评估业务的影响[J]. 气候变化研究进展, 2022, 18(6): 653-669.
[
|
| [7] |
晏红明, 袁媛, 王永光. 气候变暖背景下气候平均值更替对中国气候业务的影响[J]. 气象, 2022, 48(3): 284-298.
[
|
| [8] |
房一禾, 赵春雨, 王颖, 等. 新、旧气候态的差异及对东北地区气候业务的影响[J]. 气候变化研究进展, 2016, 12(3): 193-201.
[
|
| [9] |
张萌萌, 赵春雨, 房一禾, 等. 基于新气候态背景的中国东北地区气候变化评估与预测研究[J]. 气象与环境学报, 2023, 39(4): 95-102.
[
|
| [10] |
王劲廷, 马振峰, 杨小波, 等. 新旧气候平均值的差异及其对西南气候业务的影响[J]. 高原山地气象研究, 2014, 34(1): 46-50.
[
|
| [11] |
邓彪, 王顺久, 王春学, 等. 1991-2020年四川省气候平均值的变化及业务应用评估[J]. 高原山地气象研究, 2023, 43(2): 90-95.
[
|
| [12] |
雷向杰, 黄祖英, 田武文, 等. 两个30年气候平均值的差异及其对气候业务的影响[J]. 气象科技, 2005, 33(2): 124-127.
[
|
| [13] |
刘桂芳, 卢鹤立. 全球变暖背景下的中国西部地区气候变化研究进展[J]. 气象与环境科学, 2009, 32(4): 69-73.
[
|
| [14] |
马鹏里, 杨金虎, 卢国阳, 等. 西北地区东部气候的转折性变化[J]. 高原气象, 2020, 39(4): 840-850.
[
|
| [15] |
李明, 孙洪泉, 苏志诚. 中国西北气候干湿变化研究进展[J]. 地理研究, 2021, 40(4): 1180-1194.
[
|
| [16] |
张强, 朱彪, 杨金虎, 等. 西北地区气候湿化趋势的新特征[J]. 科学通报, 2021, 66(增刊): 3757-3771.
[
|
| [17] |
张婧莉, 吴秀兰, 姚俊强, 等. 新、旧气候态的差异及其对新疆气候评价业务的影响[J]. 沙漠与绿洲气象, 2023, 17(5): 134-140.
[
|
| [18] |
孙爽, 高原, 裴宇航, 等. 黑龙江省1981-2010年气候平均值的变化对气候评价的影响[J]. 黑龙江气象, 2014, 31(2): 1-3.
[
|
| [19] |
梁茹雪, 李茜, 张丽君. 新旧气候平均值更替对陕西气候业务的影响[J]. 沙漠与绿洲气象, 2023, 17(4): 111-117.
[
|
| [20] |
黄彩婷, 董保华, 赵冠男, 等. 新旧气候态的差异及其对江西气候业务的影响[J], 气象与减灾研究, 2023, 6(2): 89-91.
[
|
| [21] |
杨晓玲, 丁文魁, 杨金虎, 等. 河西走廊东部近50年气候变化特征及区内5站对比分析[J]. 干旱地区农业研究, 2011, 29(5): 259-268.
[
|
| [22] |
李玲萍, 杨永龙, 钱莉. 石羊河流域近45年气温和降水特征分析[J]. 干旱区研究, 2008, 25(5): 705-710.
[
|
| [23] |
丁贞玉, 马金珠, 张宝军, 等. 近50年来石羊河流域气候变化趋势分析[J]. 干旱区研究, 2007, 24(6): 779-784.
[
|
| [24] |
魏邦宪, 苗婷, 雷瑜, 等. 石羊河流域气候变化特征及干旱变化趋势分析[J]. 现代农业科技, 2017(15): 220-222.
[
|
| [25] |
白肇烨, 徐国昌, 孙学筠, 等. 中国西北天气[M]. 北京: 气象出版社, 1991: 258-357.
[
|
| [26] |
魏凤英. 现代气候统计诊断与预测技术[M]. 北京: 气象出版社, 2007: 37-41.
[
|
| [27] |
施能, 陈家其, 屠其璞. 中国近100年来4个年代际的气候变化特征[J]. 气象学报, 1995, 53(4): 431-439.
[
|
| [28] |
|
| [29] |
中国气象局. 《短期气候预测质量评定暂行办法》[Z]. 北京: 中国气象局, 1999.
[China Meteorological Administration. Interim measures for quality assessment of short-term climate forecasting[Z]. Beijing: China Meteorological Administration, 1999.]
|
| [30] |
中华人民共和国国家质量监督检验检疫总局, 中国国家标准化管理委员会. 冷冬等级(GB/T 33675—2017)[S]. 北京: 中国标准出版社, 2017.
[General Administration of Quality Supervision, Inspection and Quarantine of the People’s Republic of China, Standardization Administration of the People’s Republic of China, SAC. Cold Winter Grade (GB/T 33675—2017)[S]. Beijing: China Standards Press, 2017.]
|
| [31] |
中华人民共和国国家市场监督管理总局, 中国国家标准化管理委员会. 暖冬等级(GB/T 21983—2020)[S]. 北京: 中国标准出版社, 2020.
[The State Administration for Market Regulation of the People’s Republic of China, Standardization Administration of the People’s Republic of China, SAC. Warm Winter Grade (GB/T 21983—2020) [S]. Beijing: China Standards Press, 2020.]
|
| [32] |
姚俊强, 李漠岩, 迪丽努尔·托列吾别克, 等. 不同时间尺度下新疆气候“暖湿化”特征[J]. 干旱区研究, 2022, 39(2): 333-346.
[
|
| [33] |
白素琴. 不同气候平均值对气候评价业务的影响[J]. 沙漠与绿洲气象, 2016, 10(1): 88-94.
[
|
| [34] |
中国气象局气候变化中心. 中国气候变化蓝皮书2020[M]. 北京: 科学出版社, 2020: 8.
[The Climate Change Center of China Meteorological Administration. China Blue Book on Climate Change 2020[M]. Beijing: Science Press, 2020: 8.]
|
| [35] |
刘芸芸, 王永光, 柯宗健. 2020年夏季我国气候异常特征及成因分析[J]. 气象, 2021, 47(1): 117-126.
[
|
| [36] |
吴立新. 气候变暖背景下全球平均海洋环流在加速[J]. 中国科学: 地球科学, 2020, 50(7): 1021-1022.
[
|
| [37] |
雷杨娜. 中国近50年夏季高温时空变化特征及其影响因子分析[D]. 北京: 北京师范大学, 2009.
[
|
| [38] |
杨若子. 东北地区玉米低温冷害指标及其风险研究[D]. 北京: 中国气象科学研究院, 2012.
[
|
/
| 〈 |
|
〉 |