
基于GEE的干旱区县域生态环境质量时空变化及驱动力分析——以阿拉善左旗为例
|
李琪(1995-),男,硕士研究生,主要从事生态环境遥感监测研究. E-mail: 176924194@qq.com |
收稿日期: 2024-08-15
修回日期: 2024-12-17
网络出版日期: 2025-08-13
基金资助
中国科学院“西部青年学者”重点项目([2020]82)
内蒙古自治区关键技术攻关项目(2020GG0306)
阿拉善盟科技计划项目(AMY2020-18)
甘肃省自然科学基金项目(21JR7RA038)
阿拉善盟林业和草原局自选项目(2021LC0001)
Spatial-temporal variation and driving forces analysis of ecological environment quality in arid counties based on GEE: A case study of Alxa Left Banner
Received date: 2024-08-15
Revised date: 2024-12-17
Online published: 2025-08-13
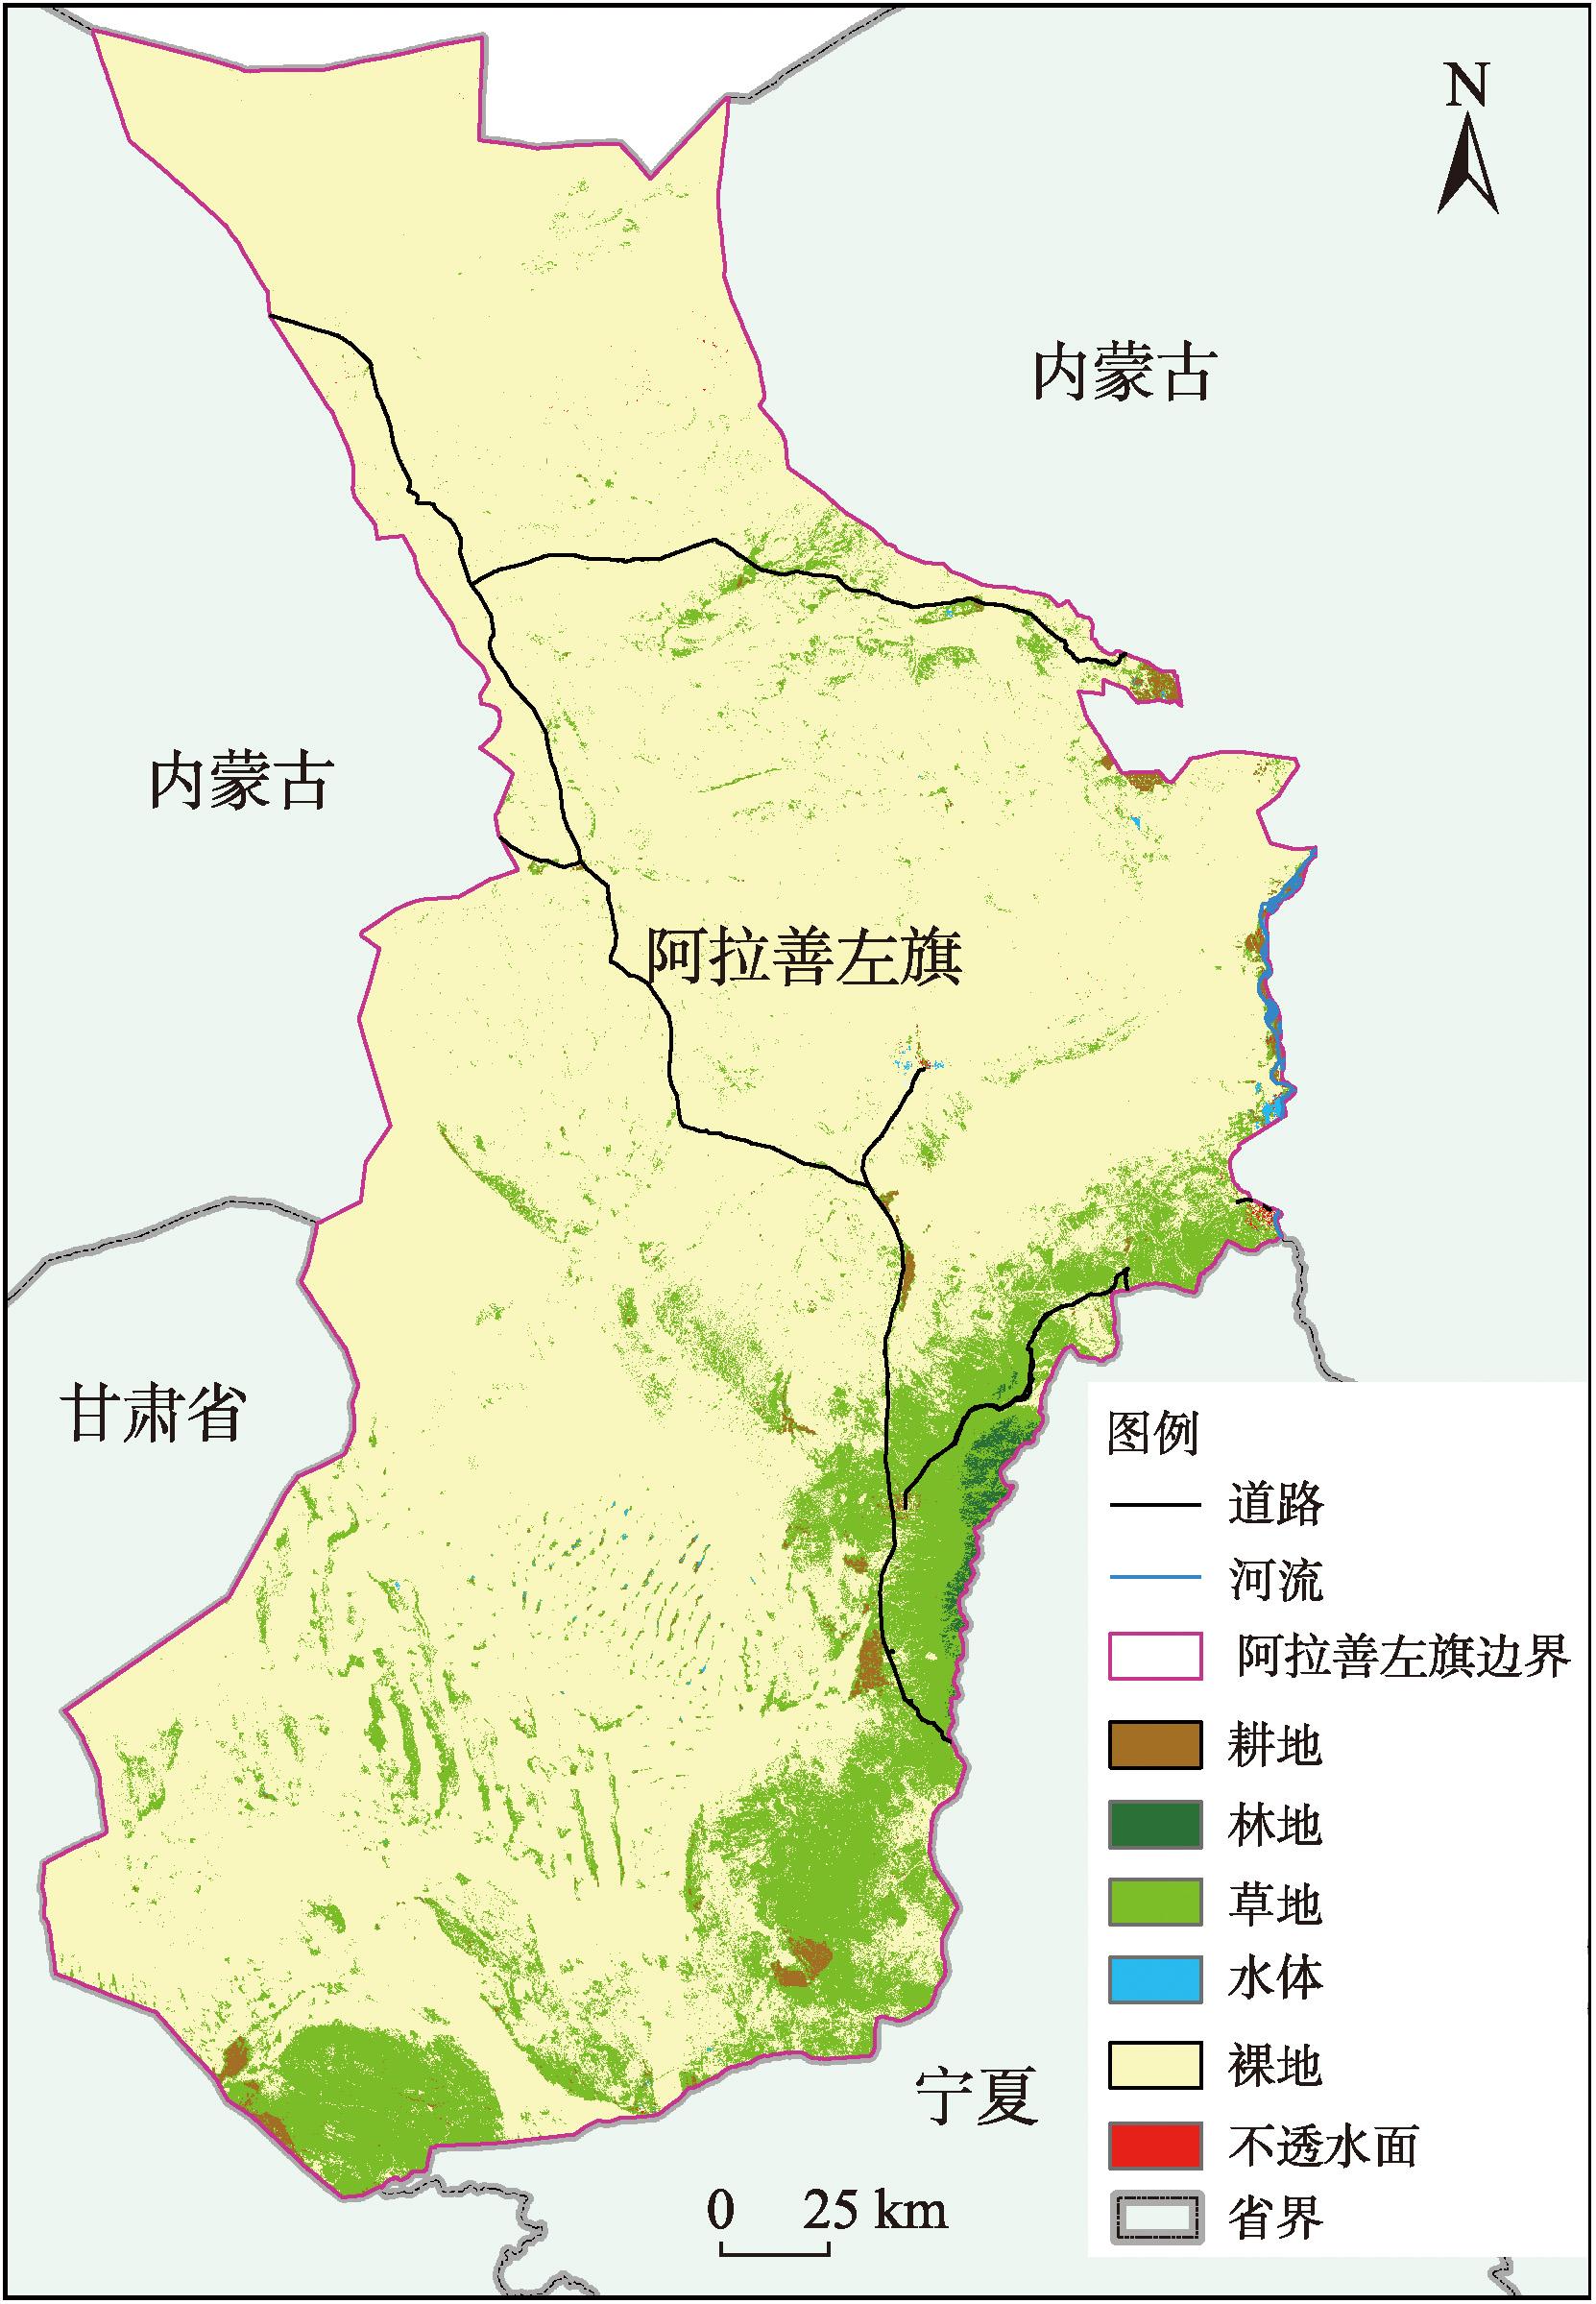
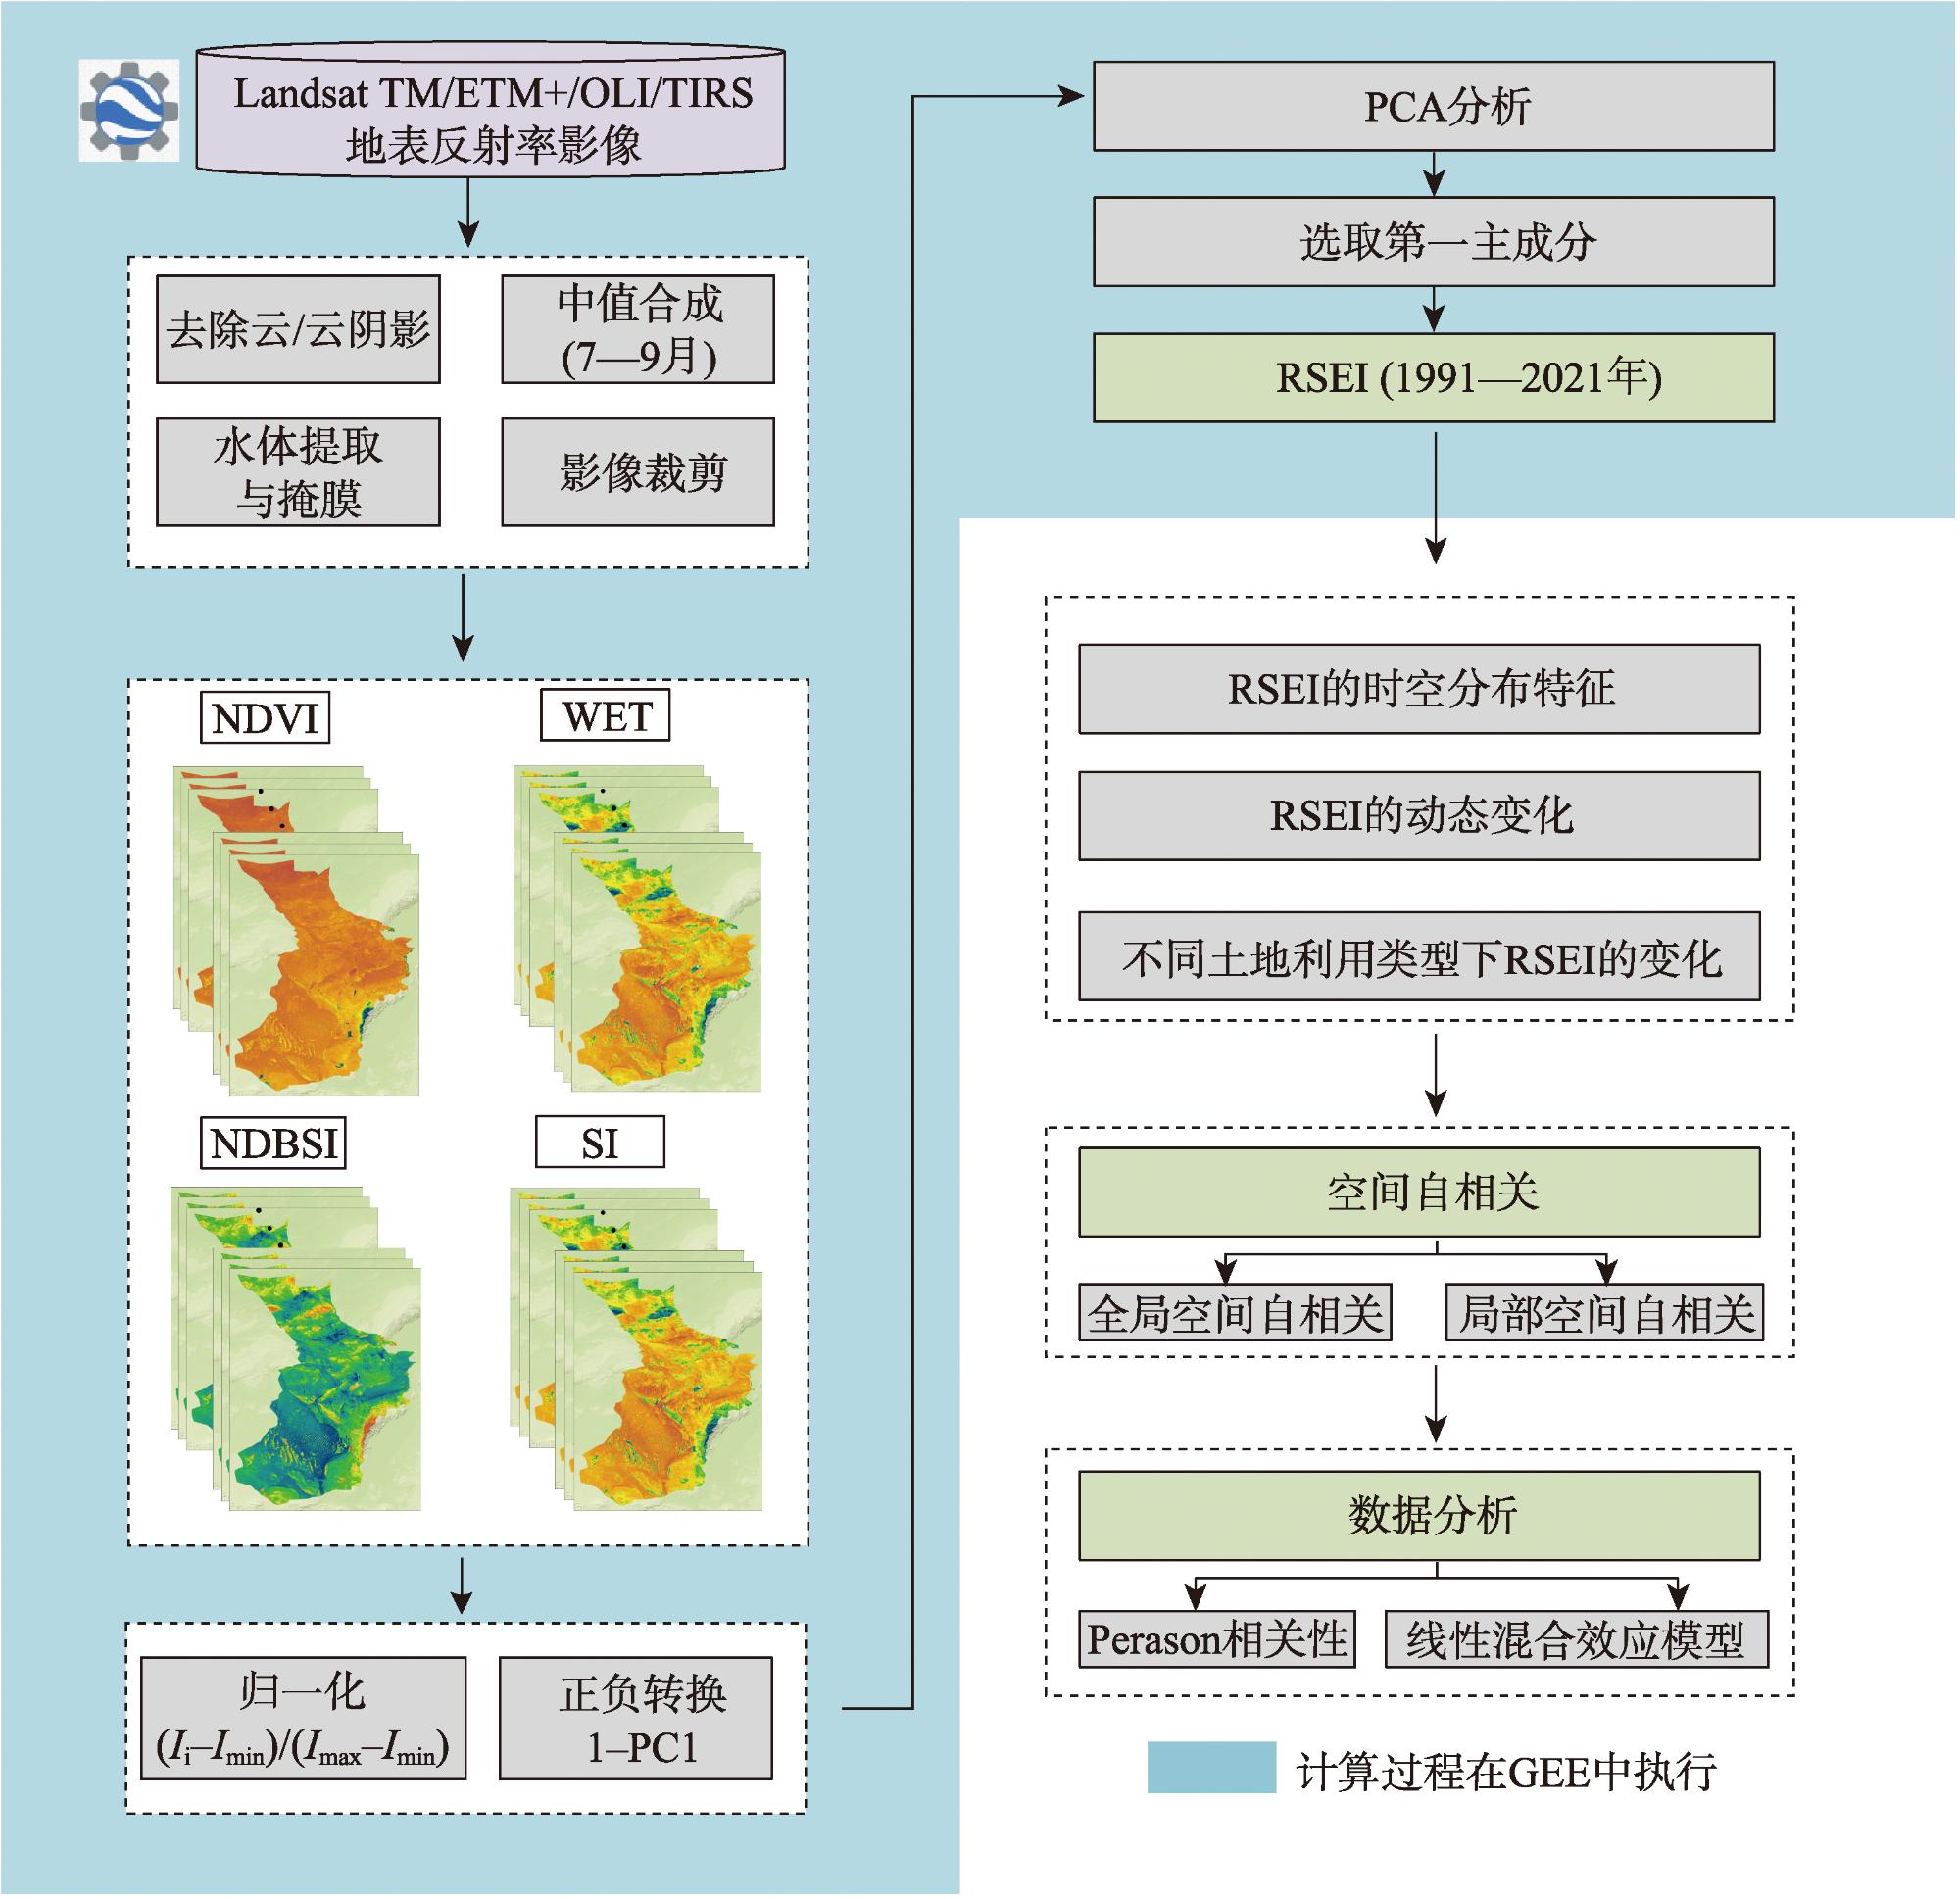
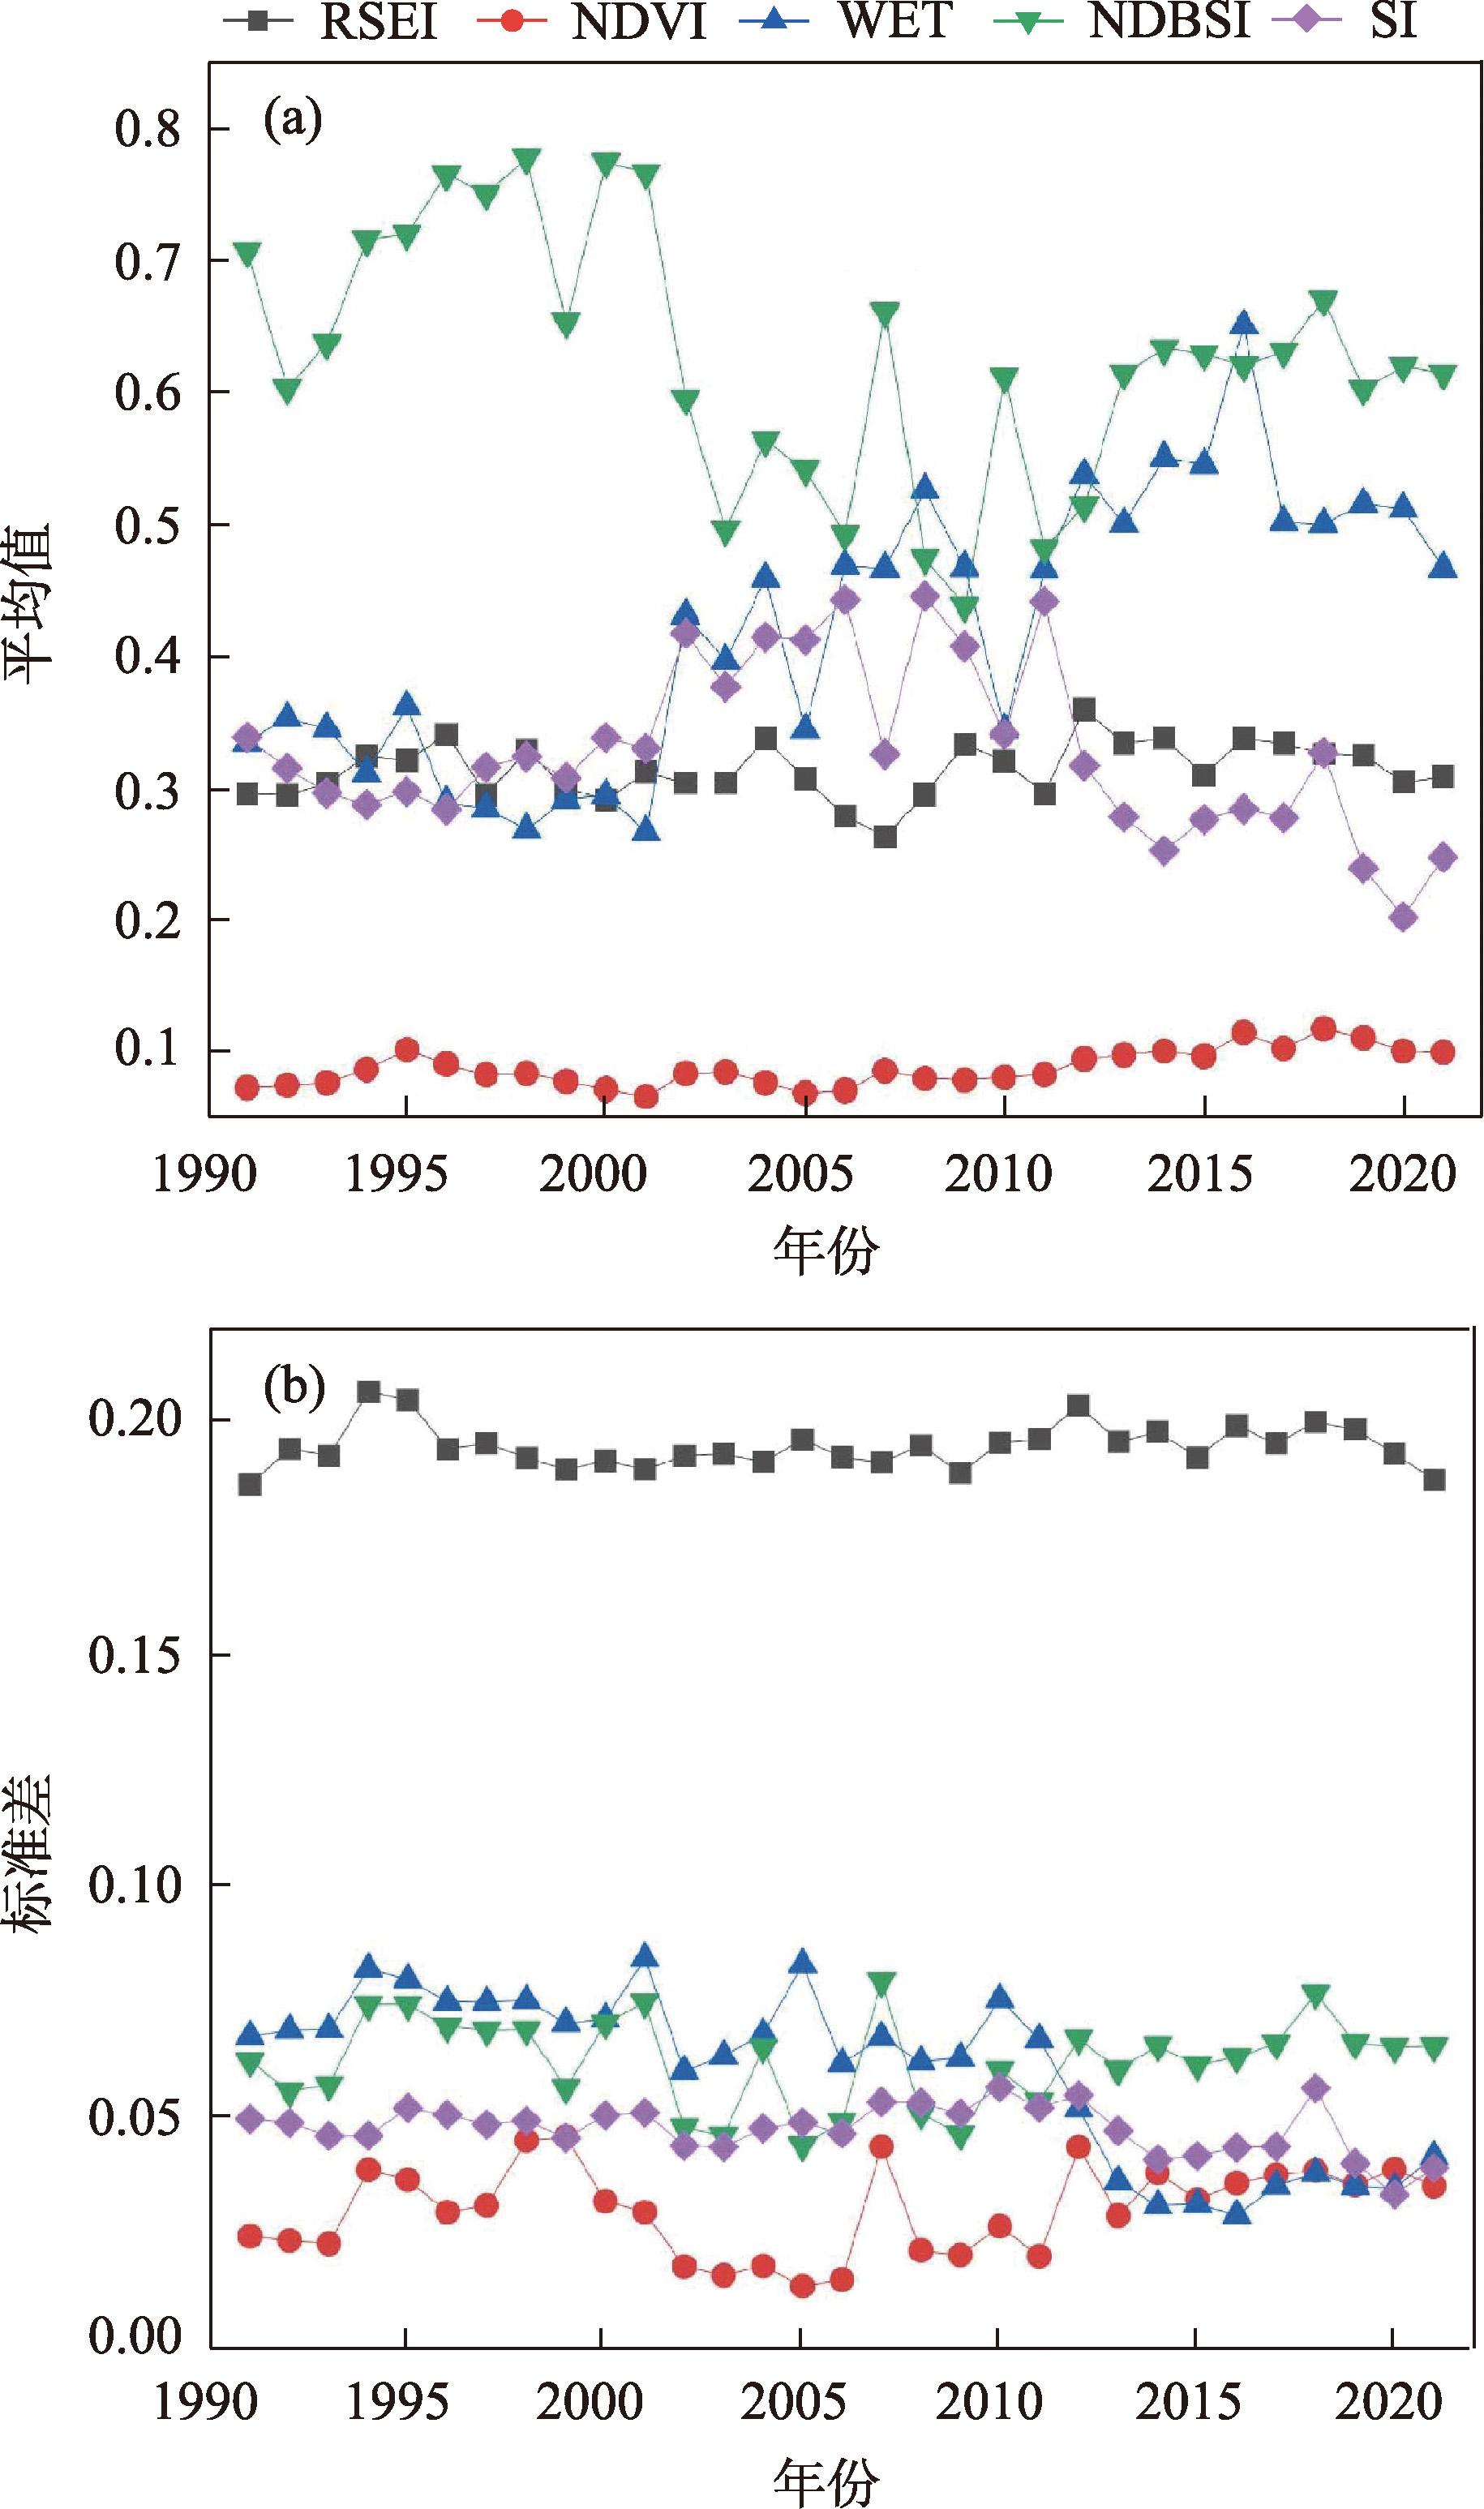
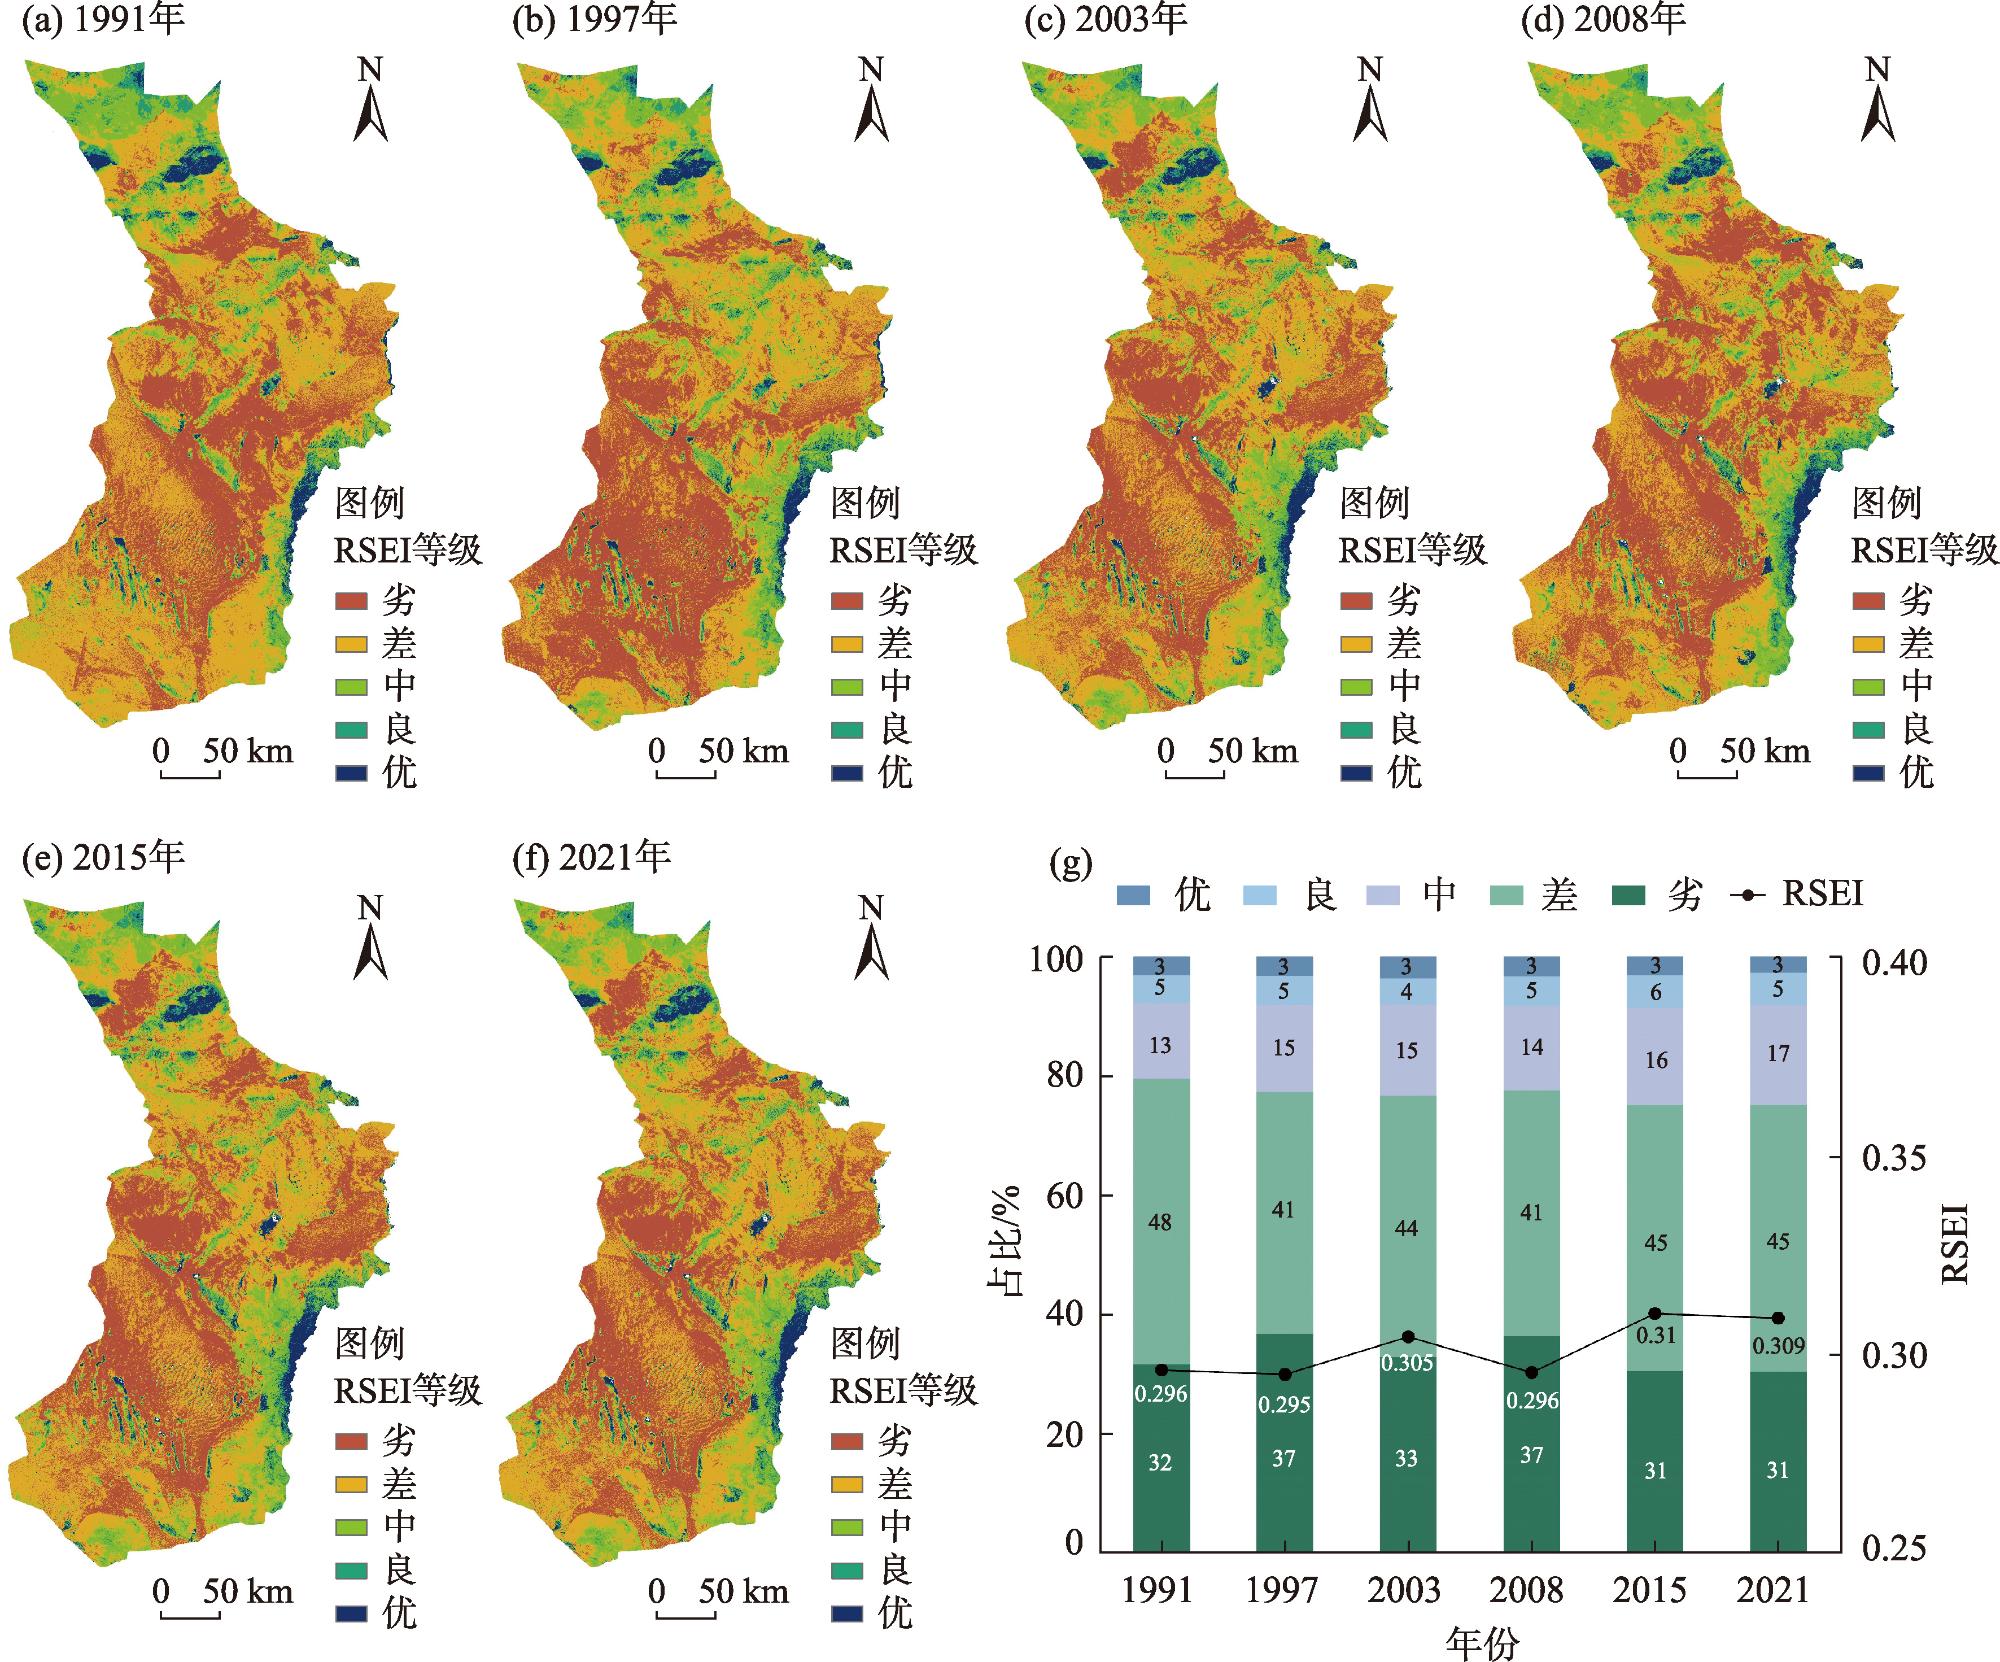
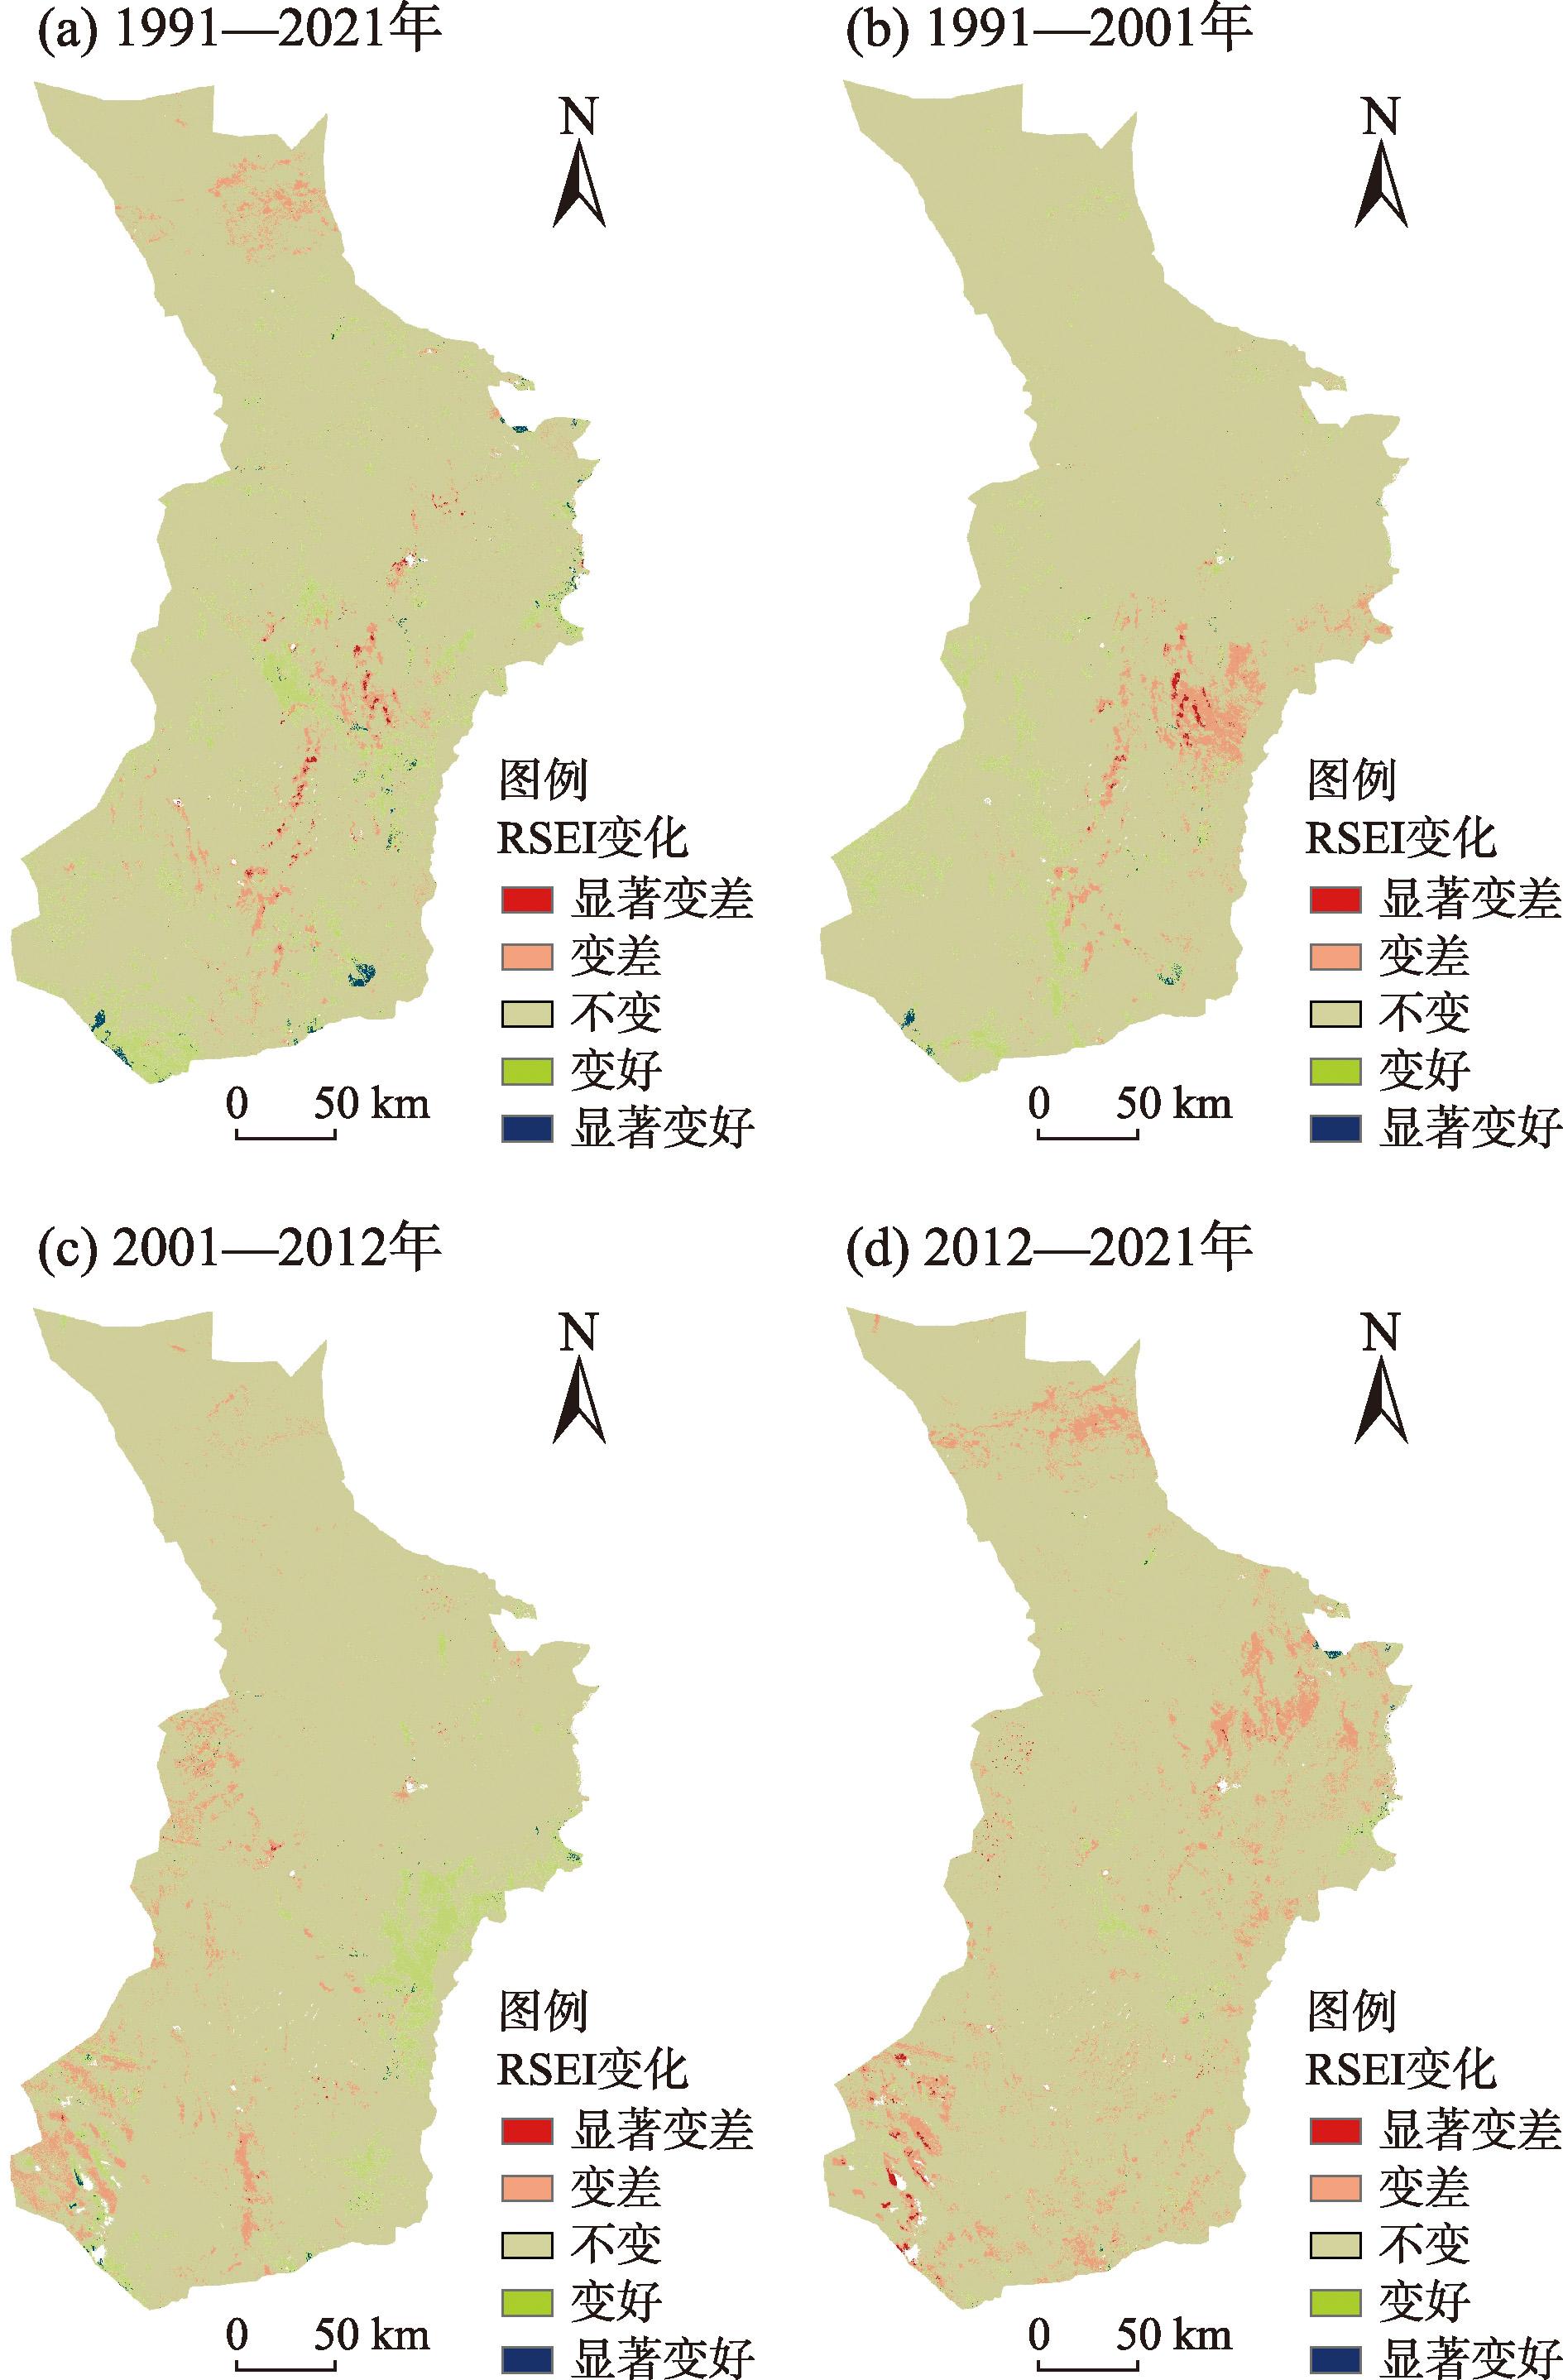
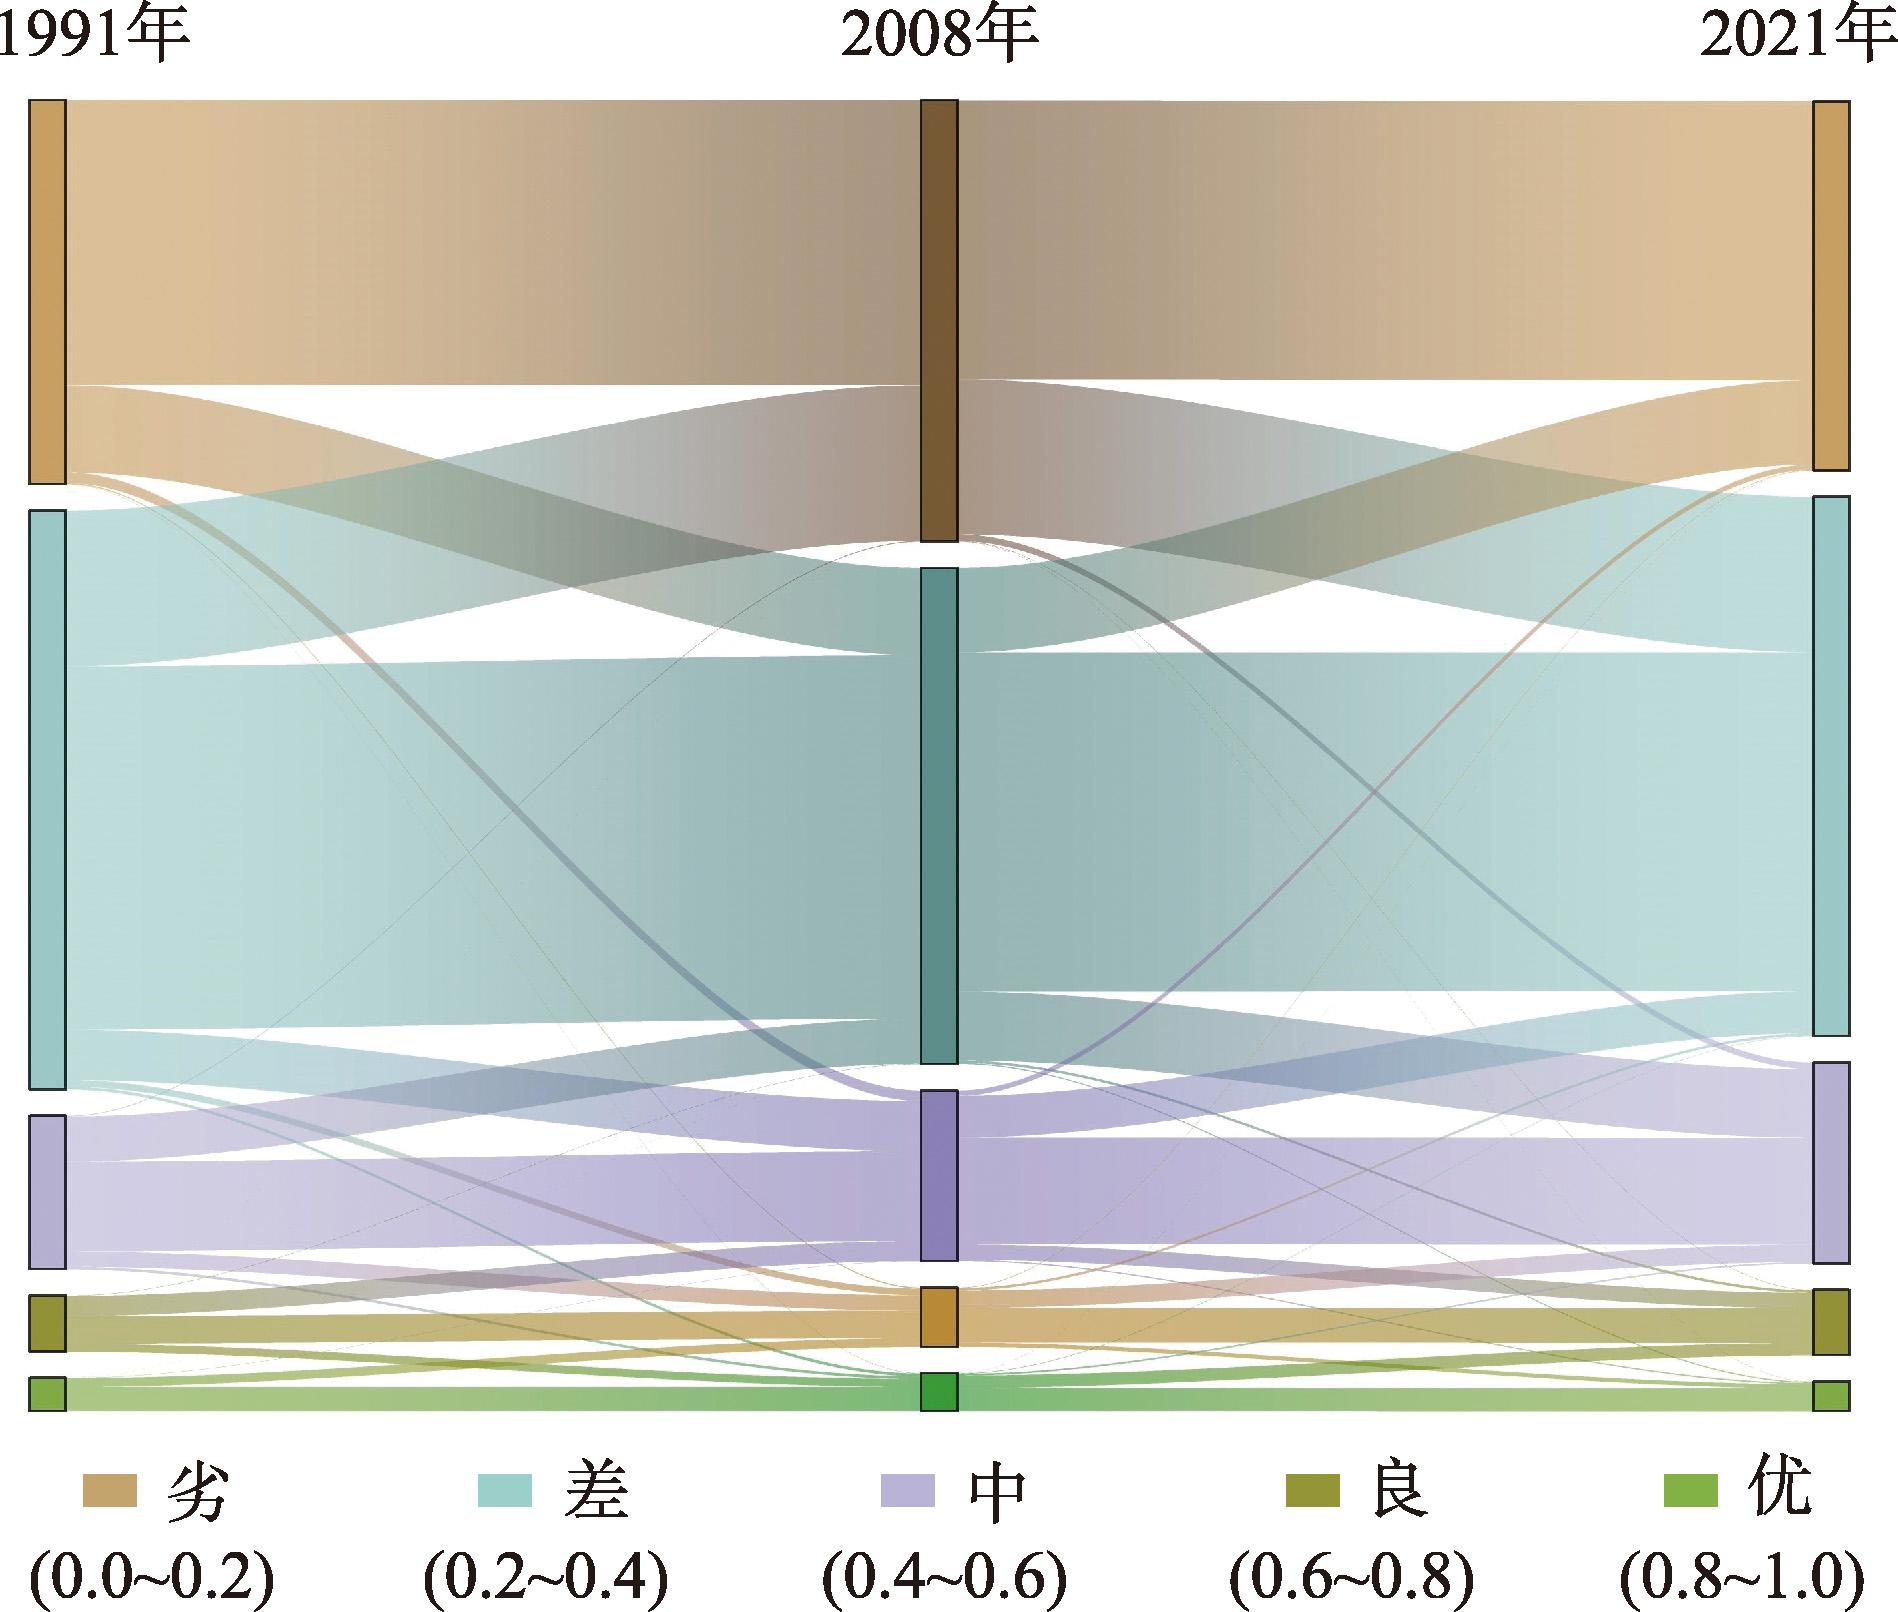
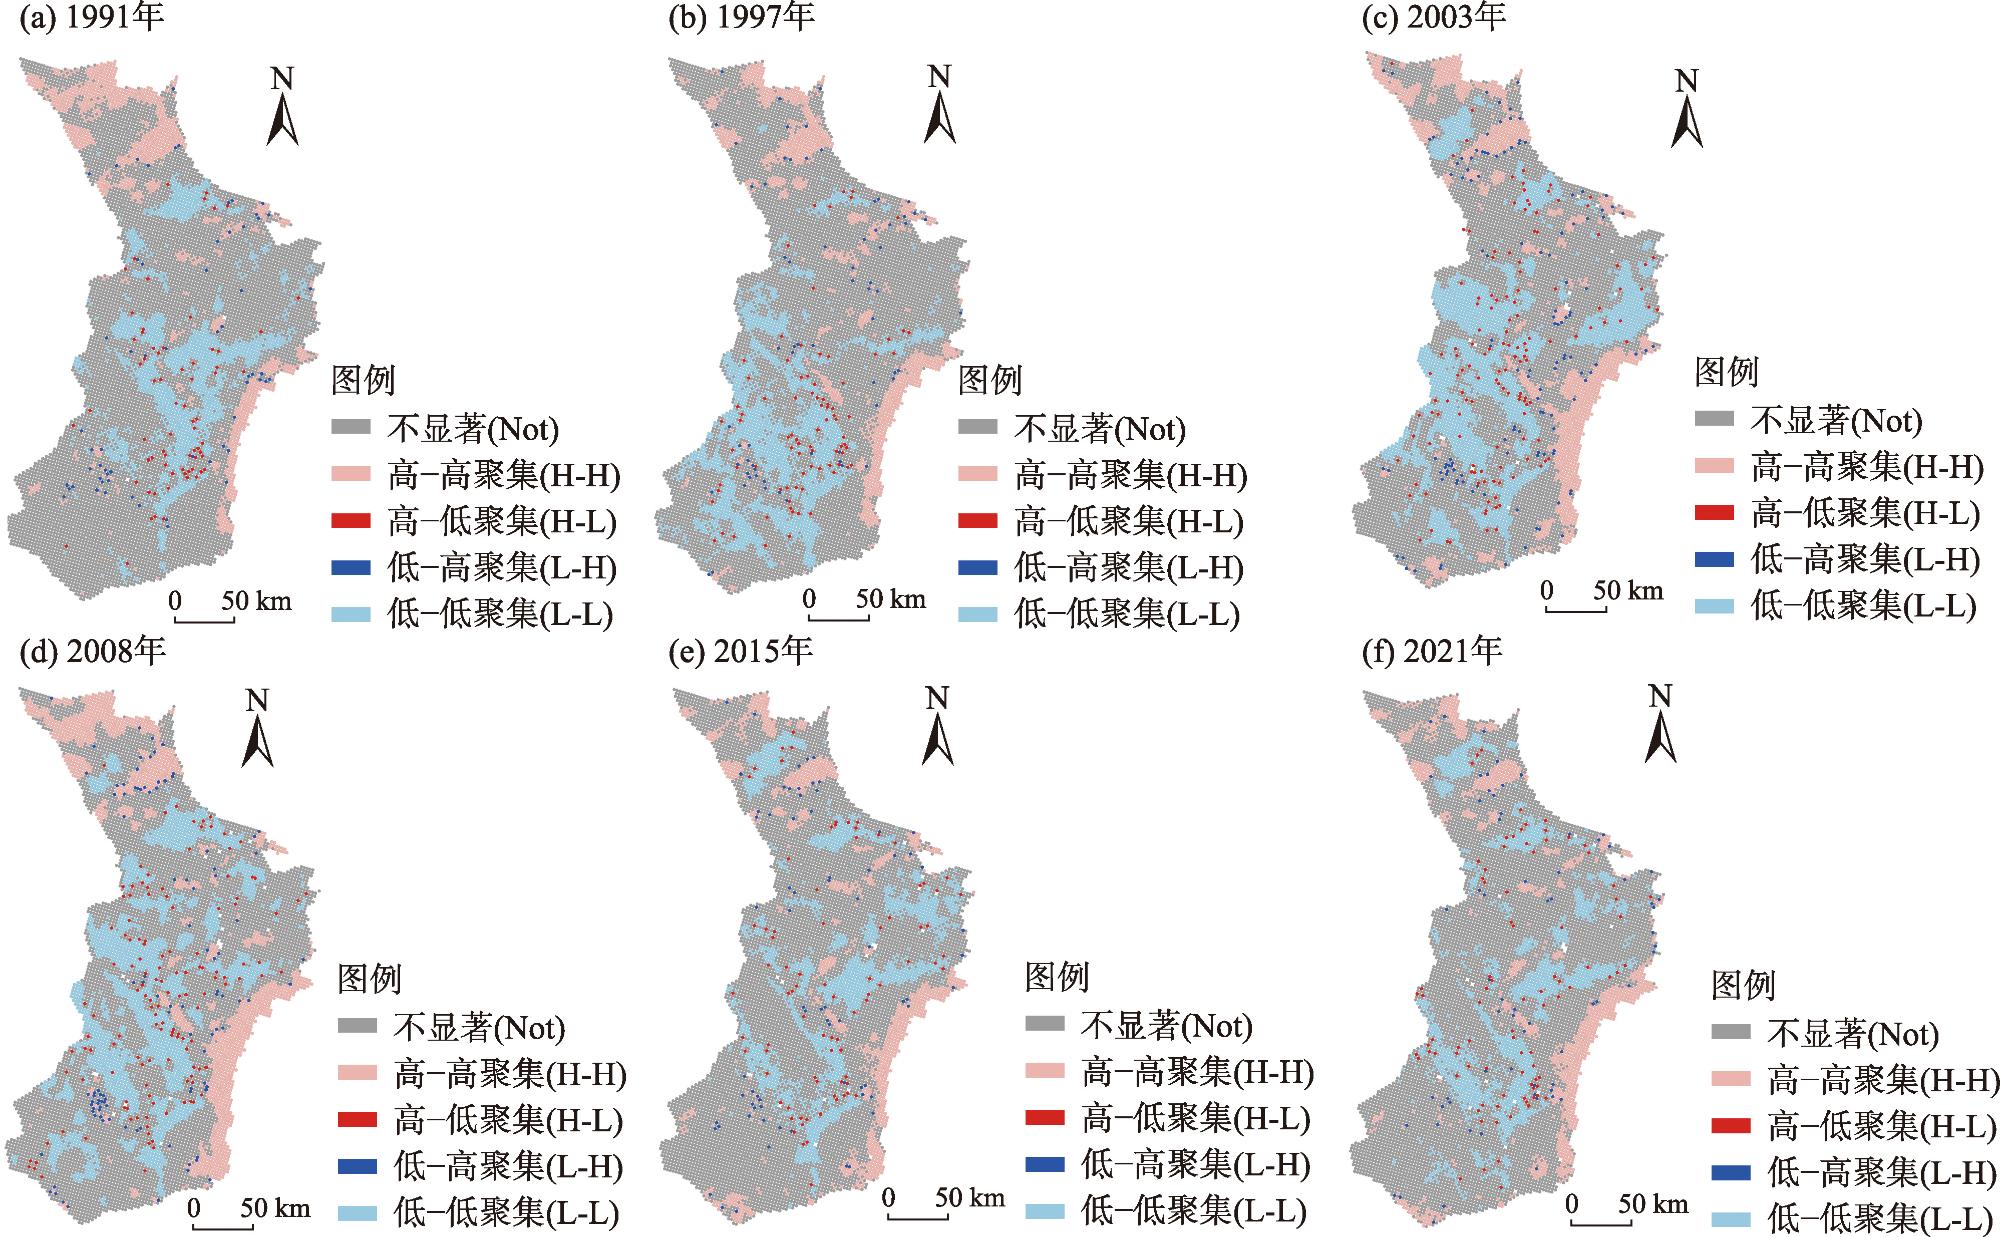
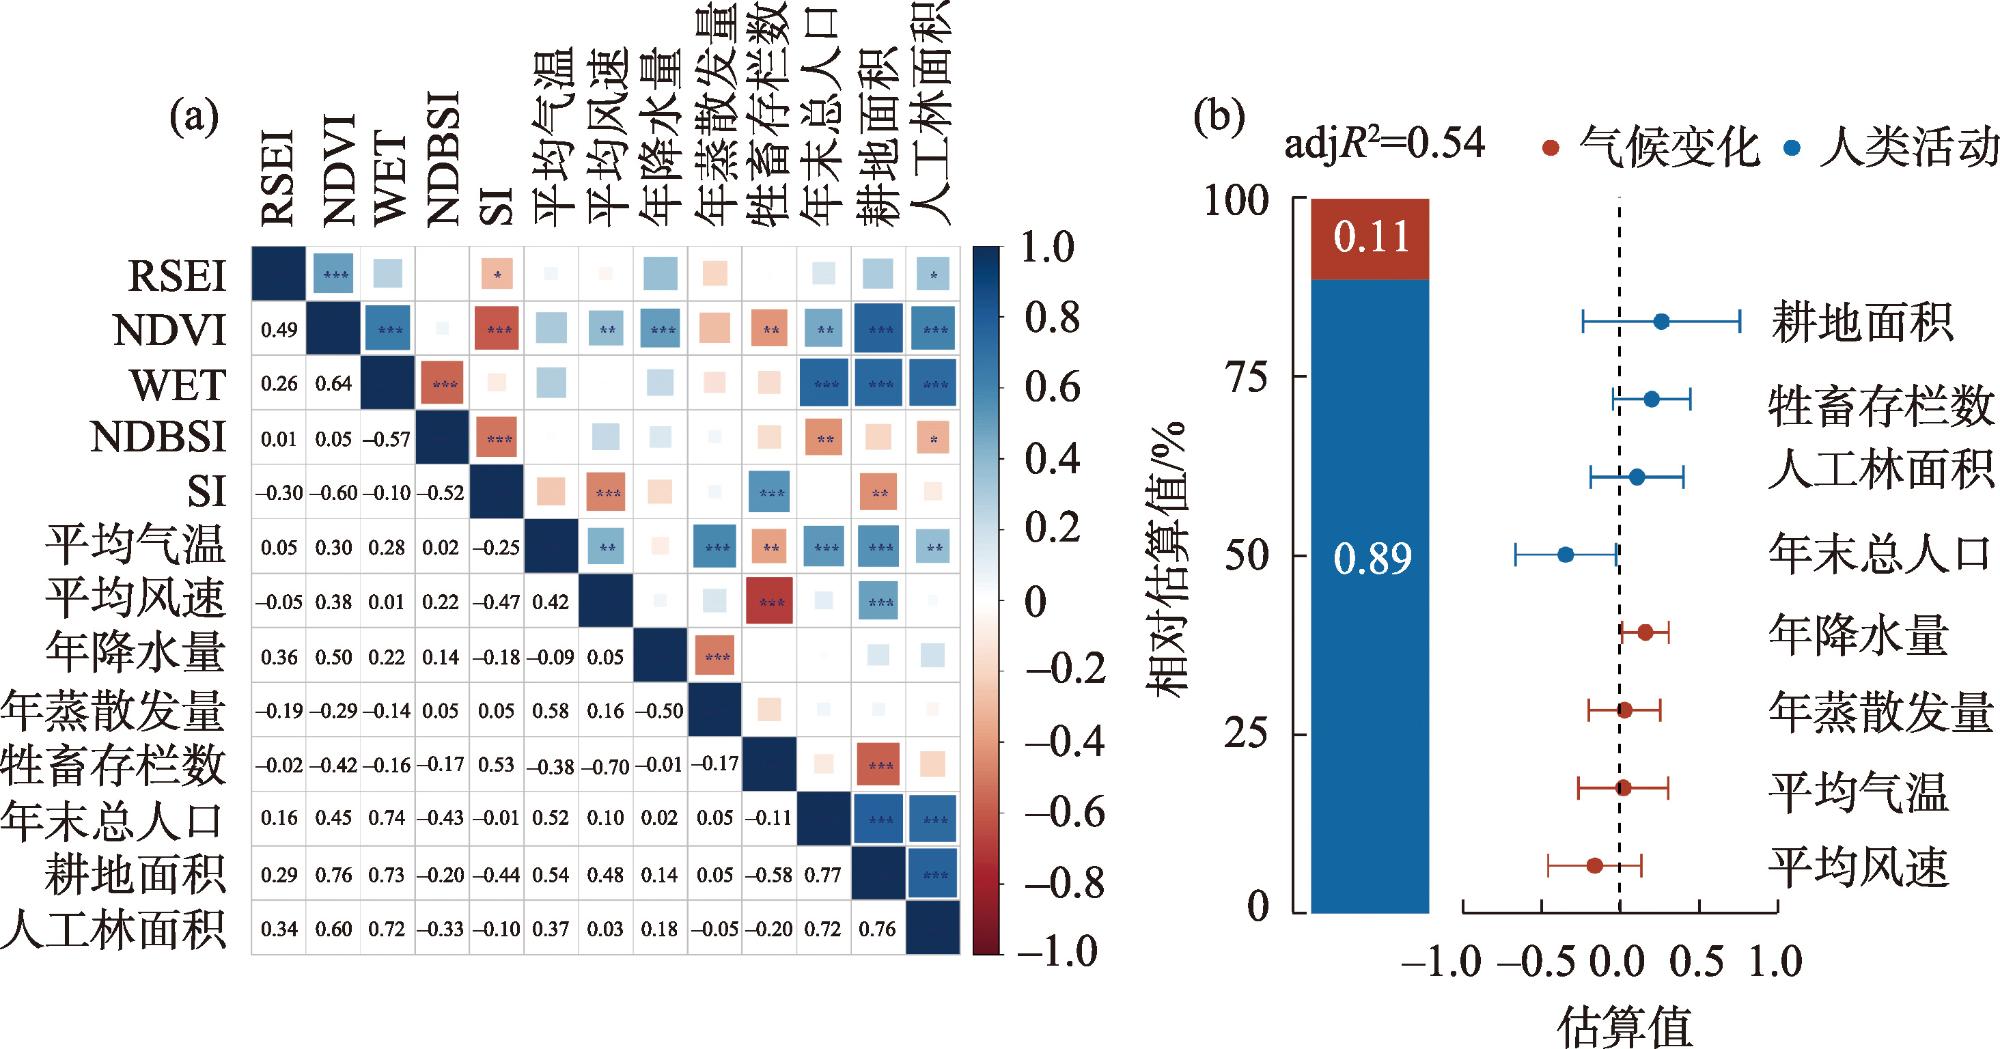
客观、准确、及时地评价生态环境质量时空变化及驱动力对生态环境保护方案与政策的制定具有重要意义。以阿拉善左旗为例,基于Google Earth Engine(GEE)平台构建了干旱区改进的遥感生态指数(Remote Sensing-based Ecological Index,RSEI),分析了近30 a(1991—2021年)RSEI的时空变化及其驱动力。结果表明:(1)近30 a阿拉善左旗RSEI呈波动上升趋势,其中2012年RSEI最大(0.360),2007年最小(0.264)。(2)近30 a阿拉善左旗生态环境改善区面积(RSEI>0.2,3.15%)大于退化区(RSEI<-0.2,2.48%),无变化区面积最大(-0.2<RSEI<0.2,94.37%)。RSEI较差的区域主要分布在裸地区域,而林地、草地、耕地、不透水面区域RSEI逐渐变好。(3)1991—2021年Global Morans’I指数在0.600~0.650之间,表现出较高的聚集特征。(4)从线性混合效应模型的结果来看,引起RSEI变化的原因,人类活动占89%,气候变化占11%。综上所述,近30 a来阿拉善荒漠区生态环境质量整体逐步改善,腾格里沙漠北缘局部地区生态环境质量提升显著,人类活动尤其是飞播造林工程起到了关键作用。
李琪 , 党国锋 , 鱼腾飞 , 张浪 , 陈薇宇 . 基于GEE的干旱区县域生态环境质量时空变化及驱动力分析——以阿拉善左旗为例[J]. 干旱区研究, 2025 , 42(2) : 360 -371 . DOI: 10.13866/j.azr.2025.02.15
Objective, accurate, and timely evaluation of the spatiotemporal changes and driving forces of ecological environment quality is of great significance for the formulation of ecological protection plans and policies. Taking Alxa Left Banner as an example, this study constructs a Remote Sensing-based Ecological Index (RSEI) for arid regions based on the Google Earth Engine (GEE) platform and analyzes the spatiotemporal changes and driving forces of RSEI over the past 30 years (1991-2021). The study shows that: (1) Over the past 30 years, the RSEI of Alxa Left Banner has shown a fluctuating upward trend, with the maximum RSEI in 2012 (0.360) and the minimum in 2007 (0.264). (2) Over the past 30 years, the area of ecological improvement (RSEI>0.2, 3.15%) in Alxa Left Banner is larger than the area of degradation (RSEI<-0.2, 2.48%), with the largest area showing no change (-0.2<RSEI<0.2, 94.37%). Regions with poorer RSEI are mainly distributed in bare land areas, while the RSEI of forest, grassland, farmland, and impervious surface areas has gradually improved. (3) From 1991 to 2021, the Global Moran’s I index ranged between 0.600 and 0.650, indicating a high degree of clustering. (4) According to the results of the linear mixed-effects model, human activities account for 89% of the changes in RSEI, while climate change accounts for 11%. In summary, over the past 30 years, the overall ecological environment quality in the Alxa Desert area has gradually improved, with significant improvements in the northern edge of the Tengger Desert, primarily due to human activities, especially the aerial seeding afforestation projects.
表1 陆地卫星数据源基本信息Tab. 1 Basic information about Landsat data sources |
| 年份 | 数据集 | 卫星 | 使用波段 | 月/云/空间分辨率 |
|---|---|---|---|---|
| 1991—2011 | LANDSAT/LT05/C02/T1_L2 | Landsat 5/TM | SR_B(1,2,3,4,5,7)ST_B6 | 7—9月 <20% 30 m |
| 2012 | LANDSAT/LE07/C02/T1_L2 | Landsat 7/ETM+ | SR_B(1,2,3,4,5,7)ST_B6 | |
| 2013—2021 | LANDSAT/LC08/C02/T1_L2 | Landsat 8/OLI/TIRS | SR_B(2,3,4,5,6,7)ST_B10 |
表2 各指标计算公式Tab. 2 Calculation formulas for various indicators |
| 指标 | 计算方法 | 描述 |
|---|---|---|
| NDVI | 、 、 、 、 、 分别表示Landsat TM、 ETM+、OLI影像的蓝色、绿色、 红色、近红外、短波红外1和 短波红外2波段的反射率。 | |
| WET | ||
| SI | ||
| NDBSI |
表3 1991—2008年生态等级变化转移矩阵Tab. 3 Ecological grade change transition matrix from 1991 to 2008 /km2 |
| 1991年 | 2008年 | ||||
|---|---|---|---|---|---|
| 劣 | 差 | 中 | 良 | 优 | |
| 劣 | 20837.54 | 6388.98 | 772.57 | 77.57 | 23.20 |
| 差 | 11384.72 | 26602.14 | 3675.01 | 493.89 | 208.30 |
| 中 | 62.32 | 3309.34 | 6598.99 | 1120.84 | 200.68 |
| 良 | 1.76 | 30.54 | 1475.00 | 2024.40 | 585.54 |
| 优 | 0.35 | 3.33 | 23.16 | 645.20 | 1776.98 |
表4 2008—2021年生态等级变化转移矩阵Tab. 4 Ecological grade change transition matrix from 2008 to 2021 /km2 |
| 2008年 | 2020年 | ||||
|---|---|---|---|---|---|
| 劣 | 差 | 中 | 良 | 优 | |
| 劣 | 20395.57 | 11355.27 | 481.44 | 31.82 | 17.81 |
| 差 | 6178.71 | 24840.16 | 5029.51 | 186.36 | 81.75 |
| 中 | 390.01 | 3061.34 | 7854.05 | 1125.48 | 92.59 |
| 良 | 38.79 | 184.52 | 1279.73 | 2543.47 | 303.50 |
| 优 | 9.15 | 38.84 | 119.60 | 917.33 | 1686.13 |
表5 不同土地利用下遥感生态指数(RSEI)面积比例变化Tab. 5 Changes in remote sensing ecological index (RSEI) area percentage under different land uses /% |
| 年份 | 土地利用 | 显著变差 (-1.0~-0.6) | 变差 (-0.6~-0.2) | 不变 (-0.2~0.2) | 变好 (0.2~0.6) | 显著变好 (0.6~1.0) |
|---|---|---|---|---|---|---|
| 1991—2008 | 耕地 | 0.00 | 0.02 | 0.51 | 0.41 | 0.07 |
| 林地 | 0.00 | 0.00 | 0.97 | 0.03 | 0.00 | |
| 草地 | 0.00 | 0.05 | 0.87 | 0.08 | 0.00 | |
| 裸地 | 0.00 | 0.05 | 0.91 | 0.04 | 0.00 | |
| 不透水面 | 0.00 | 0.20 | 5.43 | 0.45 | 0.03 | |
| 2008—2020 | 耕地 | 0.01 | 0.07 | 0.80 | 0.11 | 0.01 |
| 林地 | 0.00 | 0.00 | 0.96 | 0.04 | 0.00 | |
| 草地 | 0.00 | 0.05 | 0.89 | 0.06 | 0.00 | |
| 裸地 | 0.00 | 0.04 | 0.95 | 0.01 | 0.00 | |
| 不透水面 | 0.01 | 0.13 | 0.80 | 0.06 | 0.00 |
| [1] |
|
| [2] |
程静, 王鹏, 陈红翔, 等. 半干旱区生态风险时空演变及其影响因素的地理探测——以宁夏盐池县为例[J]. 干旱区地理, 2022, 45(5): 1637-1648.
[
|
| [3] |
|
| [4] |
|
| [5] |
|
| [6] |
|
| [7] |
|
| [8] |
|
| [9] |
|
| [10] |
|
| [11] |
冯自贤, 佘璐, 王秀慧, 等. 基于改进遥感生态指数的宁夏生态环境质量时空变化[J]. 生态环境学报, 2024, 33(1): 131-143.
[
|
| [12] |
刘尚钦, 张福浩, 赵习枝, 等. 干旱区绿洲遥感生态指数的改进[J]. 测绘科学, 2022, 47(6): 143-151, 203.
[
|
| [13] |
陈丽红, 刘普幸, 花亚萍. 基于RSEI的疏勒河流域生态质量综合评价及其成因分析[J]. 土壤通报, 2021, 52(1): 25-33.
[
|
| [14] |
李朋轩, 杨永崇, 王涛, 等. 新疆地区土地利用变化及其对生态环境质量的影响[J]. 北方园艺, 2022(8): 67-75.
[
|
| [15] |
|
| [16] |
|
| [17] |
|
| [18] |
|
| [19] |
|
| [20] |
|
| [21] |
|
| [22] |
杜秉晨曦, 程勇翔, 吴玲. 准噶尔盆地植被与土壤盐渍化关联性变化趋势分析[J]. 生态学报, 2021, 41(23): 9364-9376.
[
|
| [23] |
|
| [24] |
|
| [25] |
|
| [26] |
赵晨光, 程业森, 李慧瑛, 等. 腾格里沙漠东北缘人工植被恢复区土地利用/覆被变化及其驱动因素分析[J]. 干旱区资源与环境, 2021, 35(6): 131-138.
[
|
| [27] |
吴亚坤, 李金彪, 高昊辰, 等. 阿拉善左旗土壤盐分空间变异特征研究[J]. 土壤, 2019, 51(5): 1030-1035.
[
|
| [28] |
张飞, 塔西甫拉提·特依拜, 丁建丽, 等. 干旱区土壤盐渍化及其对生态环境的损害评估——以新疆沙雅县为例[J]. 自然灾害学报, 2009, 18(4): 55-62.
[
|
| [29] |
罗镕基, 王宏涛, 王成. 基于改进遥感生态指数的甘肃省古浪县生态质量评价[J]. 干旱区地理, 2023, 46(4): 539-549.
[
|
| [30] |
郭泽呈, 魏伟, 庞素菲, 等. 基于SPCA和遥感指数的干旱内陆河流域生态脆弱性时空演变及动因分析——以石羊河流域为例[J]. 生态学报, 2019, 39(7): 2558-2572.
[
|
| [31] |
代云豪, 管瑶, 刘孟琴, 等. 1990—2020年阿拉尔垦区生态环境质量动态监测与评价[J]. 水土保持通报, 2022, 42(2): 122-128.
[
|
| [32] |
杜高奇, 李自强, 赵勇, 等. 基于RSEI的黄河流域生态环境质量监测与驱动因素分析[J]. 水利水电技术, 2022, 53(12): 81-93.
[
|
| [33] |
高吉喜, 张小华, 邹长新, 等. 筑牢生态屏障建设美丽中国[J]. 环境保护, 2021, 49(6): 17-20.
[
|
| [34] |
|
| [35] |
赵晨光, 李慧瑛, 鱼腾飞, 等. 腾格里沙漠东北缘人工植被对土壤物理性质的影响[J]. 干旱区研究, 2022, 39(4): 1112-1121.
[
|
/
| 〈 |
|
〉 |