
林分密度对刺槐人工林土壤养分和微生物群落的影响
|
张佳凝(2000-),女,硕士研究生,主要从事林业生态工程研究. E-mail: alcreed@163.com |
收稿日期: 2024-06-07
修回日期: 2024-11-21
网络出版日期: 2025-08-13
基金资助
国家重点研发计划基金(2022YFF130040103)
Effects of stand density on soil nutrients and microbial communities in Robinia pseudoacacia plantations
Received date: 2024-06-07
Revised date: 2024-11-21
Online published: 2025-08-13
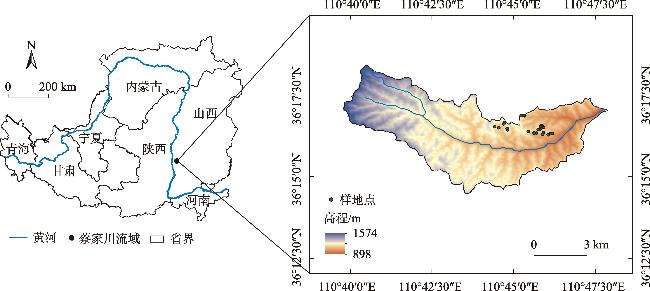
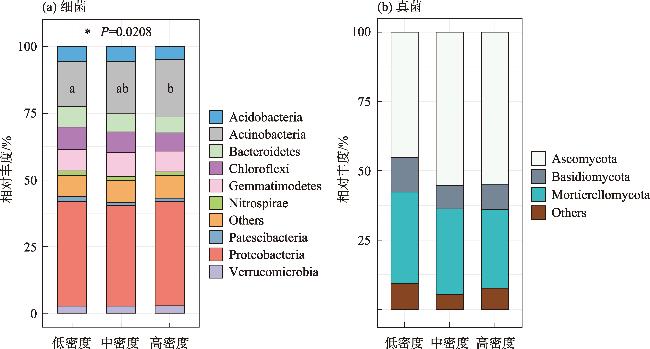
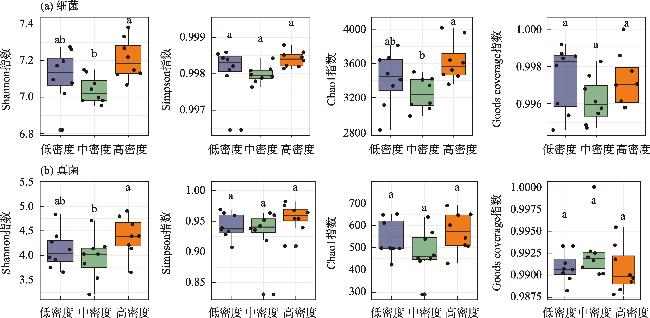
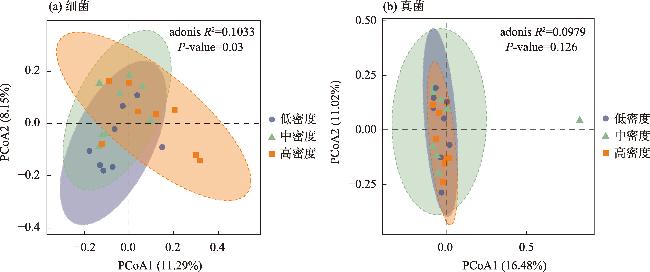
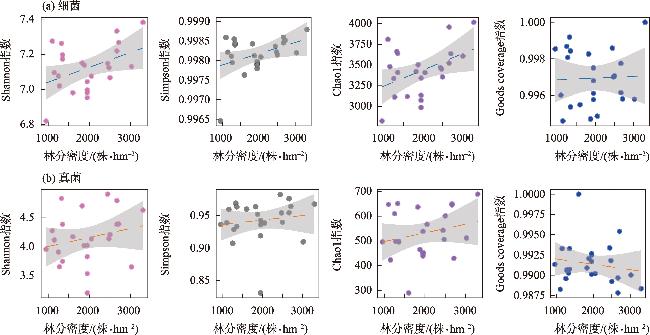
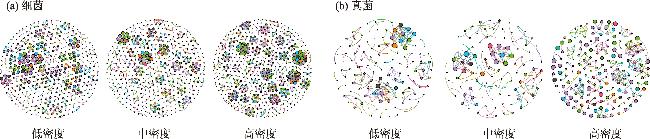
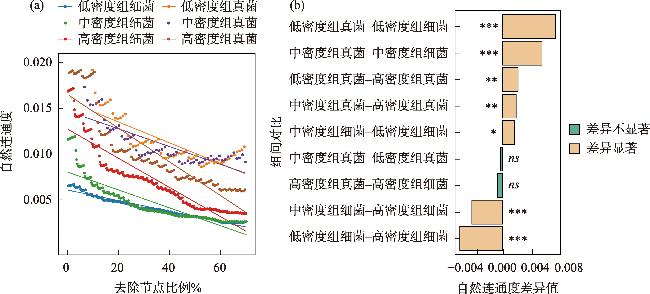
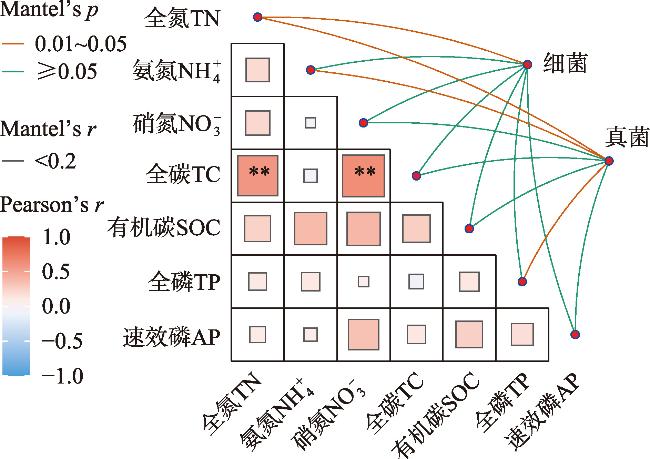
土壤养分水平和微生物群落结构特征是评估人工林生态系统服务功能的重要指标。为探究干旱半干旱地区人工林林分密度对土壤养分与微生物群落的影响,以黄土高原东缘30 a生刺槐(Robinia pseudoacacia)人工林为研究对象,基于Reineke林分密度效应法则和区域管理标准,将林分划分为低密度(950~1350株·hm-2)、中密度(1600~2050株·hm-2)和高密度(2400~3300株·hm-2)组。通过野外调查、土壤养分测定及16S rRNA和ITS高通量测序,系统分析了林分密度对土壤养分、微生物群落及其生态互作关系的影响,对于优化人工林密度和实现可持续经营具有重要意义。结果表明:土壤全氮、硝态氮、全碳和有机碳含量随林分密度增加而提高,尤其在高密度组中差异显著(P<0.05);有效磷含量则在中密度组达到峰值。细菌群落主要由变形菌门(38.70%)、放线菌门(19.37%)、芽单胞菌门(8.23%)和绿弯菌门(7.71%)构成,其中高密度组放线菌门的相对丰度显著高于低密度组(P<0.05);在真菌群落中,子囊菌门(51.79%)、被孢霉门(30.70%)和担子菌门(10.07%)为优势菌门。高密度组细菌和真菌群落多样性显著增强,Shannon指数和Chao1指数均显著提高(P<0.05)。PCoA分析显示,中、低密度组的细菌群落结构呈现聚集性,并与高密度组存在显著差异(P<0.05);真菌群落结构在不同密度组间未表现出显著差异。Mantel检验表明,细菌和真菌群落结构均与土壤全氮显著相关(P<0.05)。共现网络分析显示,适度提高林分密度能够增强微生物群落的互作强度与复杂性,当林分密度超过2400株·hm-2时,网络稳定性下降,不利于资源高效利用。综上所述,林分密度处于1600~2050株·hm-2时,能够有效提高土壤养分水平,并优化微生物群落结构,从而为黄土高原刺槐人工林的生态系统管理与可持续经营提供科学依据。
张佳凝 , 张建军 , 赖宗锐 , 赵炯昌 , 胡亚伟 , 李阳 , 卫朝阳 . 林分密度对刺槐人工林土壤养分和微生物群落的影响[J]. 干旱区研究, 2025 , 42(2) : 274 -288 . DOI: 10.13866/j.azr.2025.02.08
Soil nutrient levels and microbial community structures are critical indicators for evaluating the ecosystem services of artificial forests. In arid and semi-arid regions, which are the major distribution areas for artificial forests, the regulatory effects of stand density on soil nutrients and microbial communities remain poorly understood. This study analyzed a 30-year-old Robinia pseudoacacia plantation on the Loess Plateau’s eastern edge. Based on Reineke’s stand density effect law and regional management standards, the stands were categorized into low (950-1350 trees·hm-2), medium (1600-2050 trees·hm-2), and high (2400-3300 trees·hm-2) density groups. Data were collected through field surveys, soil nutrient analyses, and high-throughput sequencing of 16S rRNA and ITS. These methods systematically assessed the soil nutrient characteristics and microbial community structures and diversity across different stand densities. The study’s findings indicate that as the stand density increases, the soil total nitrogen, nitrate nitrogen, total carbon, and organic carbon contents significantly increase, especially in the high-density group (P<0.05). Conversely, the available phosphorus content peaks in the medium-density group. The bacterial community was primarily composed of Proteobacteria (38.70%), Actinobacteria (19.37%), Gemmatimonadetes (8.23%), and Chloroflexi (7.71%), with Actinobacteria’s relative abundance significantly increasing alongside the stand density (P<0.05). In the fungal community, Ascomycota (51.79%), Mortierellomycota (30.70%), and Basidiomycota (10.07%) were the dominant phyla. In the high-density group, bacterial and fungal community diversity was significantly enhanced, as evidenced by notable increases in the Shannon and Chao1 indices (P<0.05). Principal Coordinates Analysis revealed that the bacterial community structures in the medium- and low-density groups exhibited significant clustering, distinctly differing from those in the high-density group (P<0.05). In contrast, the fungal community structures remained relatively stable across different stand densities. The Mantel test revealed that bacterial and fungal community structures were significantly associated with TN (P<0.05). Cooccurrence network analysis indicated that moderate stand density increases microbial interaction strength and network complexity. However, when the stand density exceeded 2400 trees·hm-2, the network stability decreased, potentially hindering efficient resource utilization. Maintaining a stand density of 1600-2050 trees·hm-2 improves soil nutrient levels and enhances microbial community diversity and stability, providing a scientific basis for the sustainable management of R. pseudoacacia plantations on the Loess Plateau.
表1 不同林分密度组人工林样地概况Tab. 1 Information of the plantations sample plots with different stand densities |
| 分组 | 林分密度 /(株·hm-2) | 海拔 /m | 坡位 | 坡向 | 平均 坡度/(°) | 平均 树高/m | 平均 胸径/cm | 平均 地径/cm | 平均水 平冠幅/m | 平均顺 坡冠幅/m | 主要林 下植被 |
|---|---|---|---|---|---|---|---|---|---|---|---|
| 低密度 | 1218.75±141.89 | 1133.49±42.05 | 中坡 | 阳坡 | 23.31±4.91 | 10.53±1.07 | 13.12±2.13 | 16.93±1.98 | 4.03±0.22 | 4.76±0.39 | 茅莓、青杞、黄刺玫、铁 杆蒿 |
| 中密度 | 1893.75±135.46 | 1102.90±43.57 | 中坡 | 阳坡 | 24.00±7.65 | 8.89±1.09 | 9.93±1.22 | 13.77±1.46 | 3.67±0.27 | 4.04±0.35 | 虉草、黑麦草、茅莓、青蒿、白首乌 |
| 高密度 | 2723.25±297.09 | 1098.41±36.26 | 中坡 | 阳坡 | 21.13±15.43 | 7.11±1.35 | 8.30±1.04 | 11.63±1.30 | 3.19±0.32 | 3.85±0.62 | 虉草、茅莓、青蒿、铁杆蒿、蒌蒿、黄刺玫、茜草 |
注:表内数据均为不同林分密度组下的平均值±标准差。 |
表2 不同林分密度人工林土壤养分含量(均值 ± 标准误差,n=样本量)Tab. 2 Soil nutrient content of plantations with different forest densities (mean±standard error, n=sample size) |
| 分组 | 全氮/(g·kg-1) | 铵态氮/(mg·kg-1) | 硝态氮/(mg·kg-1) | 全碳/(g·kg-1) | 有机碳/(g·kg-1) | 全磷/(g·kg-1) | 有效磷/(mg·kg-1) |
|---|---|---|---|---|---|---|---|
| 低密度组(n=40) | 0.65±0.17b | 10.05±2.39a | 9.01±3.66b | 23.44±3.00b | 5.34±1.33b | 0.56±0.04a | 1.64±0.61b |
| 中密度组(n=40) | 0.80±0.34ab | 10.10±2.63a | 11.14±3.21ab | 23.91±2.03ab | 5.41±1.62b | 0.55±0.04a | 2.99±1.02a |
| 高密度组(n=40) | 1.10±0.38a | 10.27±3.00a | 15.43±7.25a | 28.32±5.39a | 8.01±1.38a | 0.53±0.06a | 2.53±0.87ab |
注:同行不同字母表示存在显著差异(P<0.05)。 |
图6 不同林分密度组土壤微生物共现网络图Fig. 6 Co-occurrence network of soil microbial communities in forest stands with different density groups |
表3 不同林分密度组人工林土壤微生物共现网络拓扑参数Tab. 3 Soil nutrient content of plantations with different forest densities |
| 网络拓扑参数 | 细菌 | 真菌 | |||||
|---|---|---|---|---|---|---|---|
| 低密度 | 中密度 | 高密度 | 低密度 | 中密度 | 高密度 | ||
| 节点数 | 434 | 450 | 536 | 126 | 111 | 189 | |
| 边数 | 609 | 698 | 1239 | 197 | 142 | 294 | |
| 正相关数 | 606 | 696 | 1234 | 197 | 142 | 294 | |
| 负相关数 | 3 | 2 | 5 | 0 | 0 | 0 | |
| 平均度 | 2.81 | 3.10 | 4.62 | 3.13 | 2.56 | 3.11 | |
| 平均路径长度 | 1.04 | 1.02 | 1.06 | 1.24 | 1.14 | 1.22 | |
| 网络直径 | 2.98 | 1.99 | 1.99 | 1.98 | 1.98 | 3.97 | |
| 网络密度 | 0.01 | 0.01 | 0.01 | 0.03 | 0.02 | 0.02 | |
| 聚类系数 | 0.99 | 0.99 | 0.99 | 0.9 | 0.94 | 0.94 | |
此次野外实验的数据获取依托于山西吉县森林生态系统国家野外科学观测研究站的支持,研究站为实验提供了必要的设备、技术指导和场地保障。通过研究站的协助,实验团队才能顺利地获取高质量数据,为后续的科学分析和研究奠定坚实的基础。最后衷心感谢实验团队全体成员的辛勤劳动和通力协作!
| [1] |
张璐, 吕楠, 程临海. 干旱区生态系统稳态转换及其预警信号——基于景观格局特征的识别方法[J]. 生态学报, 2023, 43(15): 6486-6498.
[
|
| [2] |
于贵瑞, 郝天象, 杨萌. 中国区域生态恢复和环境治理的生态系统原理及若干学术问题[J]. 应用生态学报, 2023, 34(2): 289-304.
[
|
| [3] |
|
| [4] |
|
| [5] |
姜俊, 陈长启, 陈贝贝, 等. 林分密度对北京石质山地侧柏人工林碳氮磷化学计量和养分再吸收的影响[J]. 北京林业大学学报, 2024, 46(10): 33-41.
[
|
| [6] |
王思淇, 张建军, 张彦勤, 等. 晋西黄土区不同密度刺槐林下植物群落物种多样性[J]. 干旱区研究, 2023, 40(7): 1141-1151.
[
|
| [7] |
江上喜. 造林密度对6年生杉木幼林生长及林下光环境的影响[J]. 亚热带农业研究, 2022, 18(4): 223-228.
[
|
| [8] |
吉吉佳门, 程一本, 谌玲珑, 等. 科尔沁沙地樟子松人工林土壤水分动态及其对降雨的响应[J]. 干旱区研究, 2023, 40(5): 756-766.
[Jijijiamen,
|
| [9] |
崔艳红, 毕华兴, 侯贵荣, 等. 晋西黄土残塬沟壑区刺槐林土壤入渗特征及影响因素分析[J]. 北京林业大学学报, 2021, 43(1): 77-87.
[
|
| [10] |
韦景树, 李宗善, 冯晓玙, 等. 黄土高原人工刺槐林生长衰退的生态生理机制[J]. 应用生态学报, 2018, 29(7): 2433-2444.
[
|
| [11] |
丛微. 典型森林土壤微生物群落及其与植物的共存关系研究[D]. 北京: 中国林业科学研究院, 2020.
[
|
| [12] |
王岩松, 马保明, 高海平, 等. 晋西黄土区油松和刺槐人工林土壤养分及其化学计量比对林分密度的响应[J]. 北京林业大学学报, 2020, 42(8): 81-93.
[
|
| [13] |
胡亚伟, 施政乐, 刘畅, 等. 晋西黄土区刺槐林密度对林下植物多样性及土壤理化性质的影响[J]. 生态学杂志, 2023, 42(9): 2072-2080.
[
|
| [14] |
黄浩博, 毕华兴, 赵丹阳, 等. 黄土高原不同密度刺槐林地土壤-微生物-胞外酶生态化学计量特征[J/OL]. 生态学报, 2025, (03): 1-11.
[
|
| [15] |
|
| [16] |
常译方. 晋西黄土区典型林地土壤水分特征及模拟[D]. 北京: 北京林业大学, 2018.
[
|
| [17] |
鲍士旦. 土壤农化分析[M]. 北京: 中国农业出版社, 2000.
[
|
| [18] |
|
| [19] |
|
| [20] |
贾亚倢, 杨建英, 张建军, 等. 晋西黄土区林分密度对油松人工林生物量及土壤理化性质的影响[J]. 浙江农林大学学报, 2024, 41(6): 1211-1221.
[
|
| [21] |
崔国龙, 李强峰, 高英, 等. 青海大通北川河源区典型植被土壤微生物群落结构特征及影响因素[J]. 干旱区研究, 2024, 41(7): 1195-1206.
[
|
| [22] |
仲怡铭, 陈徵尼, 王慧慧, 等. 油松人工林林分特征对密度调控的响应[J]. 森林与环境学报, 2023, 43(6): 606-613.
[
|
| [23] |
|
| [24] |
|
| [25] |
张宁宁, 黄诗浩, 雷衡, 等. 基于137Cs 示踪技术的土壤侵蚀及养分流失特征评价[J]. 生态学报, 2022, 42(22): 9274-9283.
[
|
| [26] |
王梓名, 赵明明, 任云卯, 等. 主伐龄油松建筑材林生长及土壤性质对林分密度的响应[J]. 北京林业大学学报, 2022, 44(12): 88-101.
[
|
| [27] |
付志高, 肖以华, 许涵, 等. 南亚热带常绿阔叶林土壤微生物生物量碳氮年际动态特征及其影响因子[J]. 生态学报, 2024, 44(3): 1092-1103.
[
|
| [28] |
|
| [29] |
王晓, 毕银丽, 王义, 等. 沙棘林密度和丛枝菌根真菌接种对林下植物和土壤性状的影响[J]. 林业科学, 2023, 59(10): 138-149.
[
|
| [30] |
刘少华, 赵敏, 王亚娟, 等. 黄土丘陵区林分密度对人工刺槐林土壤理化性质及酶活性影响[J]. 水土保持研究, 2024, 31(5): 123-129.
[
|
| [31] |
|
| [32] |
张颂安, 刘轩, 赵珮杉, 等. 呼伦贝尔沙地樟子松人工林土壤细菌网络特征[J]. 干旱区研究, 2023, 40(6): 905-915.
[
|
| [33] |
|
| [34] |
|
| [35] |
|
| [36] |
刘炜璇, 李依蒙, 江红星, 等. 吉林莫莫格国家级自然保护区四种典型植物群落下土壤微生物组成的对比分析[J]. 生态学杂志, 2024, 43(10): 2988-2998.
[
|
| [37] |
|
| [38] |
钟超, 任媛媛, 鲁安怀, 等. 低能量环境中微生物生存策略[J]. 微生物学报, 2024, 64(12): 4480-4503.
[
|
| [39] |
|
| [40] |
|
| [41] |
罗佳煜, 宋瑞清, 邓勋, 等. PGPR与外生菌根菌互作对樟子松促生作用及根际微生态环境的影响[J]. 中南林业科技大学学报, 2021, 41(9): 22-34.
[
|
| [42] |
李丹丹, 李佳文, 高广磊, 等. 科尔沁沙地樟子松(Pinus sylvestris var. mongolica)人工林土壤真菌群落结构和功能特征[J]. 中国沙漠, 2023, 43(4): 241-251.
[
|
| [43] |
|
| [44] |
|
| [45] |
|
| [46] |
|
| [47] |
|
| [48] |
|
| [49] |
|
| [50] |
|
| [51] |
|
| [52] |
吴文超, 岳平, 崔晓庆, 等. 古尔班通古特沙漠土壤微生物碳氮对环境因子的响应[J]. 干旱区研究, 2018, 35(3): 515-523.
[
|
| [53] |
|
| [54] |
张彤, 刘静, 韩叙, 等. 放牧对沙地樟子松林土壤养分及微生物群落的影响[J]. 干旱区研究, 2023, 40(2): 194-202.
[
|
| [55] |
|
| [56] |
|
| [57] |
张韶阳, 樊丹丹, 孔维栋. 增温对干旱区土壤微生物多样性及固碳功能的影响[J]. 生态学杂志, 2024, 43(6): 1817-1823.
[
|
| [58] |
张蕾, 王强, 杨新月, 等. 黄土丘陵区退耕还林对土壤真菌群落的影响[J]. 环境科学, 2023, 44(3): 1758-1767.
[
|
| [59] |
|
/
| 〈 |
|
〉 |