
塔里木盆地夏季云水资源时空特征
|
马超(1988-),男,硕士,副高级工程师,主要从事灾害性天气研究. E-mail: sonteryfan@aliyun.com |
收稿日期: 2024-09-02
修回日期: 2024-12-10
网络出版日期: 2025-08-13
基金资助
“天山英才”培养计划项目(2022TSYCLJ0003)
新疆维吾尔自治区自然科学基金项目(2023D01B06)
新疆气象局引导性计划项目(YD202301)
Spatial and temporal distribution characteristics of cloud water resources in the Tarim Basin in summer
Received date: 2024-09-02
Revised date: 2024-12-10
Online published: 2025-08-13
空中云水含量对于改善区域水资源具有重要的影响,利用1979—2022年ERA-5逐月再分析资料和EOF分解等方法,深入分析了塔里木盆地夏季云水资源的时空分布特征。结果表明:(1)塔里木盆地大气水汽含量呈西多东少、北部略多于南部的空间分布特征,盆地整层水汽含量近44 a呈增加趋势。(2)EOF两个模态显示,夏季盆地水汽输送主要以全区一致型为主,西南部多东北部少型次之。(3)盆地夏季总云量、云水含量呈南北多,中间少的分布,山区云量多于绿洲和沙漠区。盆地夏季云冰水含量北部多于南部,云液水含量南部多于北部。盆地云液水含量最大集中在帕米尔高原,云冰水含量峰值位于天山山区。(4)昆仑山山区及昆仑山北坡地区以含水性中低云为主,天山山区云水厚度更深且云冰水含量较大。2000年后昆仑山、昆仑山北坡云水含量呈明显增加趋势,天山山区云水含量呈减少趋势。研究结果可为塔里木盆地开展空中云水含量评估和人工影响天气作业提供一定的科学依据。
马超 , 刘艳 , 刘晶 , 杨莲梅 . 塔里木盆地夏季云水资源时空特征[J]. 干旱区研究, 2025 , 42(2) : 223 -235 . DOI: 10.13866/j.azr.2025.02.04
Scientifically assessing cloud water resources and studying the distribution and evolution of cloud water resources is of great significance to guide the local weather modification work, accelerate the development and utilization of aerial water resources, and alleviate water shortage. In this study, the monthly reanalysis data of ERA-5 from 1979 to 2022 and the EOF decomposition method were used to analyze the spatial and temporal distribution characteristics of cloud water resources in the Tarim Basin in summer. The following results were revealed. (1) Regarding spatial distribution, the atmospheric water vapor content in the Tarim Basin was higher in the west, lower in the east, and slightly higher in the north than in the south. The water vapor content of the whole layer in the basin displayed an increasing trend in the past 44 years. (2) The two modes of EOF revealed that the water vapor transport in the basin in summer was mainly consistent in the whole region, followed by more water vapor transport in the southwest and less in the northeast. (3) The total cloud cover and cloud water content in summer were higher in the north and south and lower in the middle of the Tarim Basin, and the cloud cover in the mountainous areas was higher than that in the oasis and desert areas. Meanwhile, the cloud ice water content in the north was higher than that in the south of the basin in summer, and the cloud liquid water content in the south was higher than that in the north. The largest cloud liquid water content in the basin was concentrated in the Pamir Plateau, and the peak value of the cloud ice water content was located in the Tianshan Mountains. (4) The mountainous areas and the northern slope of the Kunlun Mountains were dominated by water-bearing medium and low clouds. In contrast, the cloud water thickness in the Tianshan Mountains was deeper, and the cloud ice water content was larger. A significant increase in cloud water content was observed in the mountainous areas of the Kunlun Mountains and the northern slope of the Kunlun Mountains, while a decrease was observed in the Tianshan Mountains after 2000. The results of this study provide a scientific basis for assessing aerial cloud water content and weather modification operations in the Tarim Basin.
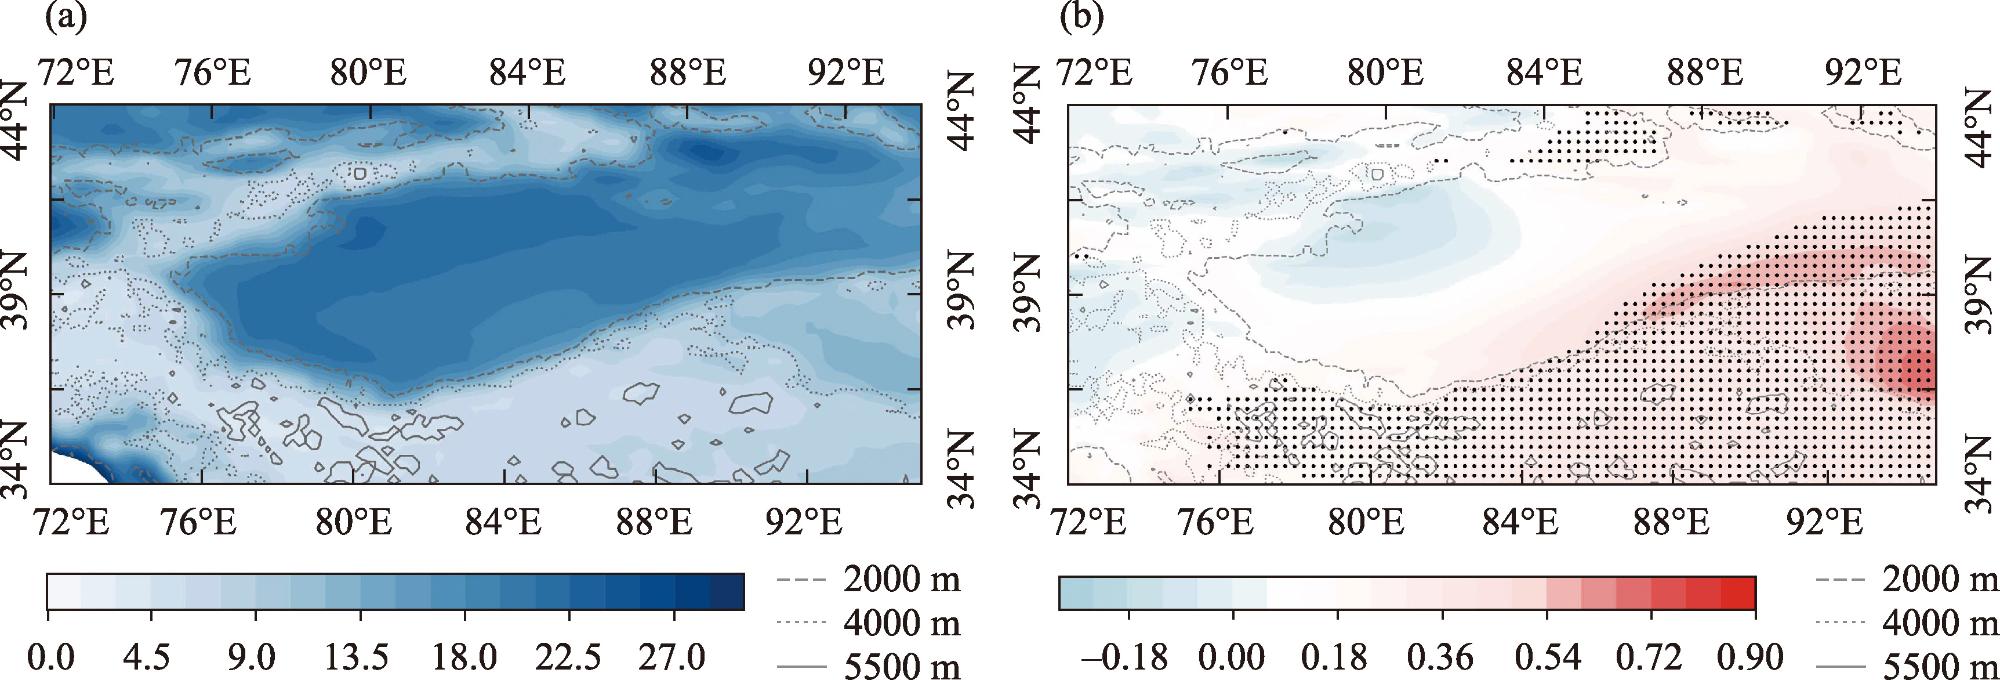
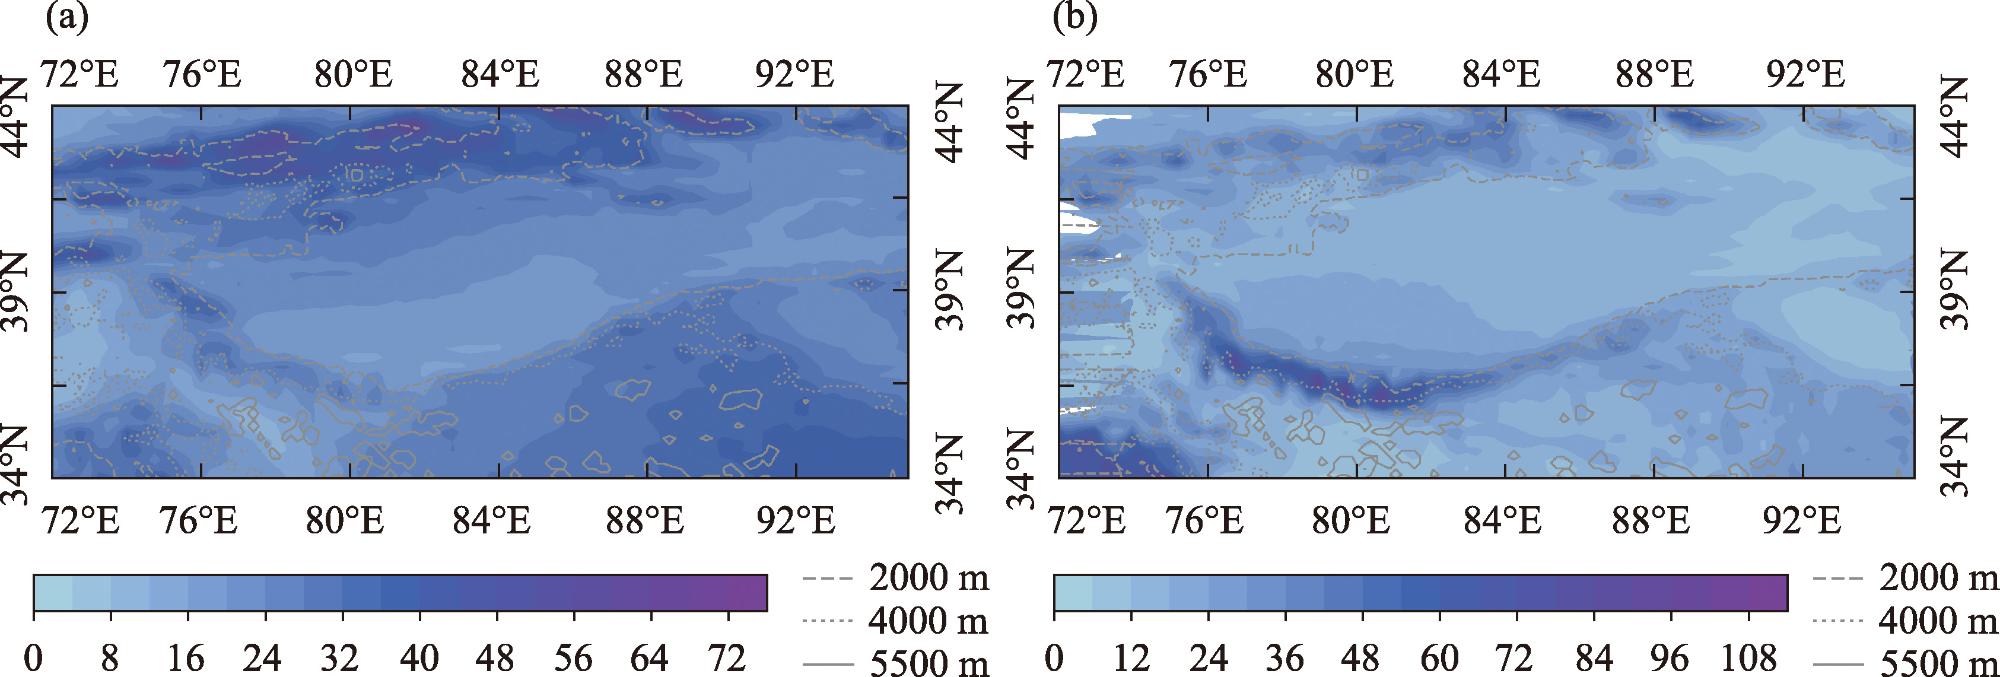
图2 1979—2022年塔里木盆地夏季平均整层大气水汽含量(a,阴影,单位:kg·m-2)及其变化趋势(b,阴影,单位:kg·m-2·(10a)-1)分布注:(b)中黑色点代表通过显著性检验P>0.05的区域。 Fig. 2 The distribution of the average atmospheric water vapor content (shade, unit: kg·m-2) and its change trend [shade, unit: kg·m-2·(10a)-1] in the Tarim Basin in summer from 1979 to 2022 |
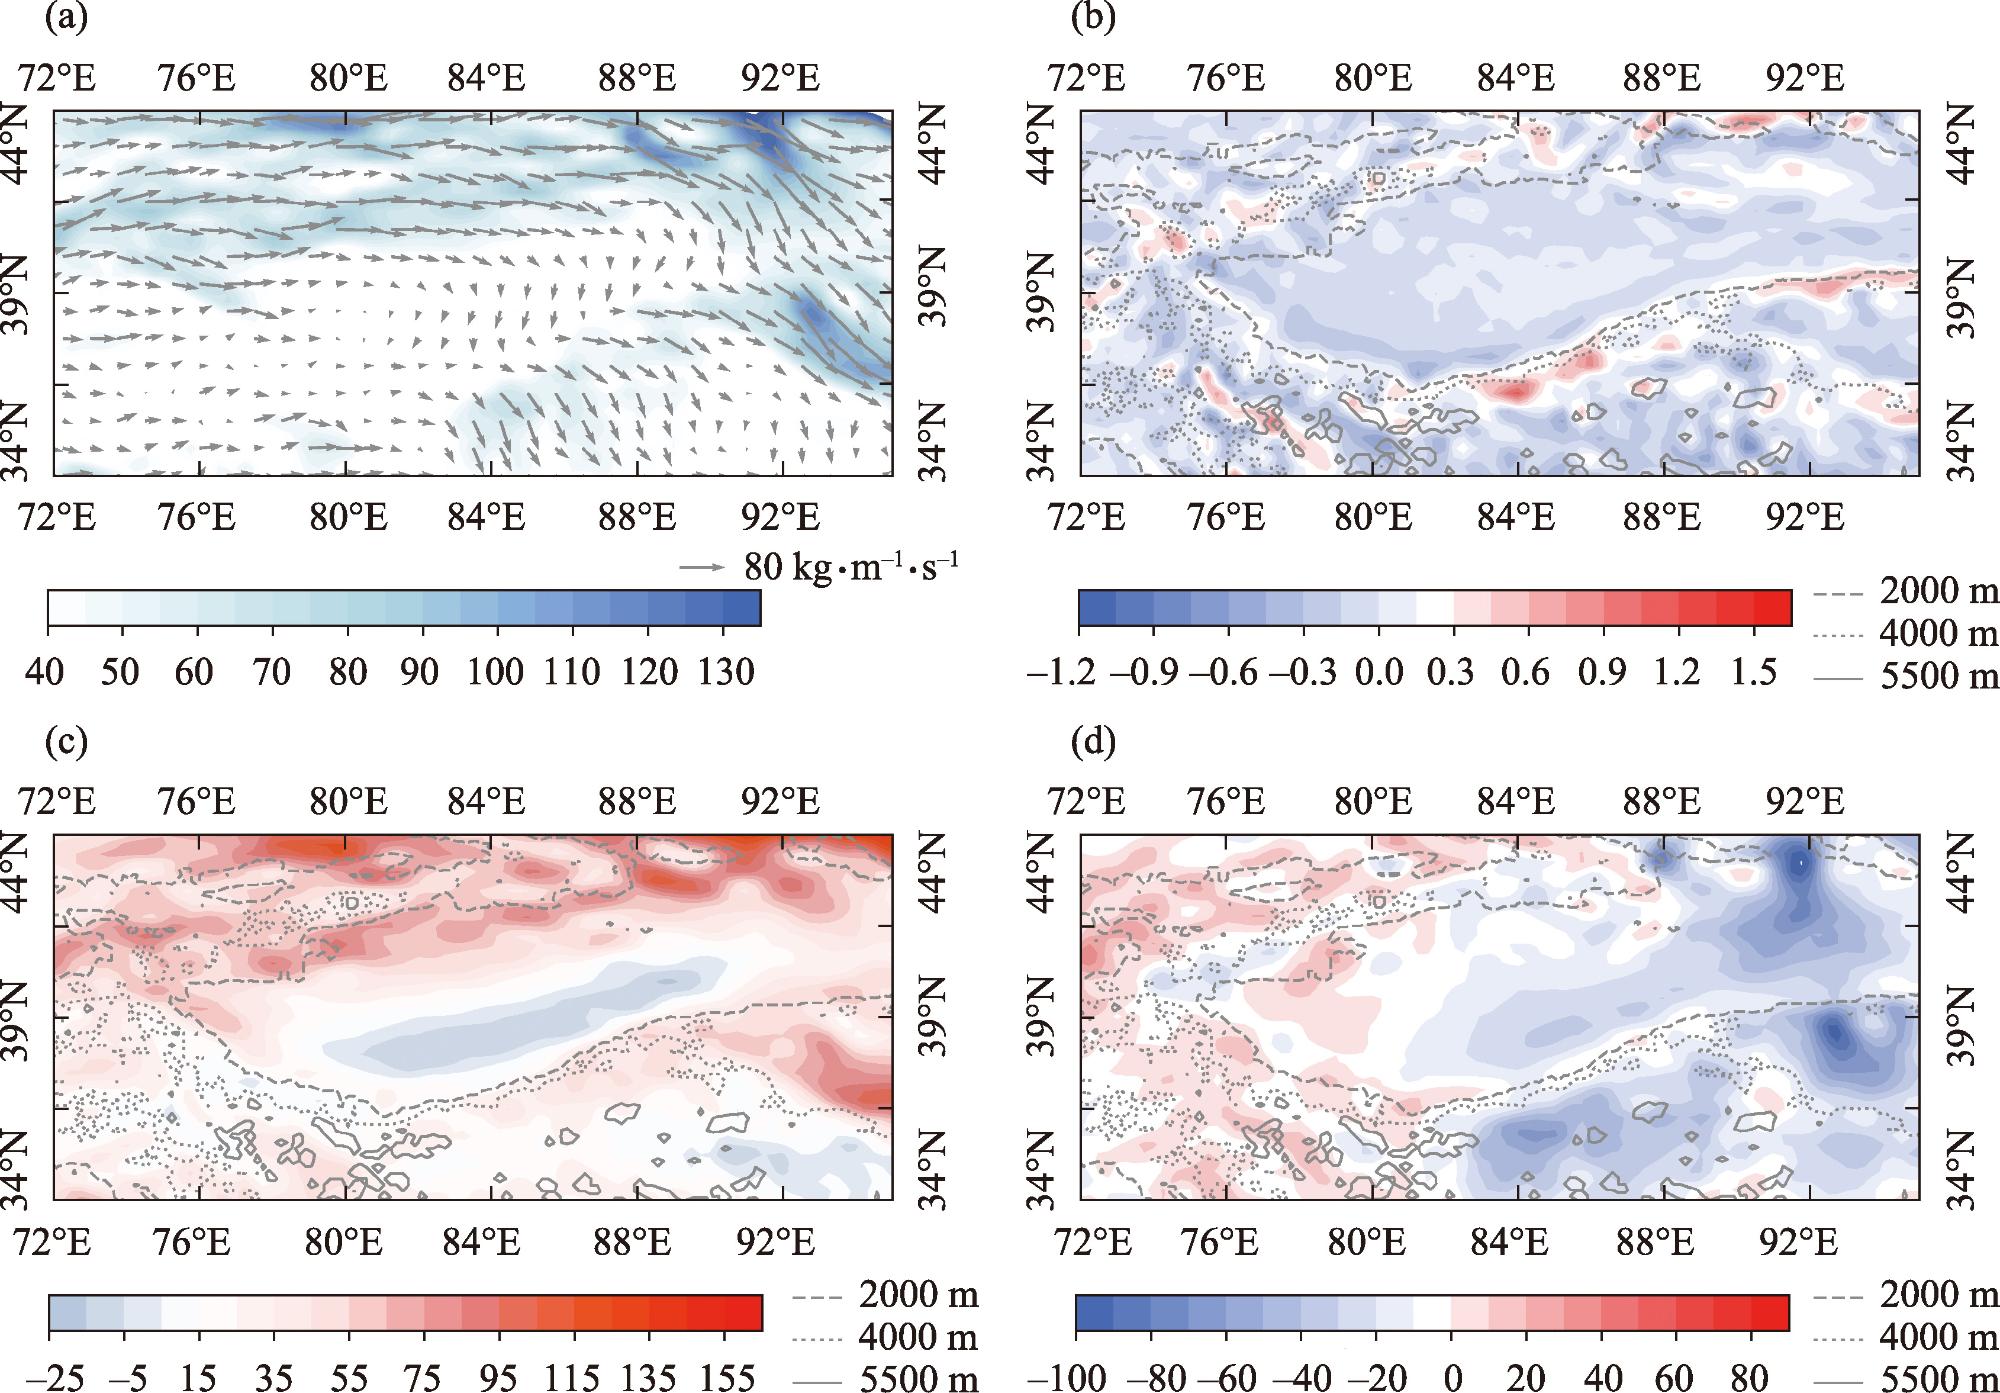
图3 1979—2022年塔里木盆地夏季平均整层水汽通量(a,矢量,单位:kg·m-1·s-1,阴影>40 kg·m-1·s-1)、水汽通量散度(b,单位:10-5 g·m-1·s-1)、整层纬向水汽通量(c,单位:kg·m-1·s-1)和整层经向水汽通量(d,单位:kg·m-1·s-1)分布Fig. 3 Distribution of the average water vapor flux (a, vector, unit: kg·m-1·s-1, shade >40 kg·m-1·s-1), water vapor flux divergence (b, unit: 10-5g·m-1·s-1), the zonal water vapor flux (c, unit: kg·m-1·s-1) and the meridional water vapor flux (d, unit: kg·m-1·s-1) in the whole layer in the Tarim Basin in summer from 1979 to 2022 |
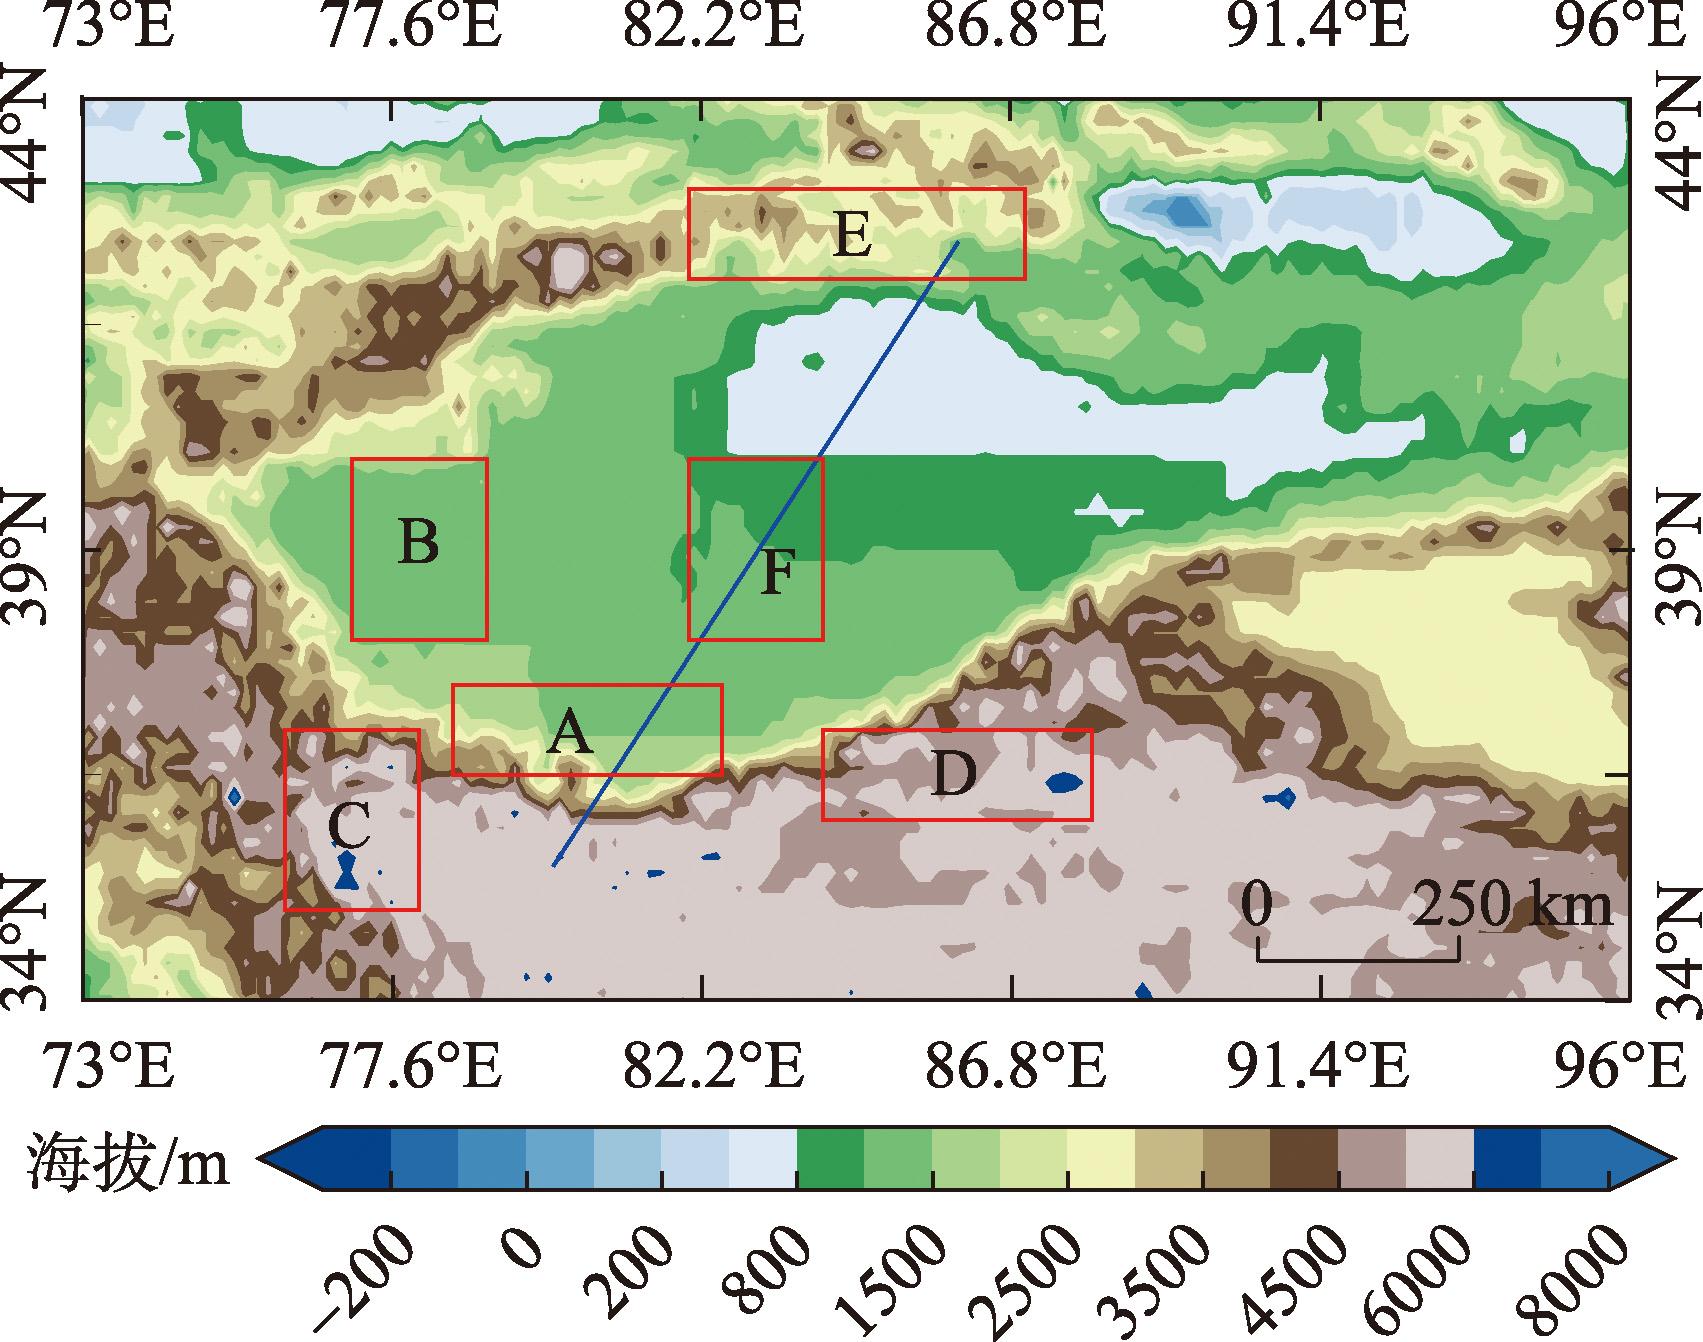
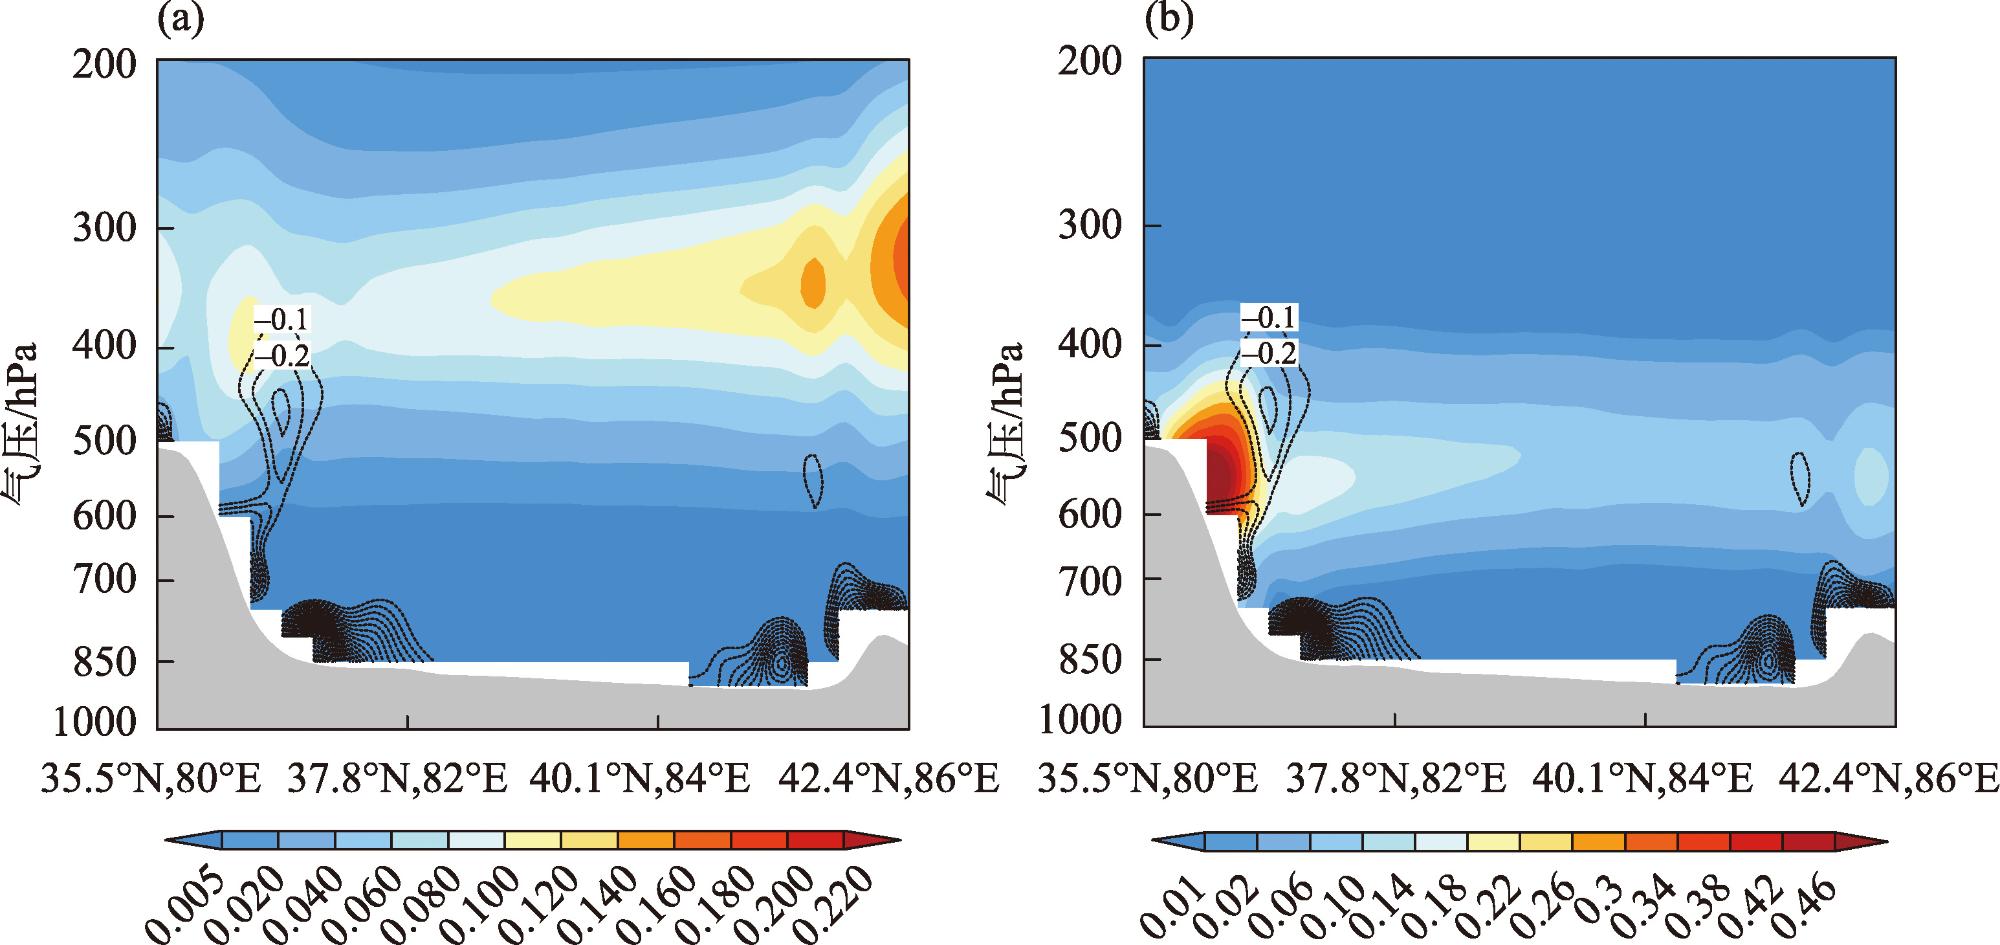
图7 1979—2022年夏季沿图1蓝色实线的云冰水含量(单位:10-1g·m-2)和水汽通量散度(单位:10-5 g·m-1·s-1)(a)、云液水含量(单位:10-1g·m-2)和水汽通量散度(单位:10-5 g·m-1·s-1)(b)垂直剖面图注:图中灰色阴影为地形高度。 Fig. 7 Vertical profiles of (a) cloud ice water content (unit: 10-1g·m-2) and water vapor flux divergence (unit: 10-5g·m-1·s-1), (b) cloud liquid water content (unit: 10-1g·m-2) and water vapor flux divergence (unit: 10-5g·m-1·s-1) along the blue solid line in Figure 1 in summer from 1979 to 2022 |
表1 1979—2022年塔里木盆地夏季整层水汽输送4种空间分布类型Tab. 1 Four spatial distribution types of total column water vapor transportation over the Tarim Basin in summer from 1979 to 2022 |
| 类型 | 个数/个 | 年份 |
|---|---|---|
| 全区偏多型 | 14 | 1982,1986,1987,1989,1992,1994,1995,1998,2004,2007,2012,2013,2020,2021 |
| 全区偏少型 | 12 | 1980,1984,1985,1988,1990,1991,1999,2000,2008,2011,2015,2018 |
| 西南多东北少型 | 12 | 1979,1981,1983,1997,2001,2002,2003,2006,2009,2010,2017,2019 |
| 西南少东北多型 | 6 | 1996,2005,2014,2016,2018,1993 |
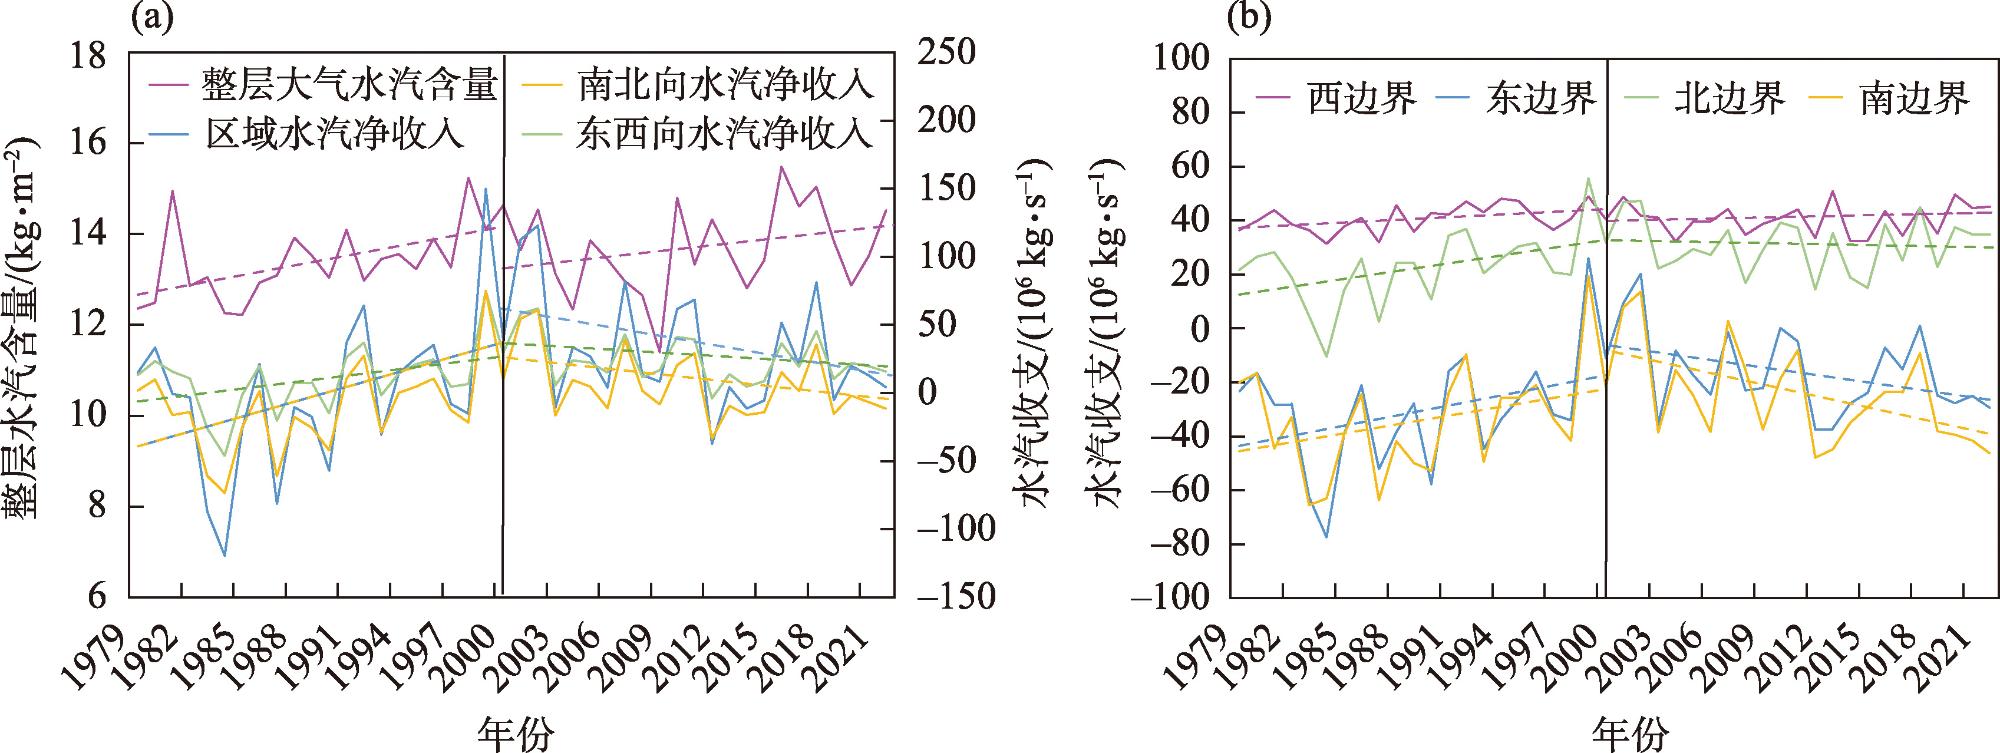
图9 1979—2022年塔里木盆地夏季区域平均整层大气水汽含量(单位:g·m-2)和区域水汽净收入(单位:106 kg·s-1)的时间演变(a)、区域不同边界水汽收支(单位:106 kg·s-1)的时间演变(b)Fig. 9 Temporal evolution of (a) the regional average atmospheric water vapor content (unit: g·m-2) and regional water vapor net income (unit: 106 kg·s-1), of (b) the water vapor budget (unit: 106 kg·s-1) from different boundaries of the Tarim Basin in the summer from 1979 to 2022 |
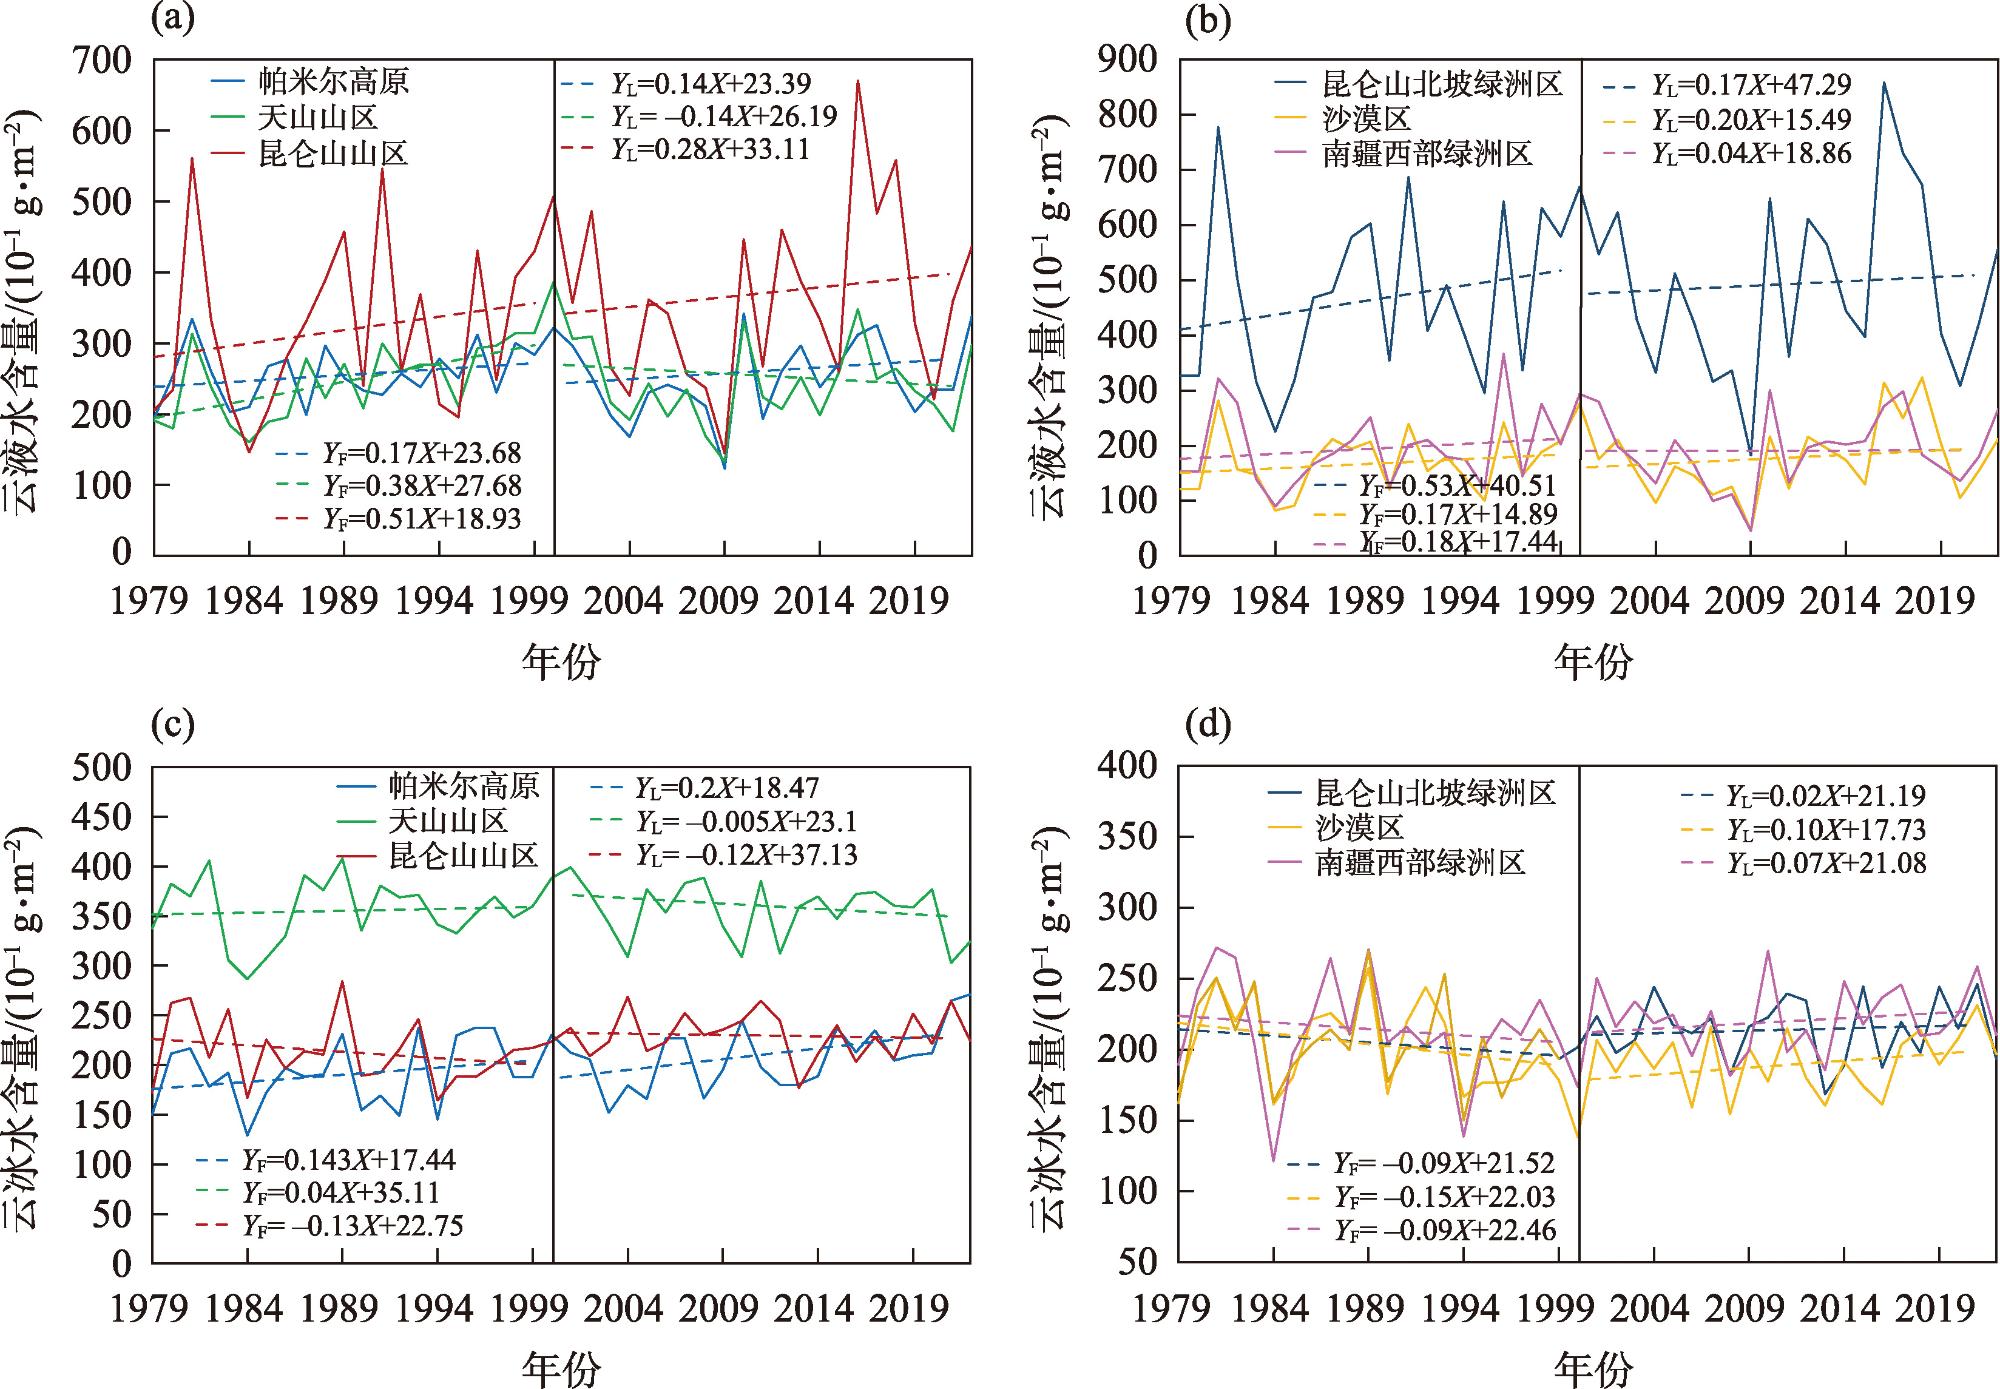
图10 1979—2022年塔里木盆地夏季高山(a、c)、绿洲和沙漠区(b、d)云液水含量和云冰水含量年际变化注:方程下标F和L分别代表1979—2000年和2001—2022年拟合的一元线性回归方程,方程系数×10为增长率。 Fig. 10 Interannual variation of cloud liquid water content and cloud ice water content in alpine (a, c), oases and deserts (b, d) in the Tarim Basin in summer from 1979 to 2022 |
| [1] |
丁贤荣. 高山增水效应及其水资源意义[J]. 山地学报, 2003, 21(6): 681-685.
[
|
| [2] |
彭宽军, 陈勇航, 林雄, 等. 利用CERES卫星遥感资料研究新疆三大山区低层云水资源[C]// 中国气象学会气候资源应用研究委员会, 国家气候中心. 第26届中国气象学会年会气候资源应用研究分会场论文集, 2009.
[
|
| [3] |
张家宝, 袁玉江. 试论新疆气候对水资源的影响[J]. 自然资源学报, 2002, 17(1): 28-34.
[
|
| [4] |
陈勇航, 黄建平, 王天河, 等. 西北地区不同类型云的时空分布及其与降水的关系[J]. 应用气象学报, 2005, 16(6): 717-727, 862.
[
|
| [5] |
尹宪志, 王毅荣, 徐文君, 等. 祁连山空中云水资源开发潜力研究新进展[J]. 沙漠与绿洲气象, 2020, 14(6): 134-140.
[
|
| [6] |
余杰, 蔡森, 周毓荃, 等. 2000—2019年西北地区云水资源时空特征研究[J]. 气象学报, 2024, 82(4): 476-489.
[
|
| [7] |
李家叶, 李铁键, 王光谦, 等. 空中水资源及其降水转化分析[J]. 科学通报, 2018, 63(26): 2785-2796.
[
|
| [8] |
黄美元. 我国人工降水亟待解决的问题和发展思路[J]. 气候与环境研究, 2011, 16(5): 543-550.
[
|
| [9] |
|
| [10] |
刘菊菊, 游庆龙, 周毓荃, 等. 基于ERA-Interim的中国云水量时空分布和变化趋势[J]. 高原气象, 2018, 37(6): 1590-1604.
[
|
| [11] |
杨大生, 王普才. 中国地区夏季6—8月云水含量的垂直分布特征[J]. 大气科学, 2012, 36(1): 89-101.
[
|
| [12] |
刘洪利, 朱文琴, 宜树华, 等. 中国地区云的气候特征分析[J]. 气象学报, 2003, 61(4): 466-473.
[
|
| [13] |
张沛, 姚展予, 贾烁, 等. 六盘山地区空中水资源特征及水凝物降水效率研究[J]. 大气科学, 2020, 44(2): 421-434.
[
|
| [14] |
石岩, 饶丹. 新疆水资源现状及其可持续利用对策分析[J]. 华北水利水电大学学报(自然科学版), 2015, 36(4): 36-38.
[
|
| [15] |
陈勇航, 邓军英, 张萍, 等. 中天山附近强降水过程中云冰水含量随高度变化特征[J]. 资源科学, 2013, 35(3): 655-664.
[
|
| [16] |
张小娟, 王军, 黄观, 等. 新疆3大山区云中液态水时空分布特征[J]. 干旱区研究, 2018, 35(4): 846-854.
[
|
| [17] |
白磊, 王维霞, 姚亚楠, 等. ERA-Interim 和NCEP/NCAR 再分析数据气温和气压值在天山山区适用性分析[J]. 沙漠与绿洲气象, 2013, 7(3): 51-56.
[
|
| [18] |
石晓兰, 杨青, 姚俊强, 等. 基于ERA-Interim资料的中国天山山区云水含量空间分布特征[J]. 沙漠与绿洲气象, 2016, 10(2): 50-56.
[
|
| [19] |
|
| [20] |
|
| [21] |
郝小红, 宋敏红, 周梓萱. 夏季青藏高原空中云水资源的时空特征分析[J]. 高原气象, 2020, 39(6): 1339-1347.
[
|
| [22] |
|
| [23] |
刘晶, 刘兆旭, 杨莲梅, 等. 塔里木盆地及其周边地区大气可降水量分布及其与降水关系的研究[J]. 高原气象, 2024, 43(3): 617-634.
[
|
| [24] |
王凯, 孙美平, 巩宁刚. 西北地区大气水汽含量时空分布及其输送研究[J]. 干旱区地理, 2018, 41(2): 290-297.
[
|
| [25] |
|
| [26] |
|
| [27] |
李帅, 陈勇航, 侯小刚, 等. FY-2F云量产品在新疆区域的评估及检验[J]. 干旱区研究, 2021, 38(4): 1031-1039.
[
|
| [28] |
张强, 杨金虎, 王朋岭, 等. 西北地区气候暖湿化的研究进展与展望[J]. 科学通报, 2023, 68(14): 1814-1828.
[
|
| [29] |
丁一汇, 柳艳菊, 徐影, 等. 全球气候变化的区域响应: 中国西北地区气候“暖湿化”趋势、成因及预估研究进展与展望[J]. 地球科学进展, 2023, 38(6): 551-562.
[
|
| [30] |
张红丽, 韩富强, 张良, 等. 西北地区气候暖湿化空间与季节差异分析[J]. 干旱区研究, 2023, 40(4): 517-531.
[
|
| [31] |
张强, 杨金虎, 马鹏里, 等. 西北地区气候暖湿化增强东扩特征及其形成机制与重要环境影响[J]. 干旱气象, 2023, 41(3): 351-358.
[
|
| [32] |
王瑞英, 周文韬, 任丹阳, 等. 基于ERA5资料的陕西地区云水资源评估[J]. 陕西气象, 2023(6): 10-16.
[
|
| [33] |
张玉欣, 马学谦, 韩辉邦, 等. 2014—2018年青海省云水资源时空分布特征[J]. 干旱区研究, 2021, 38(5): 1254-1262.
[
|
| [34] |
把黎, 尹宪志, 庞朝云, 等. 祁连山地区夏季南坡与北坡空中云水资源差异性分析[J]. 干旱区研究, 2022, 39(5): 1345-1359.
[
|
/
| 〈 |
|
〉 |