
中国地表日平均风与日极大风气候特征的对比
|
南宇琨(1998-),女,硕士研究生,主要从事气候变化研究. E-mail: nyk432110@163.com |
收稿日期: 2023-07-13
修回日期: 2023-10-08
网络出版日期: 2025-08-13
基金资助
国家电网公司总部科技项目(5108-202218280A-2-68-XG)
Comparative study on climate characteristics of daily mean wind and daily extreme wind throughout China
Received date: 2023-07-13
Revised date: 2023-10-08
Online published: 2025-08-13
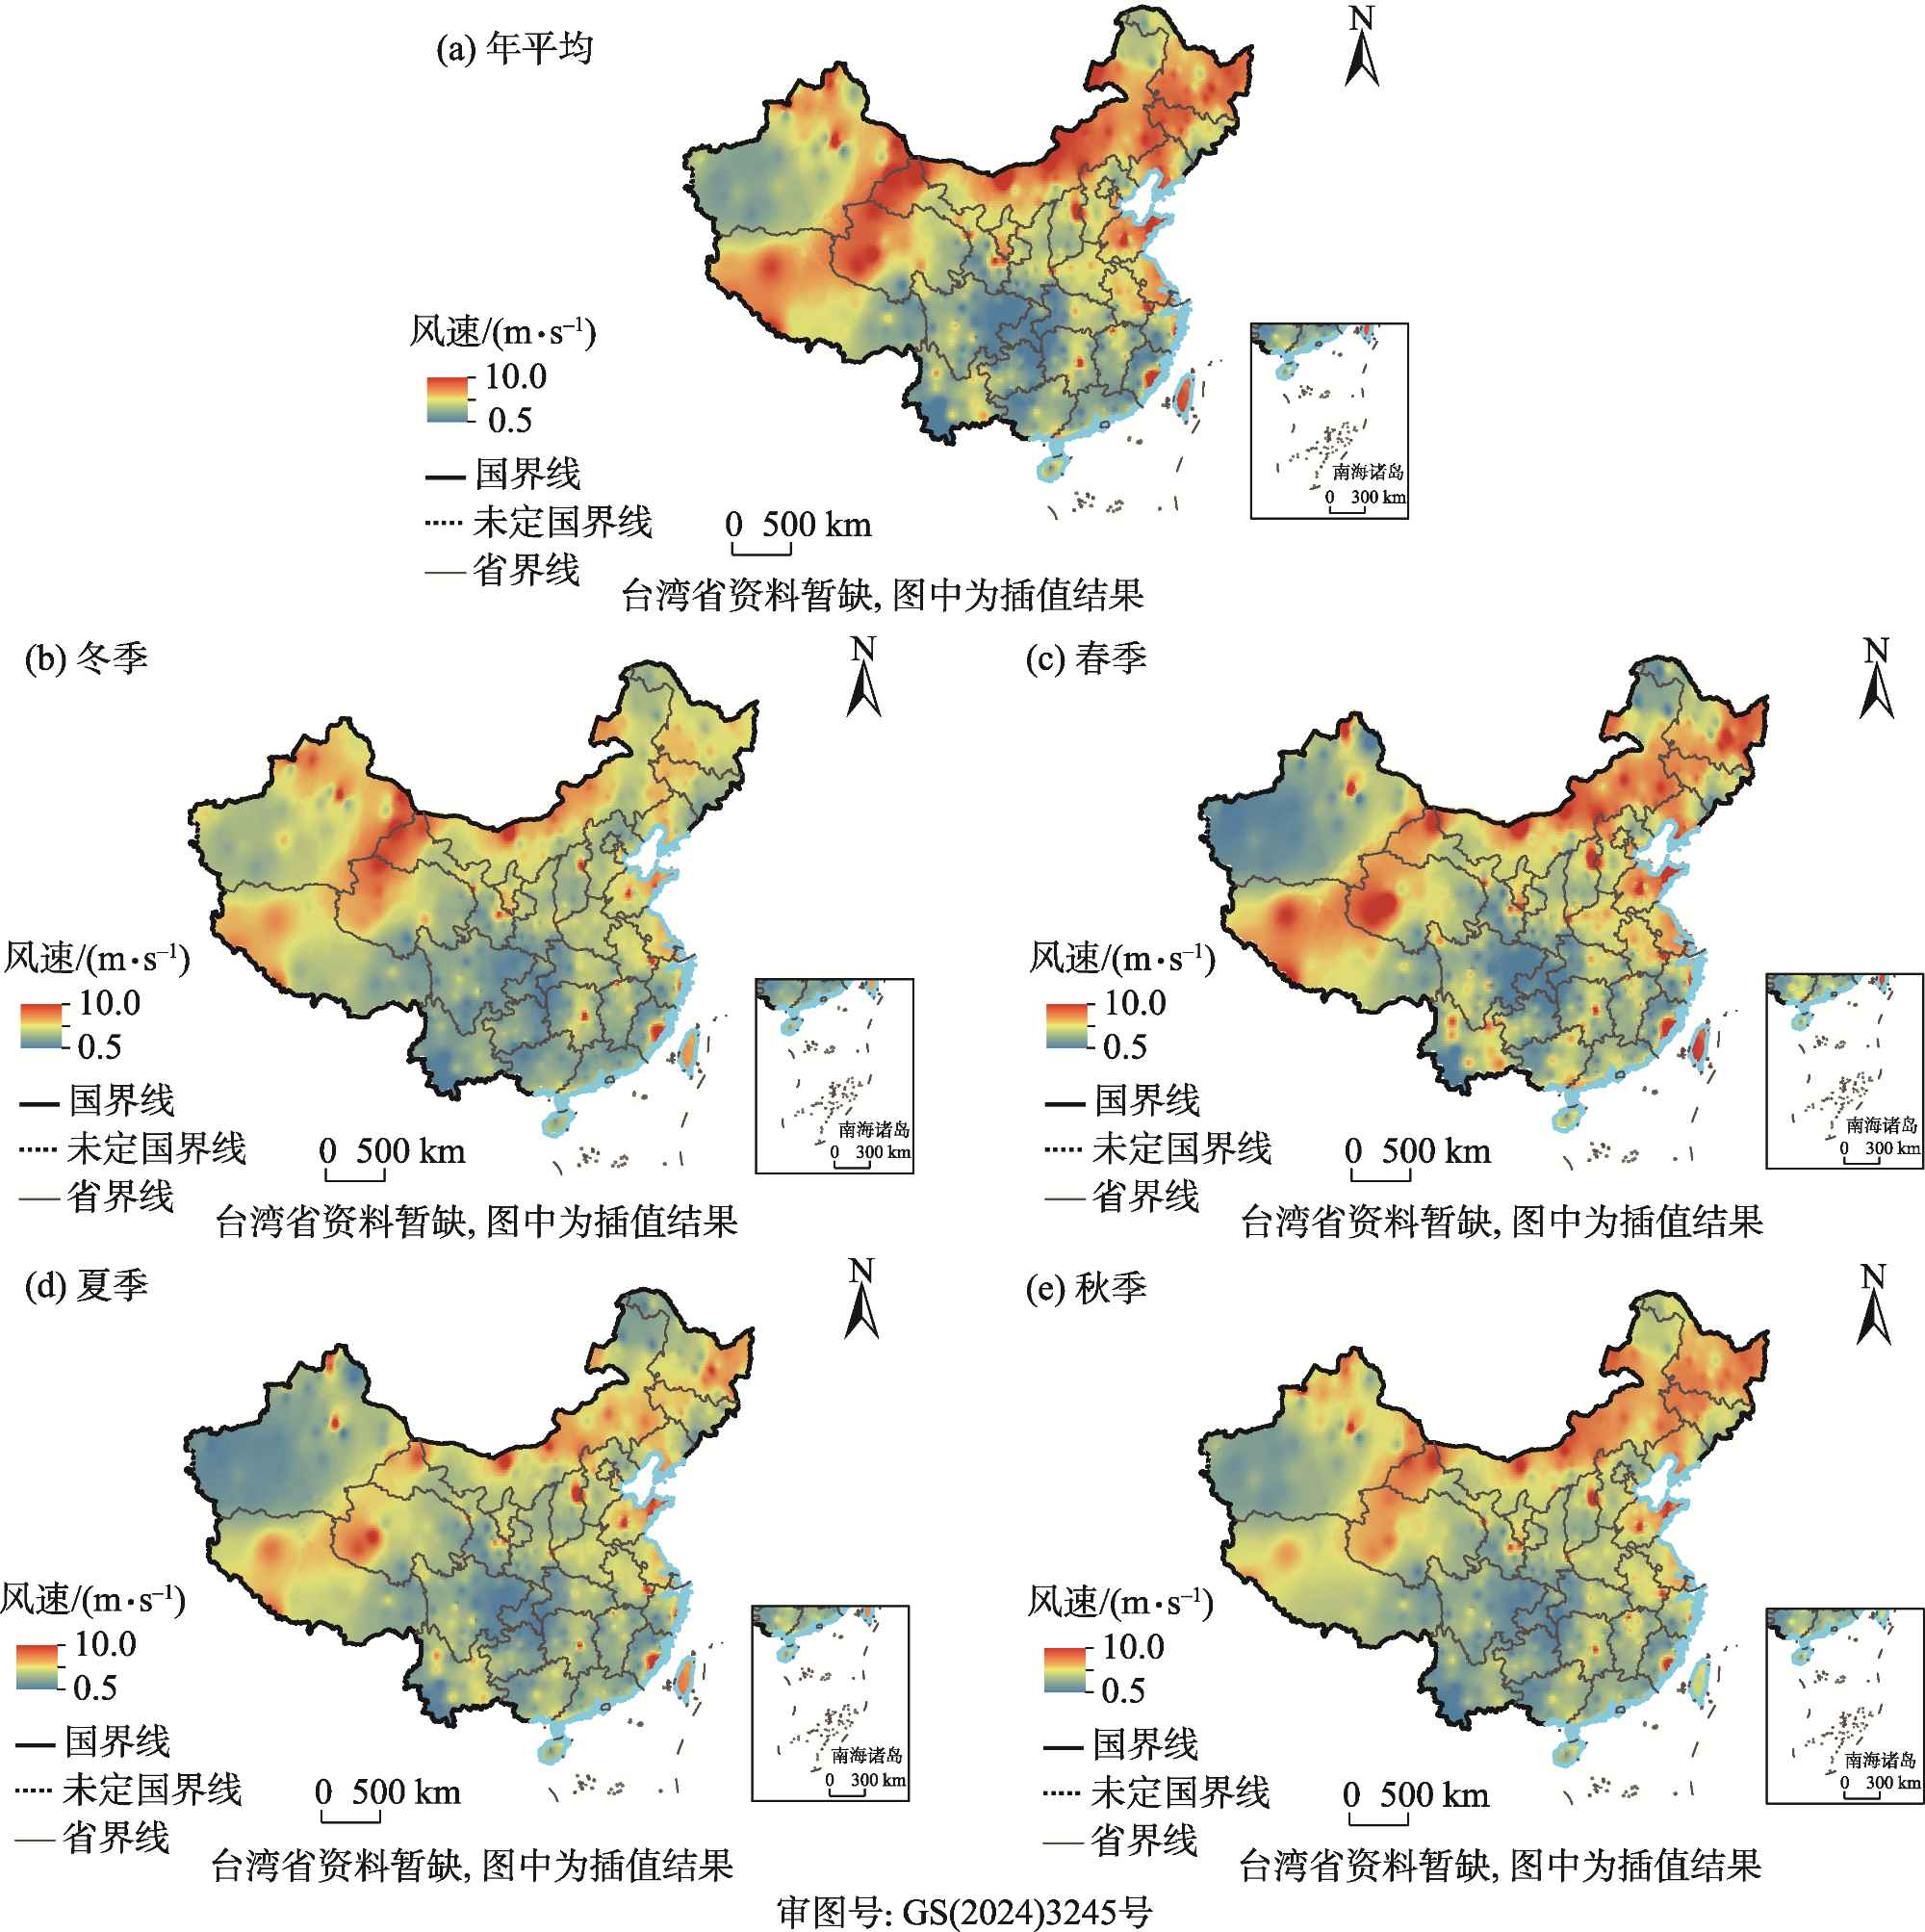
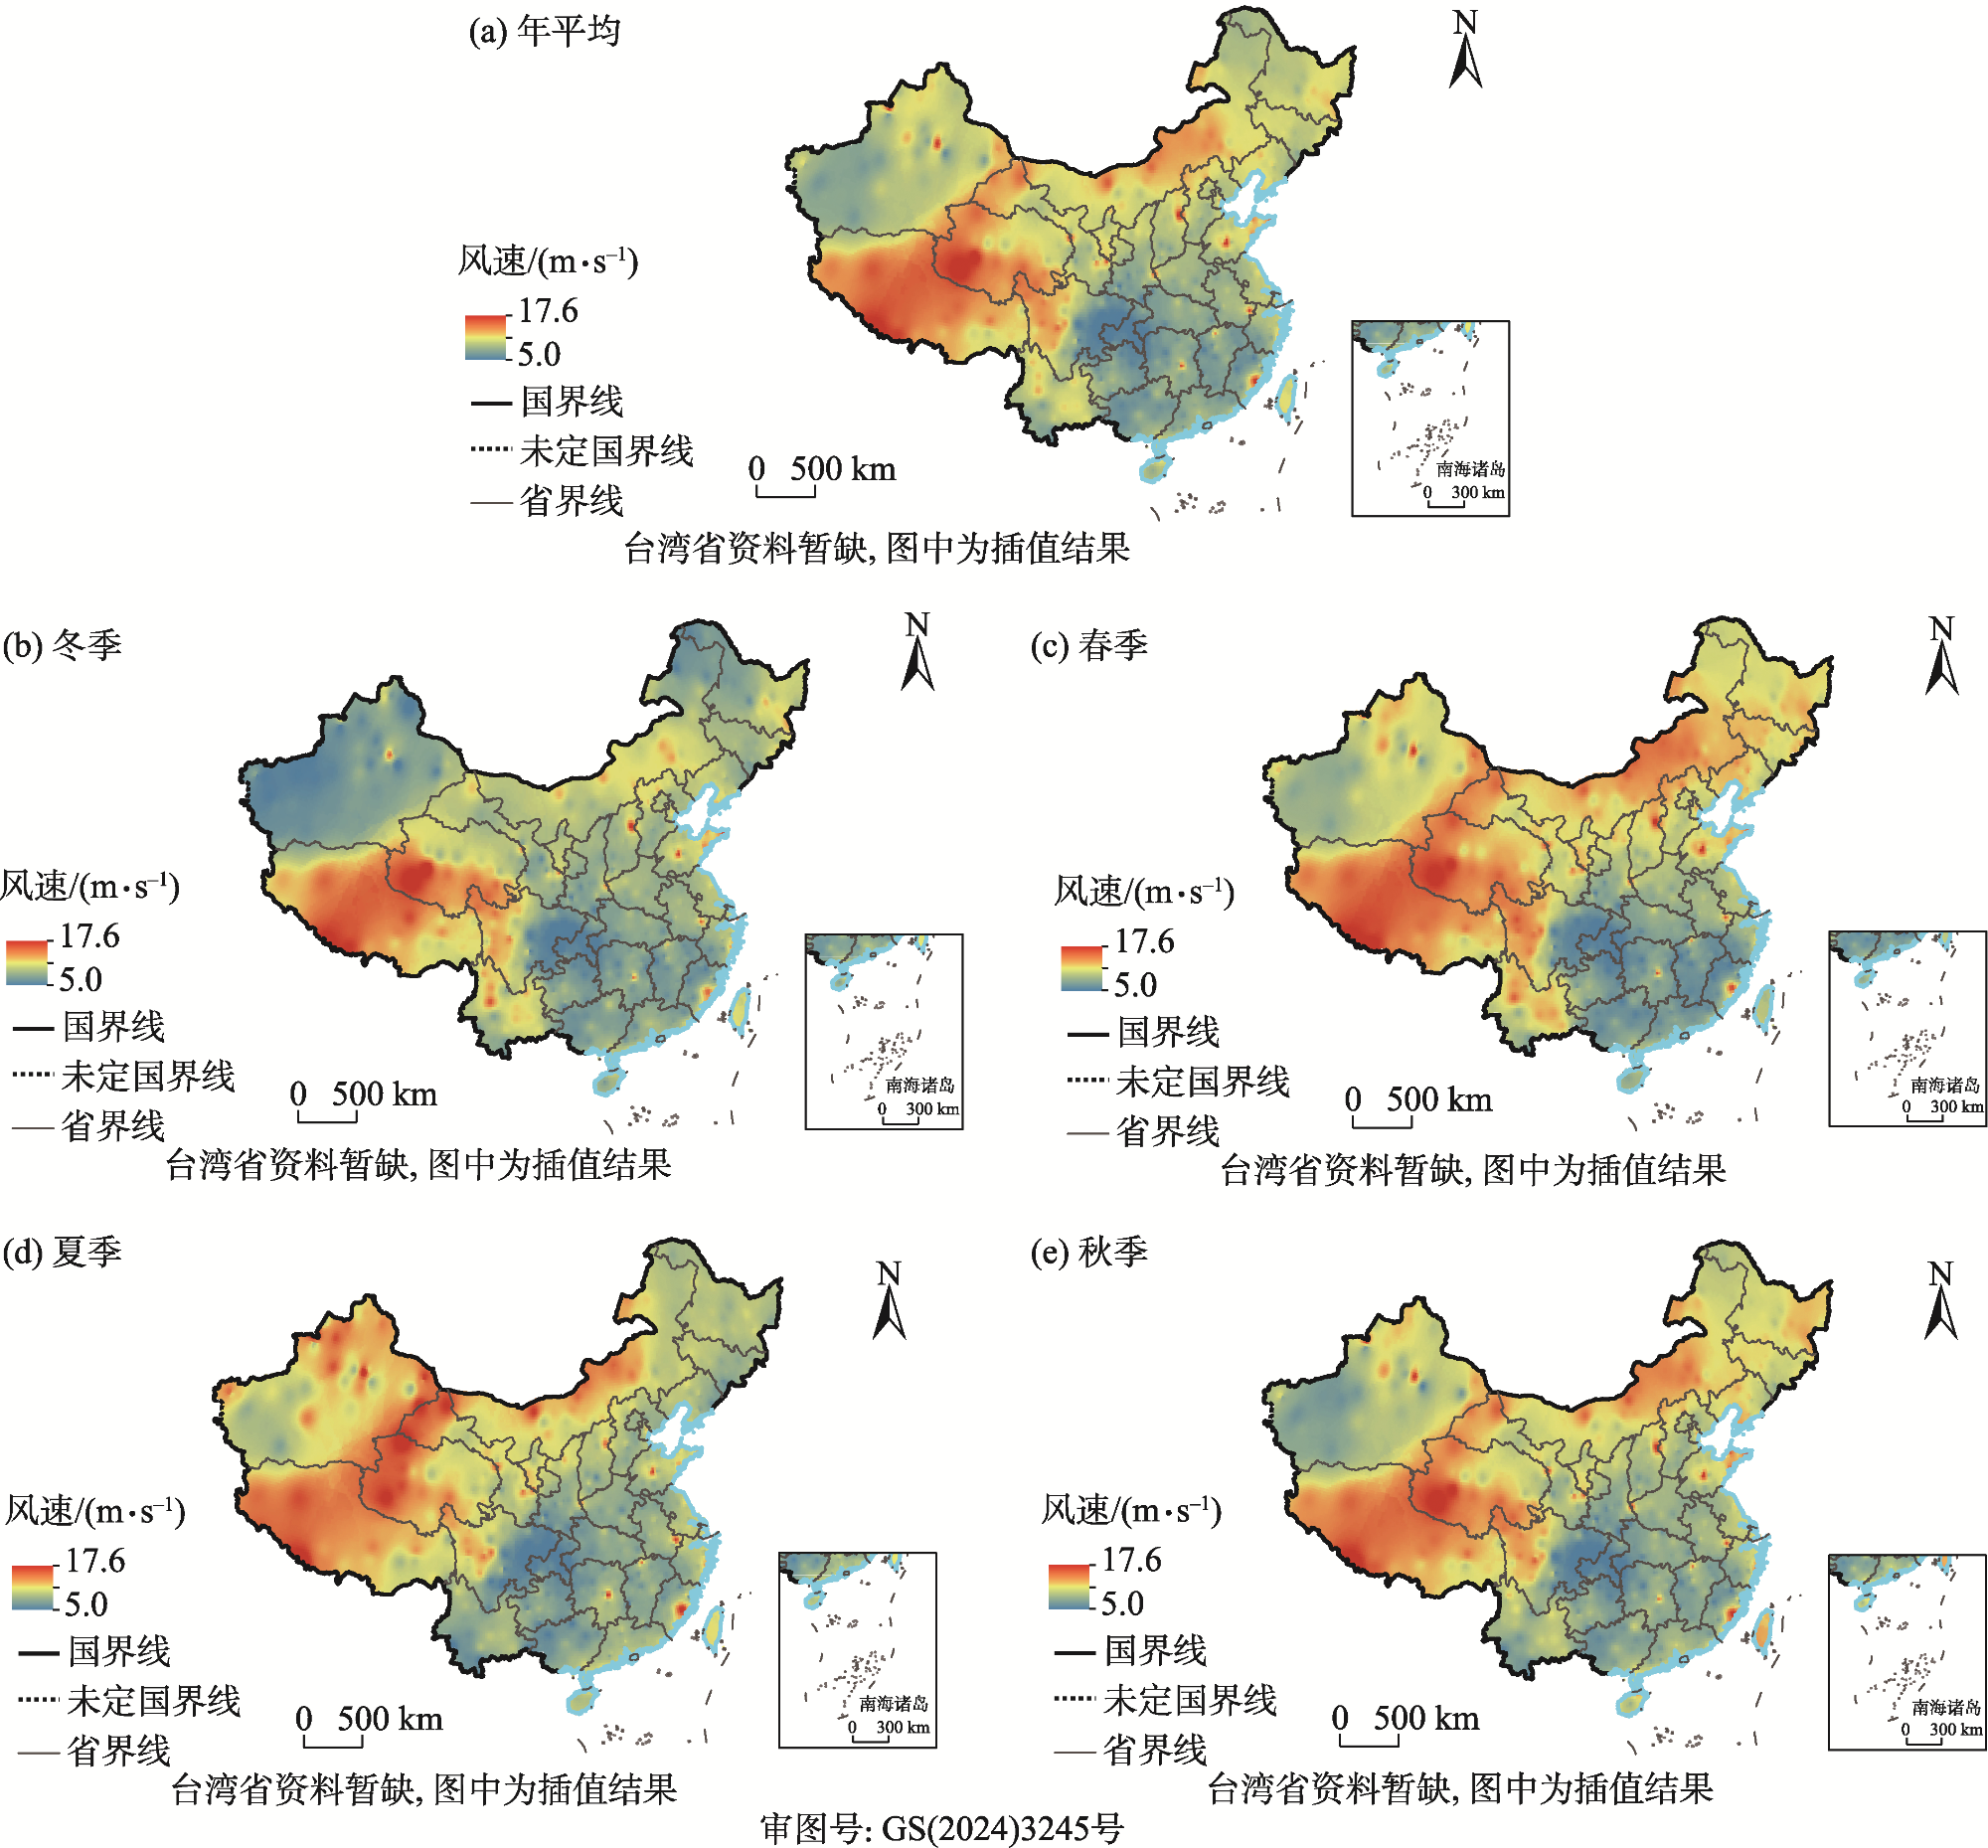
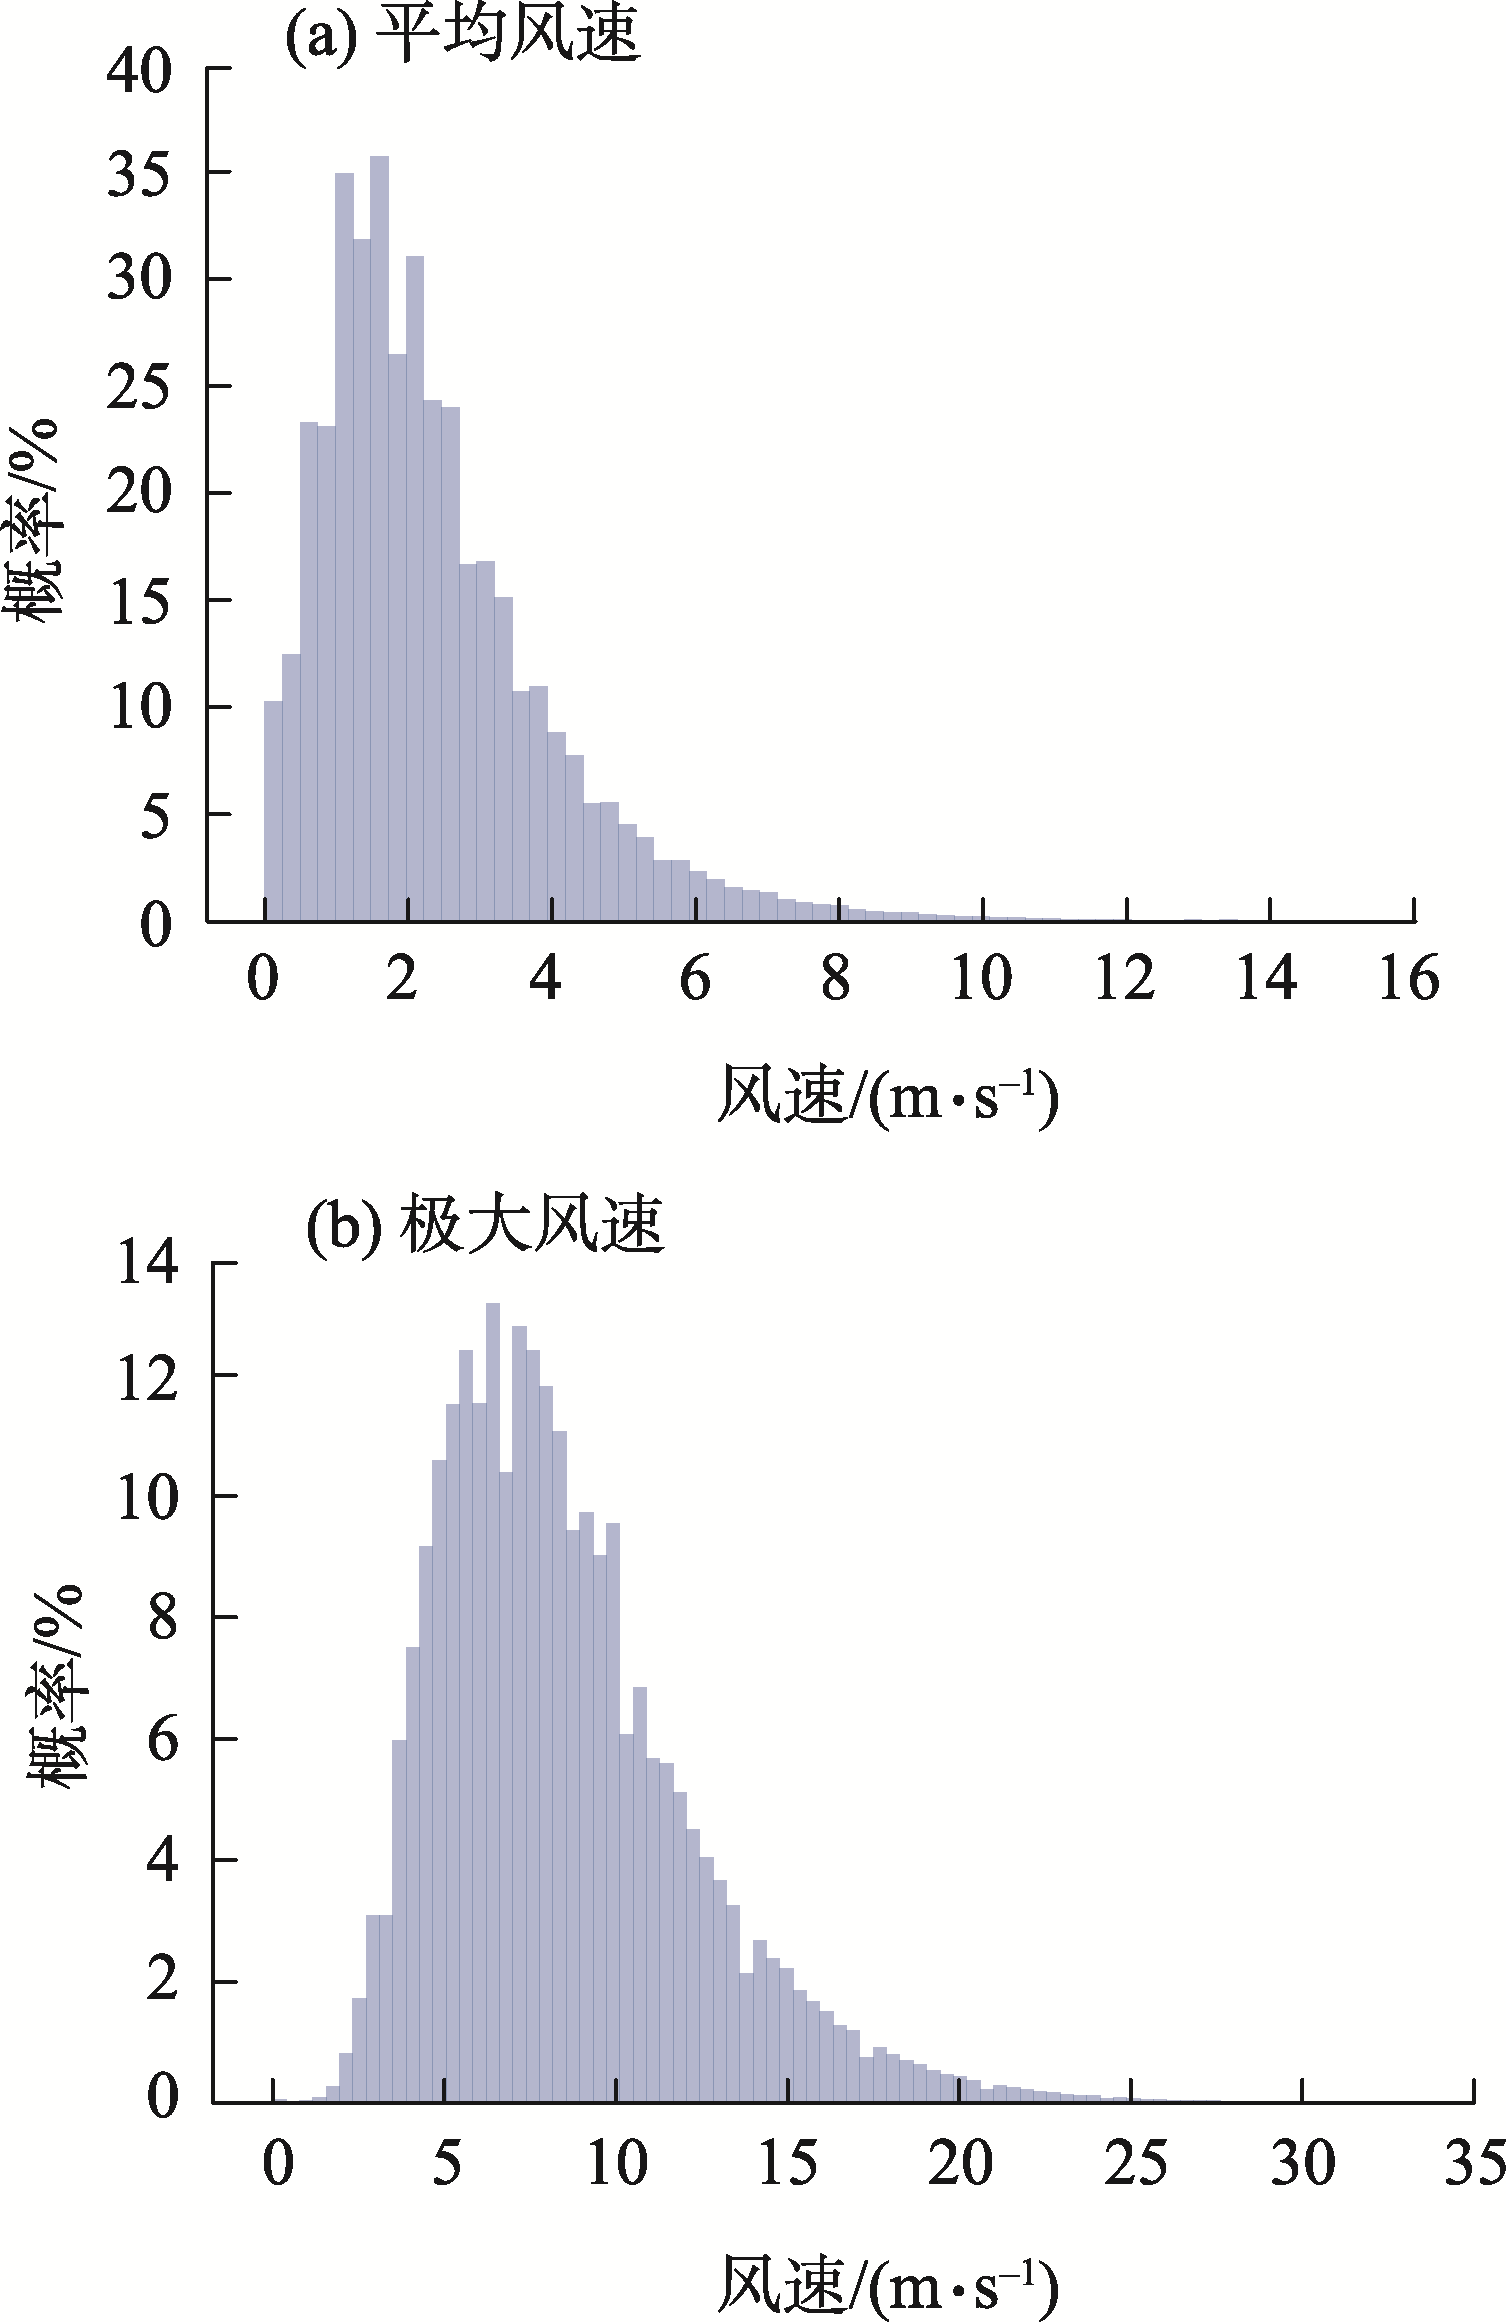
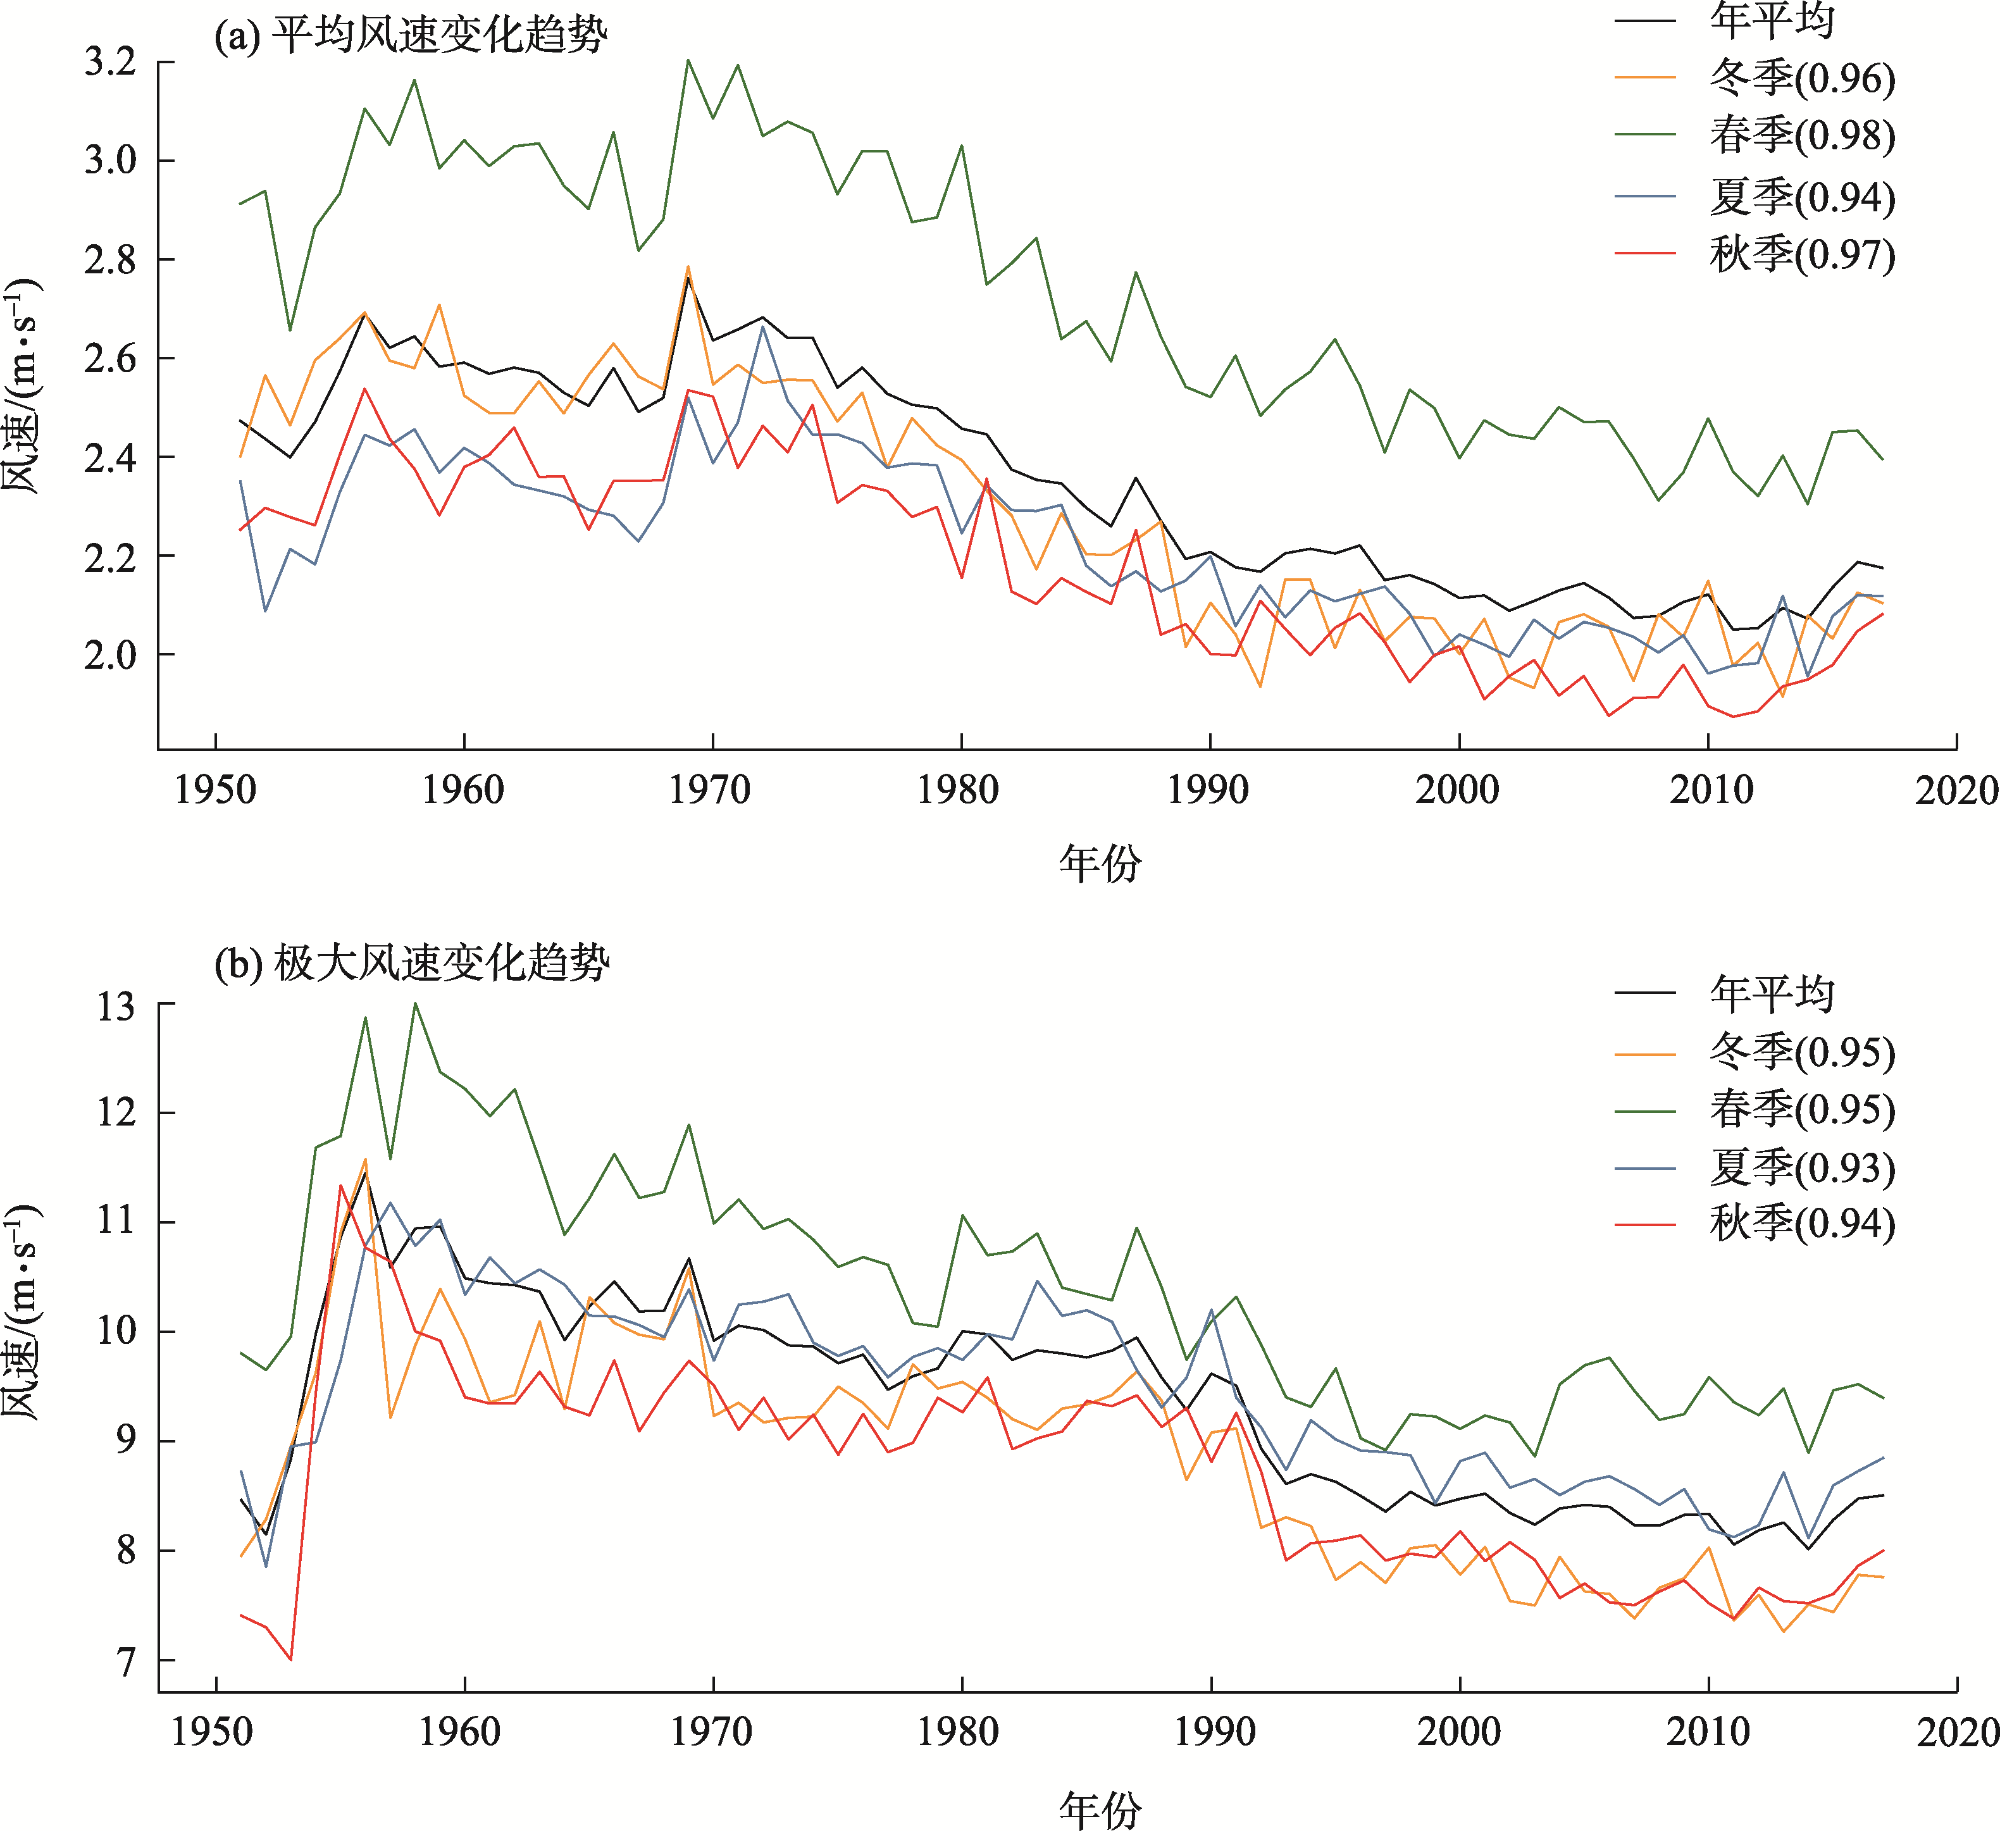
据多项研究指出,中国地表平均风速在全球变暖的背景下呈现长期下降的趋势。而极大风速与平均风速特征变化是否一致,值得我们关注。通过对比分析国家基本气象站1951—2018年的地表日平均风速和日极大风速数据,结果表明:全国范围内,日平均风速主要集中在2 m·s-1左右,而日极大风速主要集中在8 m·s-1左右,这两种风速在青藏高原地区和内蒙古地区较大。此外,日平均风速出现小风速概率更高,而日极大风速的概率分布更接近于正态分布。从1960—2010年,日平均风速下降了19%,而日极大风速下降更为显著,达到20%。然而,在2010年之后,随着全球变暖的加剧,二者均略有回升,尤其是日平均风速的回升更为显著。这一结论强调了在全球变暖背景下持续关注和研究风速变化的重要性,有助于深入了解中国地表风速的变化特征,同时也为风速预报、风能开发等项目提供科学参考。
南宇琨 , 刘鹏 , 王伟 , 陈遗志 . 中国地表日平均风与日极大风气候特征的对比[J]. 干旱区研究, 2024 , 41(9) : 1468 -1479 . DOI: 10.13866/j.azr.2024.09.04
Studies have identified a long-term decline in the mean surface wind speed in China under the background of global warming. However, whether the extreme wind speed is consistent with the mean wind speed is worthy of investigation. Through the comparative analysis of the daily mean wind speed data and daily extreme wind speed data from the national basic weather stations for the years 1951 to 2018, the following conclusions are drawn: Nationwide, the daily mean wind speed is mainly concentrated at approximately 2 m·s-1 and the daily extreme wind speed is mainly concentrated at approximately 8 m·s-1; both wind speeds are larger in the Qinghai-Xizang Plateau and Inner Mongolia. In addition, the daily mean wind speed is more likely to be smaller, whereas the probability distribution of daily extreme wind speed is closer to a normal distribution. From 1960 to 2010, the daily mean wind speed decreased by 19%, while the daily extreme wind speed decreased even more significantly, up to 20%. However, after 2010, with the intensification of global warming, both speeds slightly rebounded; in particular, the daily mean wind speed has increased more significantly. These findings emphasize the importance of continuous attention and research into wind speed changes in the context of global warming, which are extremely helpful in comprehending the characteristics of surface wind speed changes in China, as well as providing a scientific reference for wind speed forecasting and wind energy development projects.
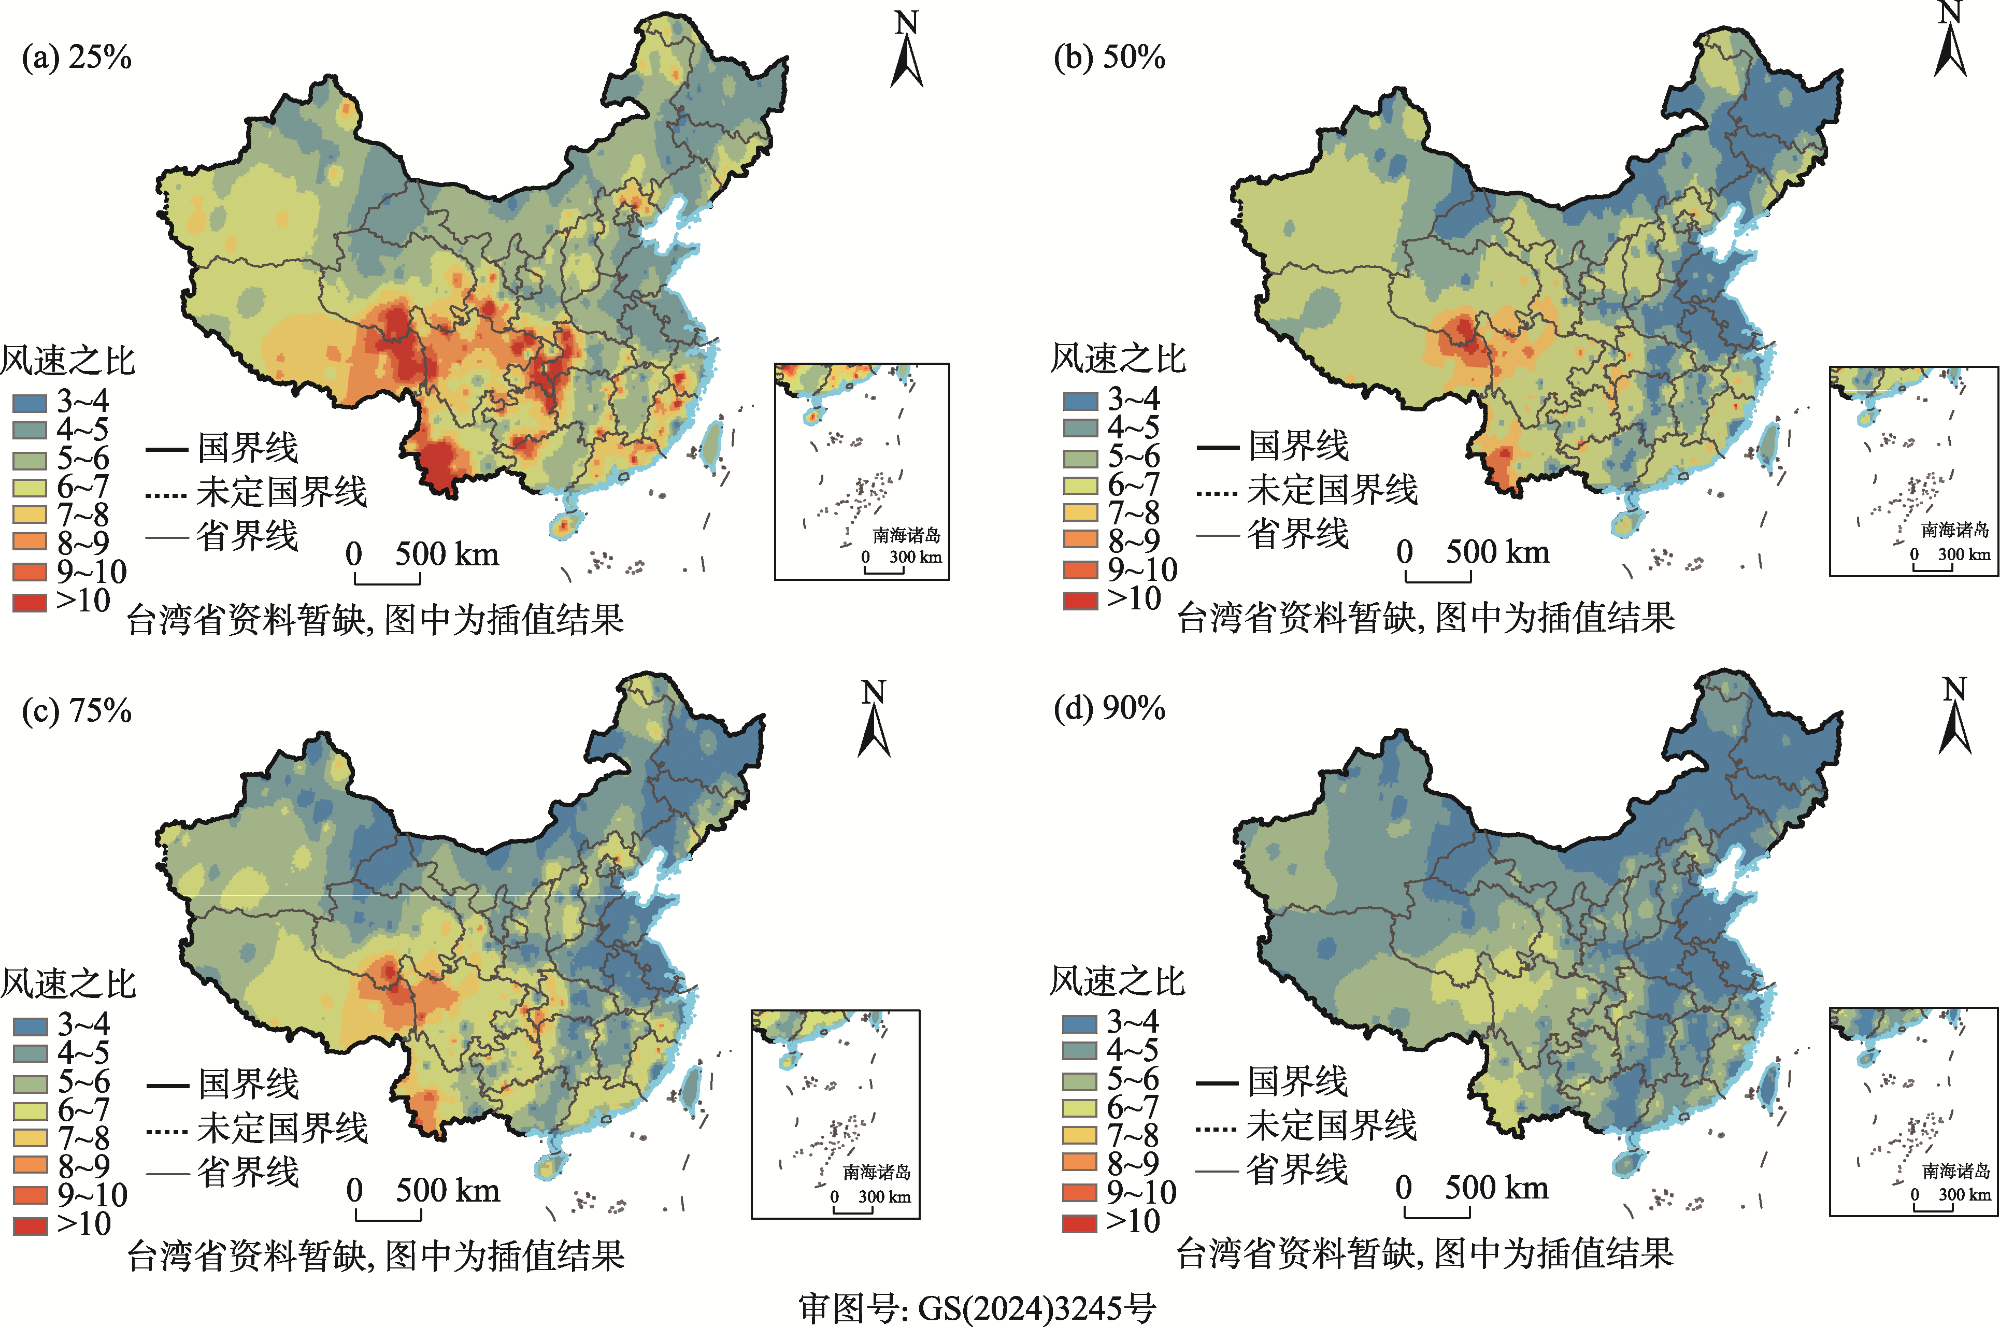
表1 不同阈值的风速及比值Tab. 1 Wind speed and ratio of different thresholds |
| 阈值百分比 | 日平均风速 /(m·s-1) | 日极大风速 /(m·s-1) | 日极大风速: 日平均风速 |
|---|---|---|---|
| 10% | 0.9 | 4.9 | 5.4 |
| 20% | 1.2 | 5.8 | 4.8 |
| 30% | 1.5 | 6.6 | 4.4 |
| 40% | 1.8 | 7.3 | 4.1 |
| 50% | 2.1 | 8.0 | 3.8 |
| 60% | 2.4 | 8.8 | 3.7 |
| 70% | 2.8 | 9.7 | 3.5 |
| 80% | 3.3 | 10.9 | 3.3 |
| 90% | 4.1 | 12.6 | 3.1 |
表2 不同时段日平均风速与日极大风速相关系数Tab. 2 Correlation coefficients between daily mean and extreme wind speed in different periods |
| 时段 | 全年 | 冬季 | 春季 | 夏季 | 秋季 |
|---|---|---|---|---|---|
| 1951—2018年 | 0.86 | 0.85 | 0.86 | 0.83 | 0.74 |
| 1959—2003年 | 0.83 | 0.85 | 0.86 | 0.73 | 0.73 |
| 2003—2018年 | 0.94 | 0.90 | 0.74 | 0.94 | 0.86 |
注:均通过99%显著性检验。 |
表3 日平均风速与日极大风速的增长率Tab. 3 The growth rate of daily mean wind speed and daily extreme wind speed |
| 风速增长率/% | ||||||||
|---|---|---|---|---|---|---|---|---|
| 1960年代 | 1970年代 | 1980年代 | 1990年代 | 2000年代 | 2010年代 | 累计增长率 | ||
| 日平均风 | 全年 | 1.0 | 0.8 | -9.9 | -6.5 | -3.5 | 1.0 | -17.1 |
| 冬季 | -0.8 | -2.1 | -10.7 | -7.5 | -2.3 | 2.7 | -20.7 | |
| 春季 | 1.2 | 1.0 | -9.7 | -7.1 | -4.2 | -0.4 | -19.2 | |
| 夏季 | 1.1 | 4.6 | -9.2 | -5.4 | -3.3 | 0.9 | -11.3 | |
| 秋季 | 1.4 | 0.1 | -9.9 | -5.7 | -4.1 | 1.1 | -17.1 | |
| 日极大风 | 全年 | 3.1 | -5.3 | -0.2 | -10.2 | -4.3 | -0.3 | -17.2 |
| 冬季 | 2.6 | -5.7 | -0.4 | -11.4 | -6.7 | 0.2 | -21.4 | |
| 春季 | 1.7 | -7.8 | -1.4 | -9.9 | -1.9 | 1.1 | -18.2 | |
| 夏季 | 5.5 | -3.7 | -0.3 | -8.4 | -4.9 | -1.7 | -13.5 | |
| 秋季 | 1.2 | -2.8 | 0.8 | -10.4 | -6.2 | -1.2 | -18.6 | |
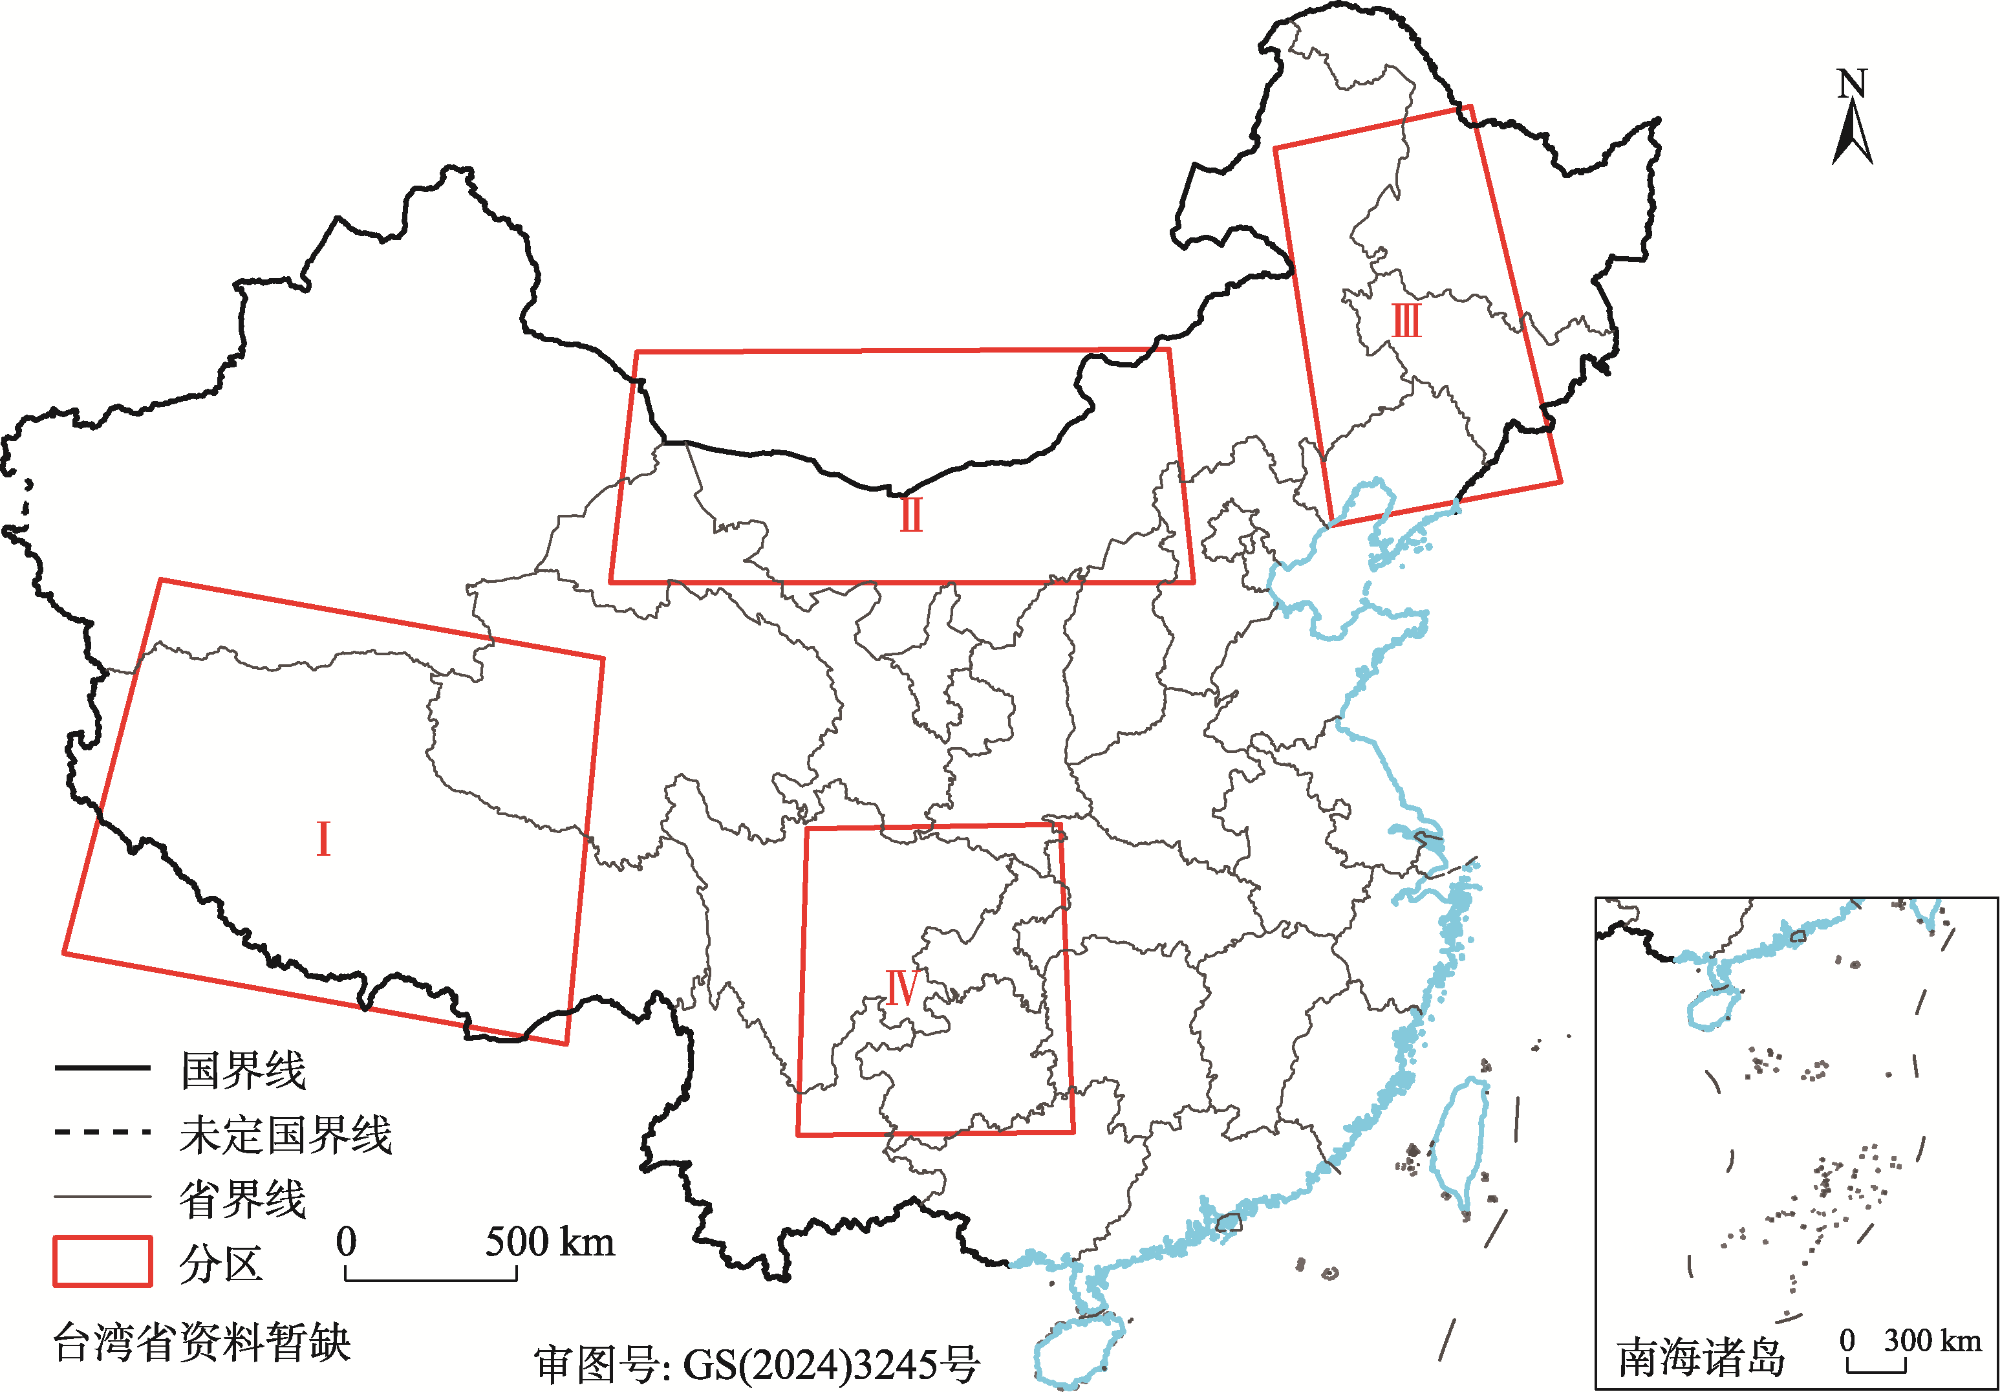
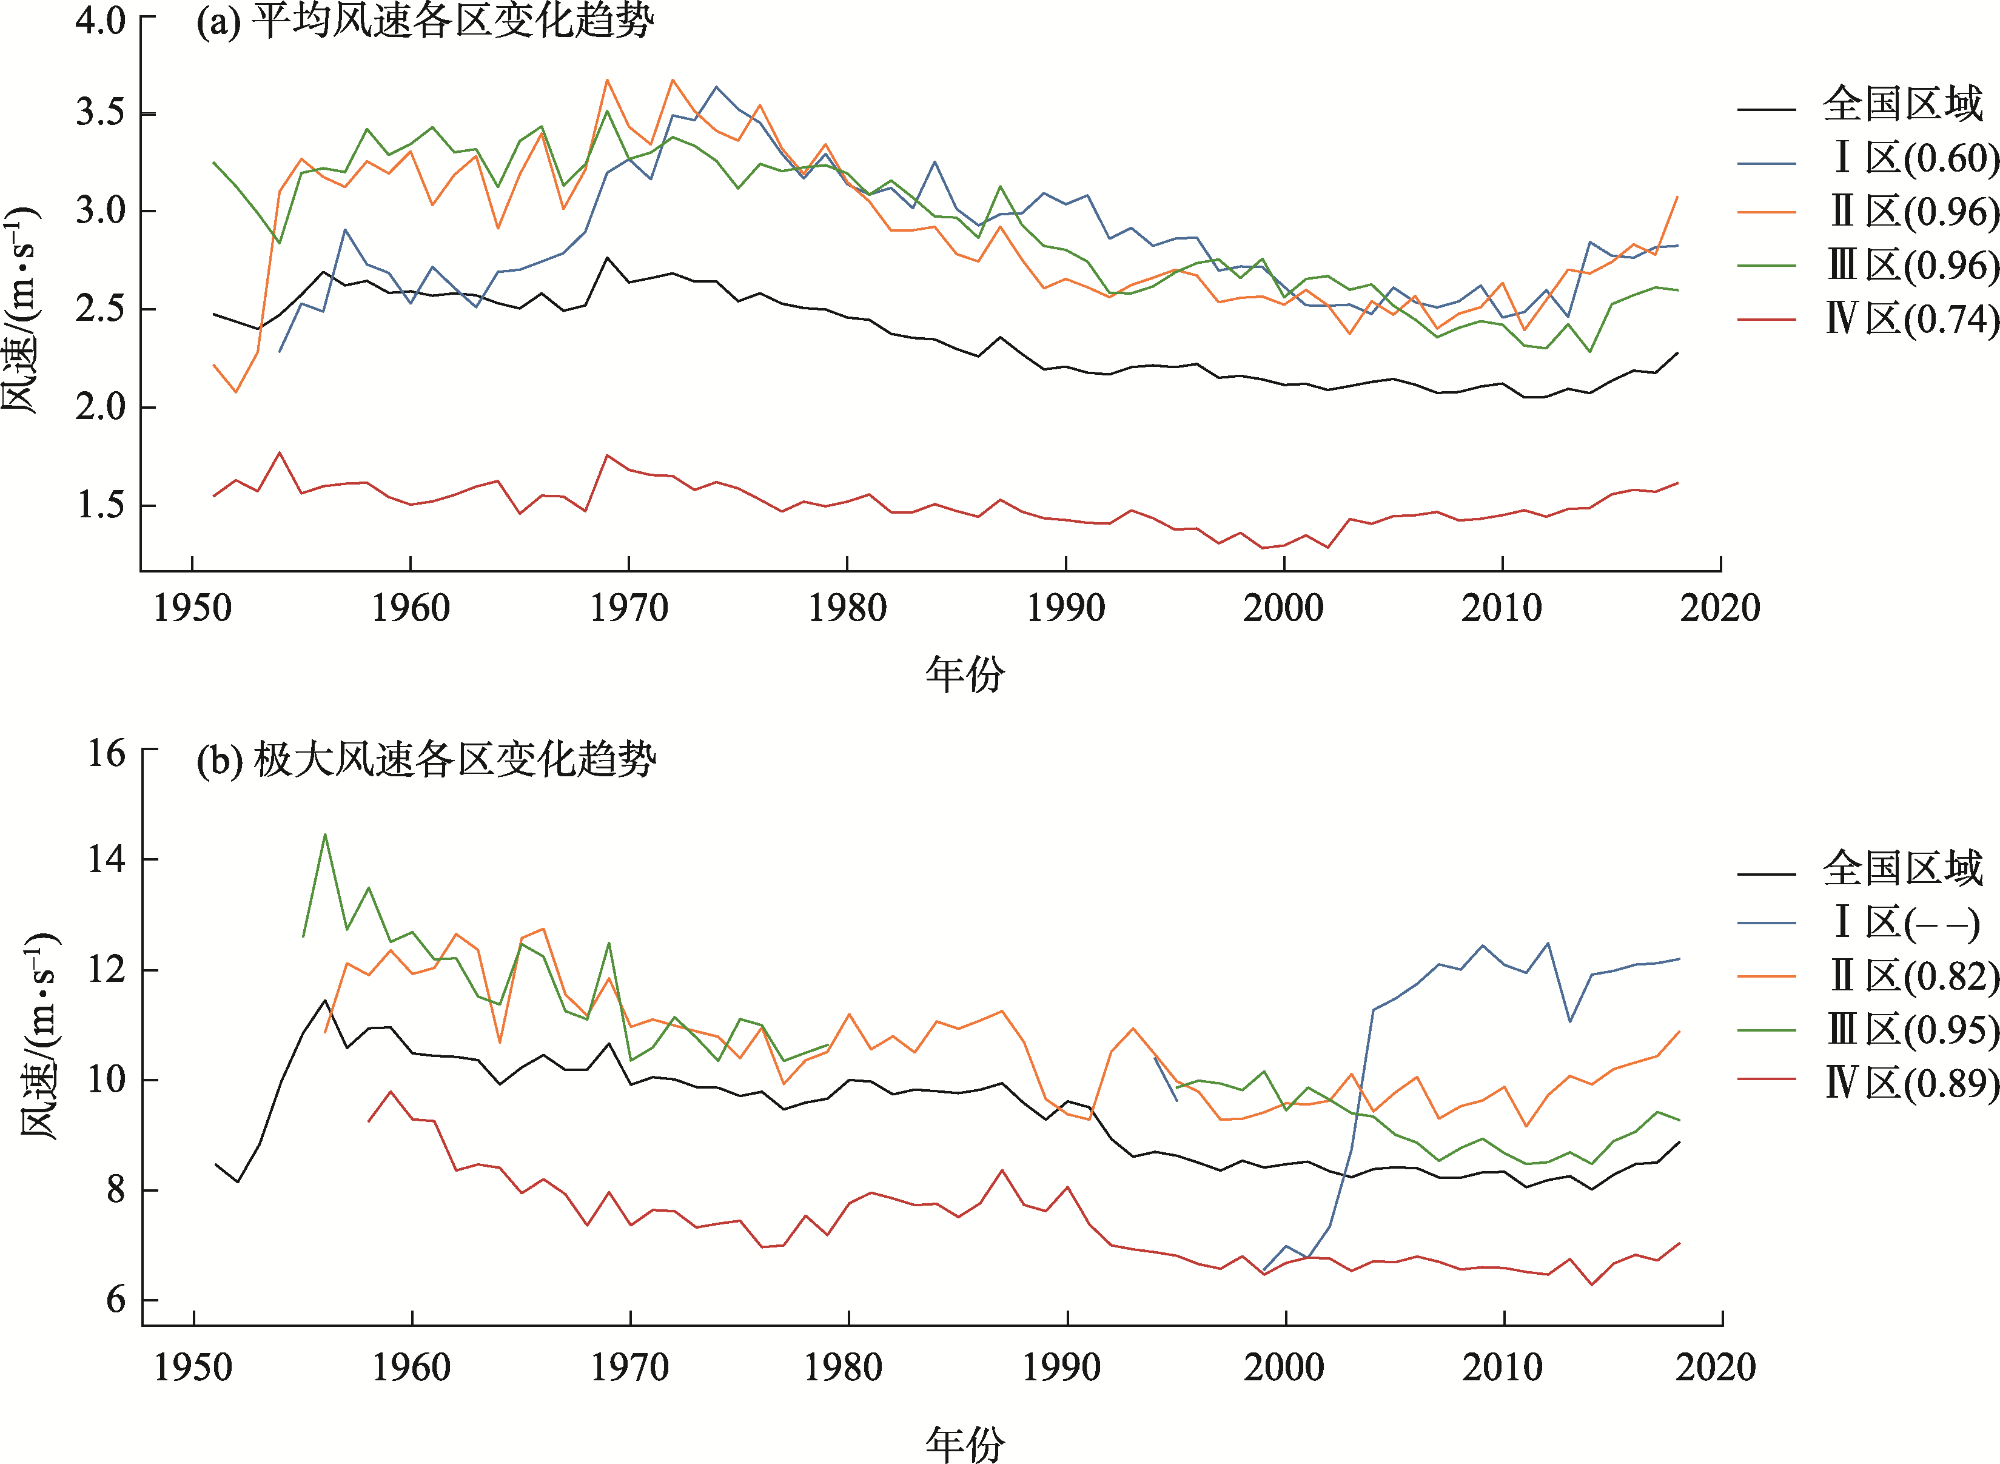
图8 中国风速4个分区的分布注:Ⅰ区范围80°~95°E,27°~37°N;Ⅱ区范围95°~115°E,39°~45°N;Ⅲ区范围120°~128°E,40°~50°N;Ⅳ区范围102°~110°E,25°~33°N,只选择区域内中国站点进行分析。 Fig. 8 The distribution of the four zones of China based on wind speed |
表4 不同时段内全国与各区的日极大风速与日平均风速相关系数Tab. 4 Correlation coefficient between daily extreme wind speed and daily mean wind speed in different periods of time in China and different regions |
| 时段 | 全国 | Ⅰ区 | Ⅱ区 | Ⅲ区 | Ⅳ区 |
|---|---|---|---|---|---|
| 1951—2018年 | 0.86** | - | 0.70** | 0.88** | 0.48** |
| 1959—2003年 | 0.83** | - | 0.62** | 0.55** | 0.52** |
| 2003—2018年 | 0.94** | - | 0.84** | 0.96** | 0.53* |
注:**表示通过99%的显著性检验,*表示通过95%的显著性检验,-表示相关系数暂不计算。 |
| [1] |
温敏, 张人禾, 杨振斌. 气候资源的合理开发利用[J]. 地球科学进展, 2004, 19(6): 896-1002.
[
|
| [2] |
李耀华, 孔力. 发展太阳能和风能发电技术加速推进我国能源转型[J]. 中国科学院院刊, 2019, 34(4): 426-433.
[
|
| [3] |
|
| [4] |
丁一汇, 李霄, 李巧萍. 气候变暖背景下中国地面风速变化研究进展[J]. 应用气象学报, 2020, 31(1): 1-12.
[
|
| [5] |
|
| [6] |
|
| [7] |
|
| [8] |
|
| [9] |
王遵娅, 丁一汇, 何金海, 等. 近50年来中国气候变化特征的再分析[J]. 气象学报, 2004, 62(2): 228-236.
[
|
| [10] |
黄小燕, 张明军, 王圣杰, 等. 西北地区近50年日照时数和风速变化特征[J]. 自然资源学报, 2011, 26(5): 825-835.
[
|
| [11] |
汪宗成, 杨晓玲, 李天江, 等. 武威市平均风速变化特征及其对气候变暖的响应[J]. 江西农业学报, 2018, 30(12): 70-75, 82.
[
|
| [12] |
|
| [13] |
朱蓉, 王阳, 向洋, 等. 中国风能资源气候特征和开发潜力研究[J]. 太阳能学报, 2021, 42(6): 409-418.
[
|
| [14] |
熊敏诠. 近30年中国地面风速分区及气候特征[J]. 高原气象. 2015, 34(1): 39-49.
[
|
| [15] |
|
| [16] |
|
| [17] |
|
| [18] |
|
| [19] |
|
| [20] |
林湘宁, 丁苏阳, 王子璇, 等. 恶劣风况下的风机最大容许出力模型及其控制策略[J]. 中国电机工程学报, 2020, 40(1): 309-317, 397.
[
|
| [21] |
范兰艳, 冯淑霞, 李书君, 等. 我国北方沙尘暴天气气候特征及成因分析[J]. 现代农业科技, 2016, (3): 276-277.
[
|
| [22] |
|
| [23] |
|
| [24] |
何云燕, 林确略, 杨礼林, 等. 2010年后汛期一次东风波雷雨大风天气分析[J]. 安徽农业科学, 2012, 40(4): 2264-2267, 2317.
[
|
| [25] |
郑祚芳, 张秀丽, 丁海燕. 近50年北京地区主要灾害性天气事件变化趋势[J]. 自然灾害学报, 2012, 21(1): 47-52.
[
|
| [26] |
何志强, 卢新平, 王丙兰. 首都机场雷暴大风的初步研究[J]. 气象, 2014, 40(11): 1408-1413.
[
|
| [27] |
方翀, 王西贵, 盛杰, 等. 华北地区雷暴大风的时空分布及物理量统计特征分析[J]. 高原气象, 2017, 36(5): 1368-1385.
[
|
| [28] |
王慧, 张璐, 石兴东, 等. 2000年后青藏高原区域气候的一些新变化[J]. 地球科学进展, 2021, 36(8): 785-796.
[
|
| [29] |
|
| [30] |
|
| [31] |
刘田, 阳坤, 秦军, 等. 青藏高原中、东部气象站降水资料时间序列的构建与应用[J]. 高原气象, 2018, 37(6): 1449-1457.
[
|
/
| 〈 |
|
〉 |