
新疆耕地利用碳源/汇效应时空演变特征及其贡献因子
|
吕宁(1985-),女,副研究员,从事干旱区农业资源与农田生态环境研究. E-mail: lvning20030118@163.com |
收稿日期: 2024-07-08
修回日期: 2024-11-11
网络出版日期: 2025-08-13
基金资助
新疆兵团科技创新人才计划(2022CB028)
国家重点研发计划资助(2022YFD1900405-3)
第三次新疆综合科学考察项目(2022xjkk1002)
国家自然科学基金(42177224)
国家自然科学基金(42277241)
中国工程院战略研究与咨询项目(2023-XY-34)
新疆兵团英才支持计划(2022)
Spatiotemporal evolution characteristics and contributing factors of the carbon effect in cultivated land use in Xinjiang
Received date: 2024-07-08
Revised date: 2024-11-11
Online published: 2025-08-13
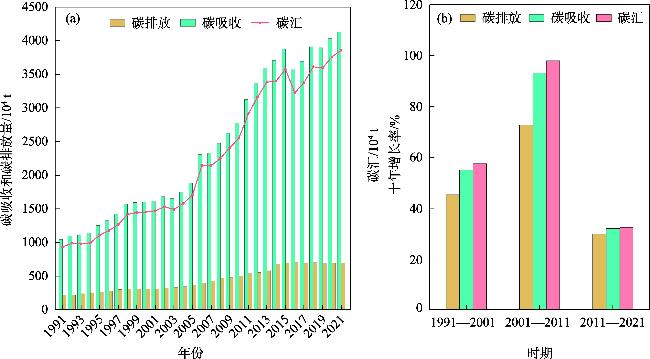
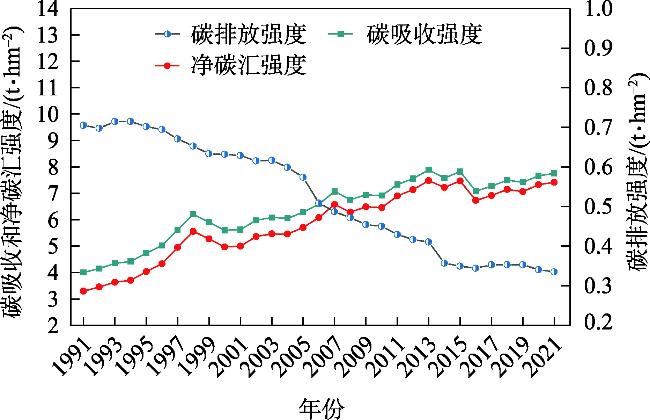
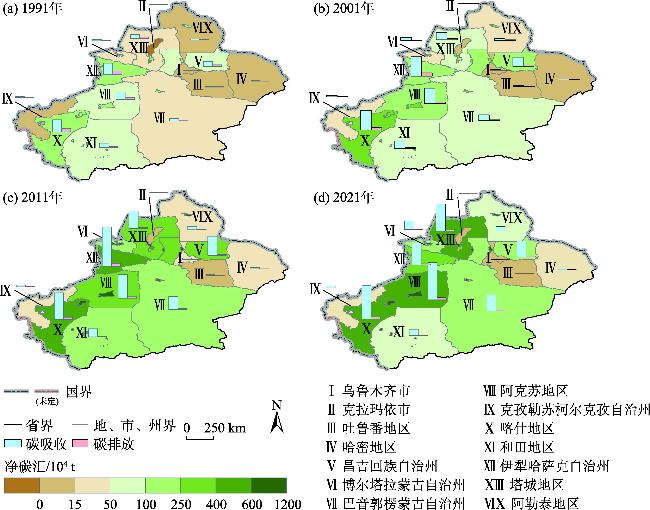
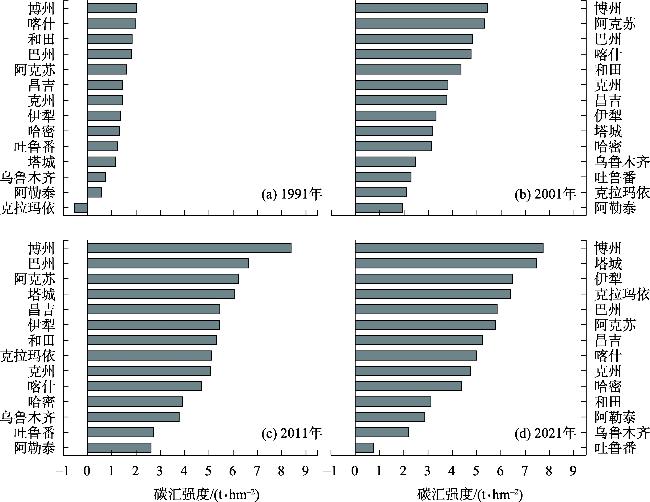
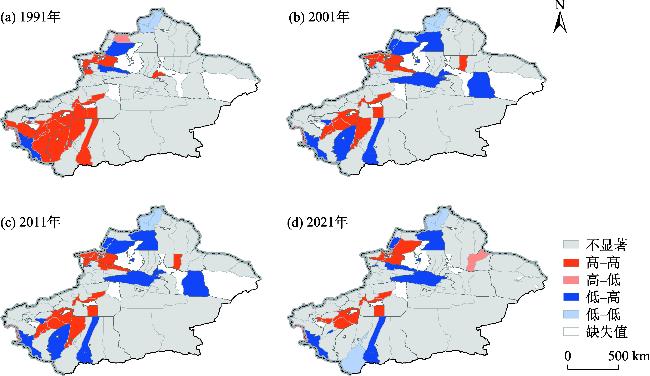
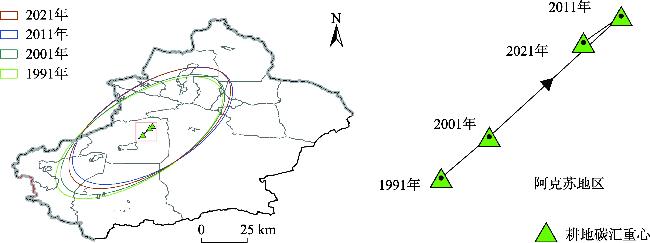
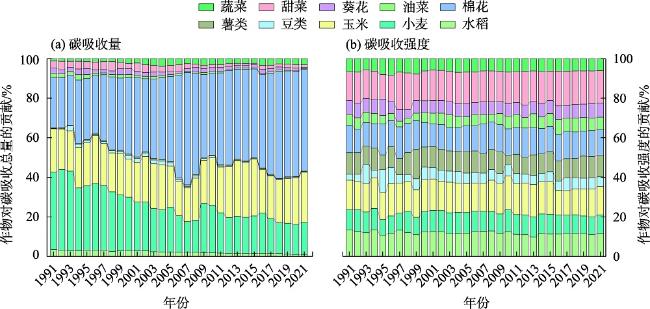
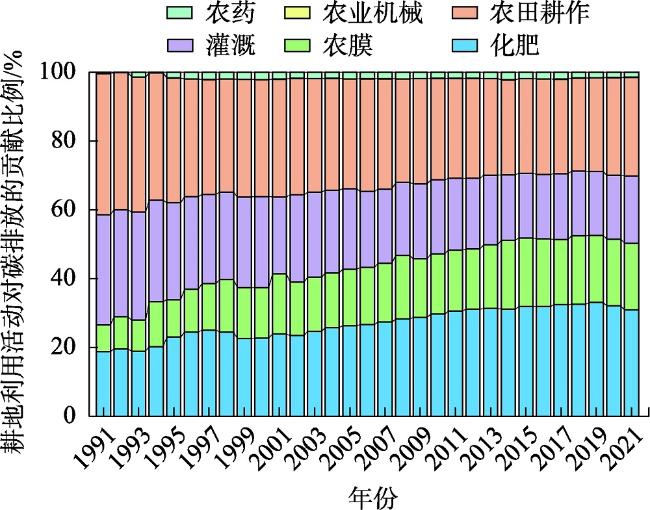
为探明新疆耕地利用碳效应的长周期时空变化特征,准确评估其固碳增汇潜力,本文通过收集1991—2021年的新疆农业数据,采用碳吸收和排放系数法,测度分析新疆耕地利用过程碳排放量、碳吸收量、碳汇量的时序动态,并利用莫兰指数、标准差椭圆和重心迁移分析耕地碳效应的空间分异、自相关性和演变特征,并揭示了其主要贡献因子。结果表明:(1) 新疆耕地的碳吸收量远超碳排放量,总体表现为强的碳汇效应,且随时间推移碳汇能力呈增强态势,由1991年的830×104 t增长至2021年的3429×104 t。(2) 强碳汇区域主要分布在耕地面积大且以种植玉米、小麦、棉花为主的生产区。(3) 在县域尺度上耕地净碳汇具有显著的空间集聚特征,过去30 a耕地碳汇的重心总体上呈现由西南向东北迁移趋势,但仍集中于南疆的阿克苏地区。(4) 施用化肥、机械作业、灌溉和农膜是主要的碳排放来源,其中,化肥和农膜投入对耕地碳排放贡献呈增加趋势。基于以上研究结果,提出可通过适度增加耕地面积、扩大南疆棉花和粮油作物种植布局、因地制宜推广麦后复播玉米、大豆、棉花提高复种指数、加大绿色农资物品投入等措施,在提高耕地产能保障粮食安全的同时,增强新疆耕地利用的碳汇效应。
吕宁 , 国语 , 彭琴 , 尹飞虎 , 张嘉淇 , 刘杏认 , 曾梅 , 许子函 . 新疆耕地利用碳源/汇效应时空演变特征及其贡献因子[J]. 干旱区研究, 2025 , 42(1) : 179 -190 . DOI: 10.13866/j.azr.2025.01.16
Using agricultural data from Xinjiang from 1991 to 2021, this study examined the temporal variations in carbon effects induced by cultivation in the region by using the carbon absorption and emission coefficient method. The spatial correlation, distribution, and evolution patterns of these carbon effects were explored by integrating Moran’s I, centroid migration, and the standard deviational elliptical model. The aim of this paper was to investigate the spatiotemporal dynamics of carbon effect changes in cultivated land over a long-term series in Xinjiang and to assess the region’s potential for carbon sequestration. The results were as follows: (1) Carbon absorption in Xinjiang’s cultivated land significantly exceeded carbon emissions, demonstrating a net carbon sink effect. Furthermore, the carbon sink capacity had consistently increased, rising from 8.3 million tons in 1991 to 34.29 million tons in 2021. (2) Regions with strong carbon sink capacity were concentrated in areas with extensive cultivated land and high production of corn, wheat, and cotton. (3) The net carbon sink of cultivated land exhibits significant spatial agglomeration patterns at the county and city scales, with the center of gravity of cropland carbon sinks generally migrating to the northeast. However, over the past 30 years, it has remained situated in the Aksu region of southern Xinjiang. (4) Cropland carbon sinks are primarily attributed to carbon absorption by cotton, wheat, and corn. Conversely, the main sources of carbon emissions include the application of chemical fertilizers, farmland tillage, irrigation, and the use of agricultural films. Notably, the contribution of chemical fertilizers and agricultural films to carbon emissions is on the rise. Based on these findings, we propose an appropriate expansion of the cultivated land area and increasing the cultivation of cotton, as well as grain and oil crops in southern Xinjiang. Additionally, we should promote the planting of corn and cotton in accordance with local conditions and boost the investment in green agricultural technologies and materials to improve the production capacity of cultivated land, ensure food security, and enhance carbon sequestration.
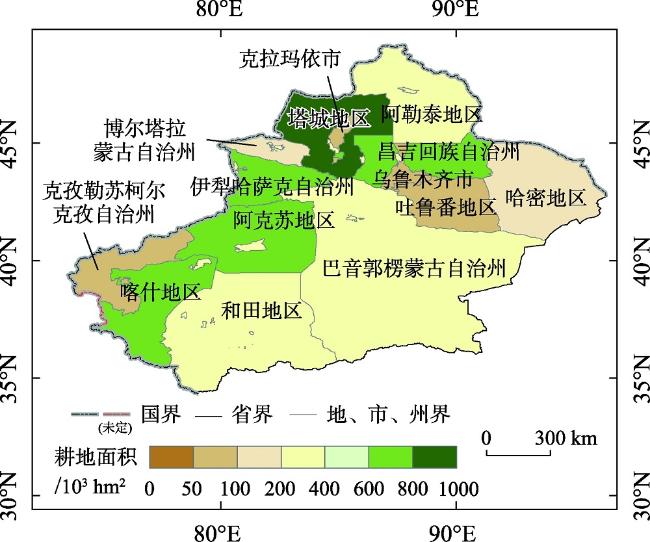
图1 新疆耕地分布示意图注:底图采用自然资源部标准地图制作,审图号为GS(2024)0650号,对底图边界无修改。下同。 Fig. 1 Distribution map of cultivated land in Xinjiang |
表1 2019年新疆耕地类型及占比Tab. 1 Type and proportion of cultivated land use in Xinjiang in 2019 |
| 区域 | 地州(市) | 耕地面积/103 hm2 | 水浇地/103 hm2 | 水浇地占比/% | 旱地面积/103 hm2 | 旱地占比/% |
|---|---|---|---|---|---|---|
| 北疆 | 乌鲁木齐市 | 73.77 | 61.87 | 83.87 | 3.79 | 5.13 |
| 昌吉回族自治州 | 742.17 | 695.87 | 93.76 | 45.57 | 6.14 | |
| 克拉玛依市 | 66.39 | 66.39 | 100.00 | 0.00 | 0.00 | |
| 伊犁哈萨克自治州 | 681.57 | 541.65 | 79.47 | 121.17 | 17.78 | |
| 阿勒泰地区 | 282.01 | 278.65 | 98.81 | 3.37 | 1.19 | |
| 塔城地区 | 815.12 | 778.55 | 95.51 | 36.05 | 4.42 | |
| 博尔塔拉蒙古自治州 | 187.69 | 187.69 | 100.00 | 0.00 | 0.00 | |
| 南疆 | 吐鲁番市 | 58.65 | 58.65 | 100.00 | 0.00 | 0.00 |
| 哈密市 | 100.21 | 100.13 | 99.92 | 0.08 | 0.08 | |
| 巴音郭楞蒙古自治州 | 379.12 | 379.12 | 100.00 | 0.00 | 0.00 | |
| 阿克苏地区 | 659.37 | 641.35 | 97.27 | 0.05 | 0.01 | |
| 克孜勒苏柯尔克孜自治州 | 57.06 | 55.69 | 97.60 | 0.47 | 0.82 | |
| 喀什地区 | 709.96 | 706.33 | 99.49 | 0.43 | 0.06 | |
| 和田地区 | 226.46 | 220.56 | 97.39 | 0.00 | 0.00 |
表2 农作物的碳吸收率与经济系数Tab. 2 Carbon absorption rate and economic coefficient of crops |
| 品种 | 经济系数 | 含水量 | 碳吸收率 |
|---|---|---|---|
| 水稻 | 0.45 | 0.12 | 0.414 |
| 小麦 | 0.40 | 0.12 | 0.485 |
| 玉米 | 0.40 | 0.13 | 0.471 |
| 棉花 | 0.10 | 0.08 | 0.450 |
| 豆类 | 0.34 | 0.13 | 0.450 |
| 甜菜 | 0.70 | 0.75 | 0.407 |
| 葵花 | 0.30 | 0.10 | 0.450 |
| 油菜 | 0.45 | 0.10 | 0.250 |
| 薯类 | 0.42 | 0.70 | 0.700 |
| 蔬菜 | 0.45 | 0.90 | 0.300 |
表3 不同耕地利用途径的碳排放系数及参考来源Tab. 3 Carbon emission co-efficients for different cultivated land use pathways and reference sources |
表4 新疆各地州(市)耕地碳汇全局莫兰指数及显著性Tab. 4 Global Moran’s I of carbon sink in cultivated land in counties and cities of Xinjiang |
| 年份 | Global Moran’s I | P值 |
|---|---|---|
| 1991 | 0.296 | 0.0002 |
| 2001 | 0.207 | 0.0010 |
| 2011 | 0.205 | 0.0140 |
| 2021 | 0.215 | 0.0049 |
文中相关调查数据的获取得到了新疆维吾尔自治区农业农村厅的大力支持,建模分析得到了中国科学院地理科学与资源研究所齐玉春老师的悉心指导,在此表示衷心的感谢!
| [1] |
|
| [2] |
赵明月, 刘源鑫, 张雪艳. 农田生态系统碳汇研究进展[J]. 生态学报, 2022, 42(23): 9405-9416.
[
|
| [3] |
|
| [4] |
宋艳华, 王自威, 袁晨光, 等. 河南省耕地质量变化对农田固碳能力的影响[J]. 地域研究与开发, 2023, 42(4): 143-148, 180.
[
|
| [5] |
|
| [6] |
|
| [7] |
方精云. 碳中和的生态学透视[J]. 植物生态学报, 2021, 45(11): 1173-1176.
[
|
| [8] |
|
| [9] |
包佳玉, 李祥龙, 胡启文, 等. 新疆能源消费碳排放时空特征及能源结构调整路径探讨[J]. 干旱区研究, 2024, 41(3): 490-498.
[
|
| [10] |
宋梅, 时佳. 新疆碳排放估算及其特征分析[J]. 干旱区研究, 2014, 31(1): 188-191.
[
|
| [11] |
唐洪松, 马惠兰, 苏洋, 等. 新疆不同土地利用类型的碳排放与碳吸收[J]. 干旱区研究, 2016, 33(3): 486-492.
[
|
| [12] |
苏洋, 马惠兰, 颜璐. 新疆农地利用碳排放时空差异及驱动机理研究[J]. 干旱区地理, 2013, 36(6): 1162-1169.
[
|
| [13] |
苏洋, 马惠兰, 李凤. 新疆农牧业碳排放及其与农业经济增长的脱钩关系研究[J]. 干旱区地理, 2014, 37(5): 1047-1054.
[
|
| [14] |
冉锦成, 苏洋, 胡金凤, 等. 新疆农业碳排放时空特征、峰值预测及影响因素研究[J]. 中国农业资源与区划, 2017, 38(8): 16-24.
[
|
| [15] |
田云, 张俊飚, 尹朝静, 等. 中国农业碳排放分布动态与趋势演进——基于31个省(市、区)2002—2011年的面板数据分析[J]. 中国人口·资源与环境, 2014, 24(7): 91-98.
[
|
| [16] |
冉锦成, 马惠兰, 苏洋. 西北五省农业碳排放测算及碳减排潜力研究[J]. 江西农业大学学报, 2017, 39(3): 623-632.
[
|
| [17] |
|
| [18] |
|
| [19] |
|
| [20] |
张晓华, 张元敏, 焦马倩, 等. 耕地净碳汇时空差异分析[J]. 安徽农学通报, 2023, 29(22): 99-104.
[
|
| [21] |
李波, 张俊飚. 我国农作物碳汇的阶段特征与空间差异研究[J]. 湖北农业科学, 2013, 52(5): 1229-1233.
[
|
| [22] |
马嘉艺. 耕地利用碳效应的时空动态、驱动因素及减排潜力研究[D]. 杭州: 浙江大学, 2023.
[
|
| [23] |
吴昊玥, 孟越, 黄瀚蛟, 等. 中国耕地利用净碳汇与农业生产的时空耦合特征[J]. 水土保持学报, 2022, 36(5): 360-376.
[
|
| [24] |
|
| [25] |
|
| [26] |
段华平, 张悦, 赵建波, 等. 中国农田生态系统的碳足迹分析[J]. 水土保持学报, 2011, 25(5): 203-208.
[
|
| [27] |
伍芬琳, 李琳, 张海林, 等. 保护性耕作对农田生态系统净碳释放量的影响[J]. 生态学杂志, 2007, 26(12): 2035-2039.
[
|
| [28] |
|
| [29] |
|
| [30] |
李德仁, 余涵若, 李熙. 基于夜光遥感影像的“一带一路”沿线国家城市发展时空格局分析[J]. 武汉大学学报(信息科学版), 2017, 42(6): 711-720.
[
|
| [31] |
宋钰, 张全景, 翟腾腾, 等. 1980—2020年黄河流域生态用地时空格局及演变特征研究[J]. 资源开发与市场, 2024, 40(8): 1128-1139.
[
|
| [32] |
|
| [33] |
|
| [34] |
|
| [35] |
郭霞. 农用地生态价值估价方法研究[J]. 国土资源情报, 2006(3): 20-23, 34.
[
|
| [36] |
|
| [37] |
尹飞虎, 高志建, 谢宗铭, 等. 不同碳氮施肥组合对新疆滴灌棉田冠层CO2浓度、光合作用和产量的影响[J]. 干旱区研究, 2011, 28(4): 724-728.
[
|
| [38] |
|
| [39] |
苏浩, 李佳珂, 刘坤, 等. 山东省耕地利用净碳汇变化与耕地利用效益关系研究[J]. 地理科学, 2024, 44(5): 864-873.
[
|
| [40] |
李祥. 新疆耕地利用转型及驱动机制[D]. 石河子: 石河子大学, 2023.
[
|
| [41] |
|
/
| 〈 |
|
〉 |