
梨园河流域景观格局对地表水质的影响
|
王昱(1979-),男,教授,博士,主要从事河流水生态与水环境研究. E-mail: wangyu-mike@163.com |
收稿日期: 2024-08-07
修回日期: 2024-09-11
网络出版日期: 2025-08-13
基金资助
国家自然科学基金项目(52169015)
甘肃省重点研发计划(23YFFA0020)
甘肃省2023年水利科研与技术推广项目(23GSLK032)
Impacts of landscape patterns on surface water quality in the Liyuan River Basin
Received date: 2024-08-07
Revised date: 2024-09-11
Online published: 2025-08-13
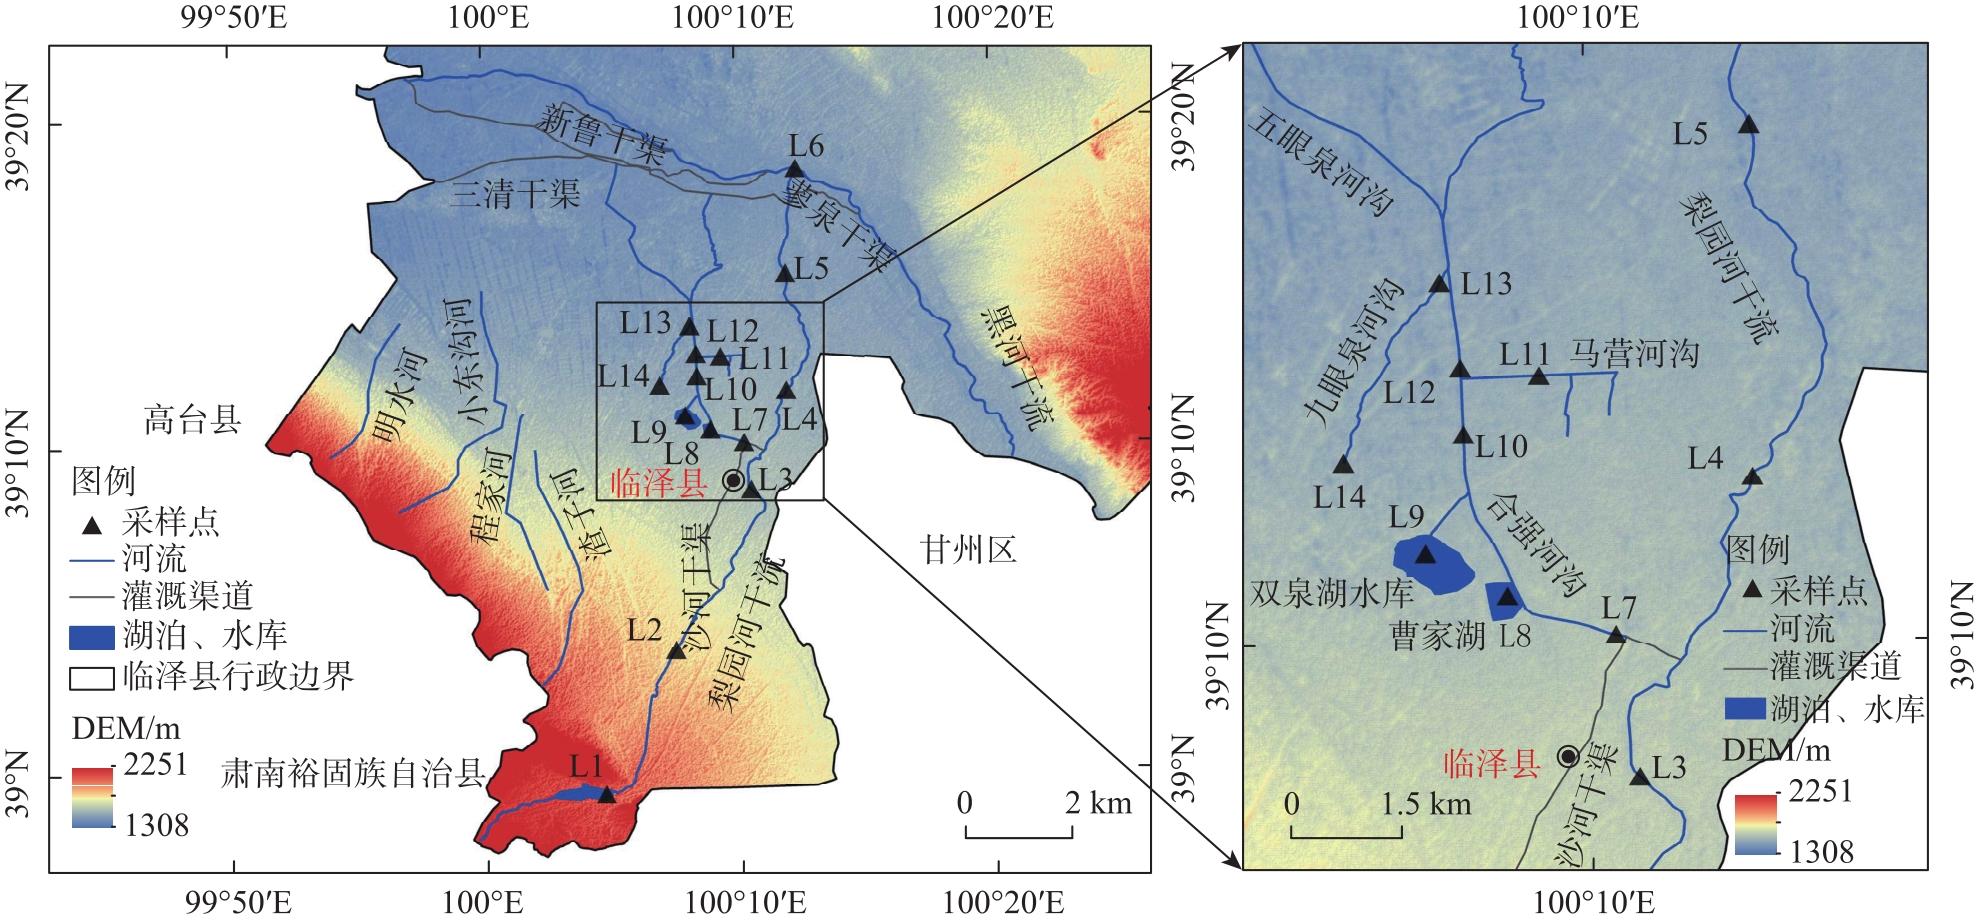
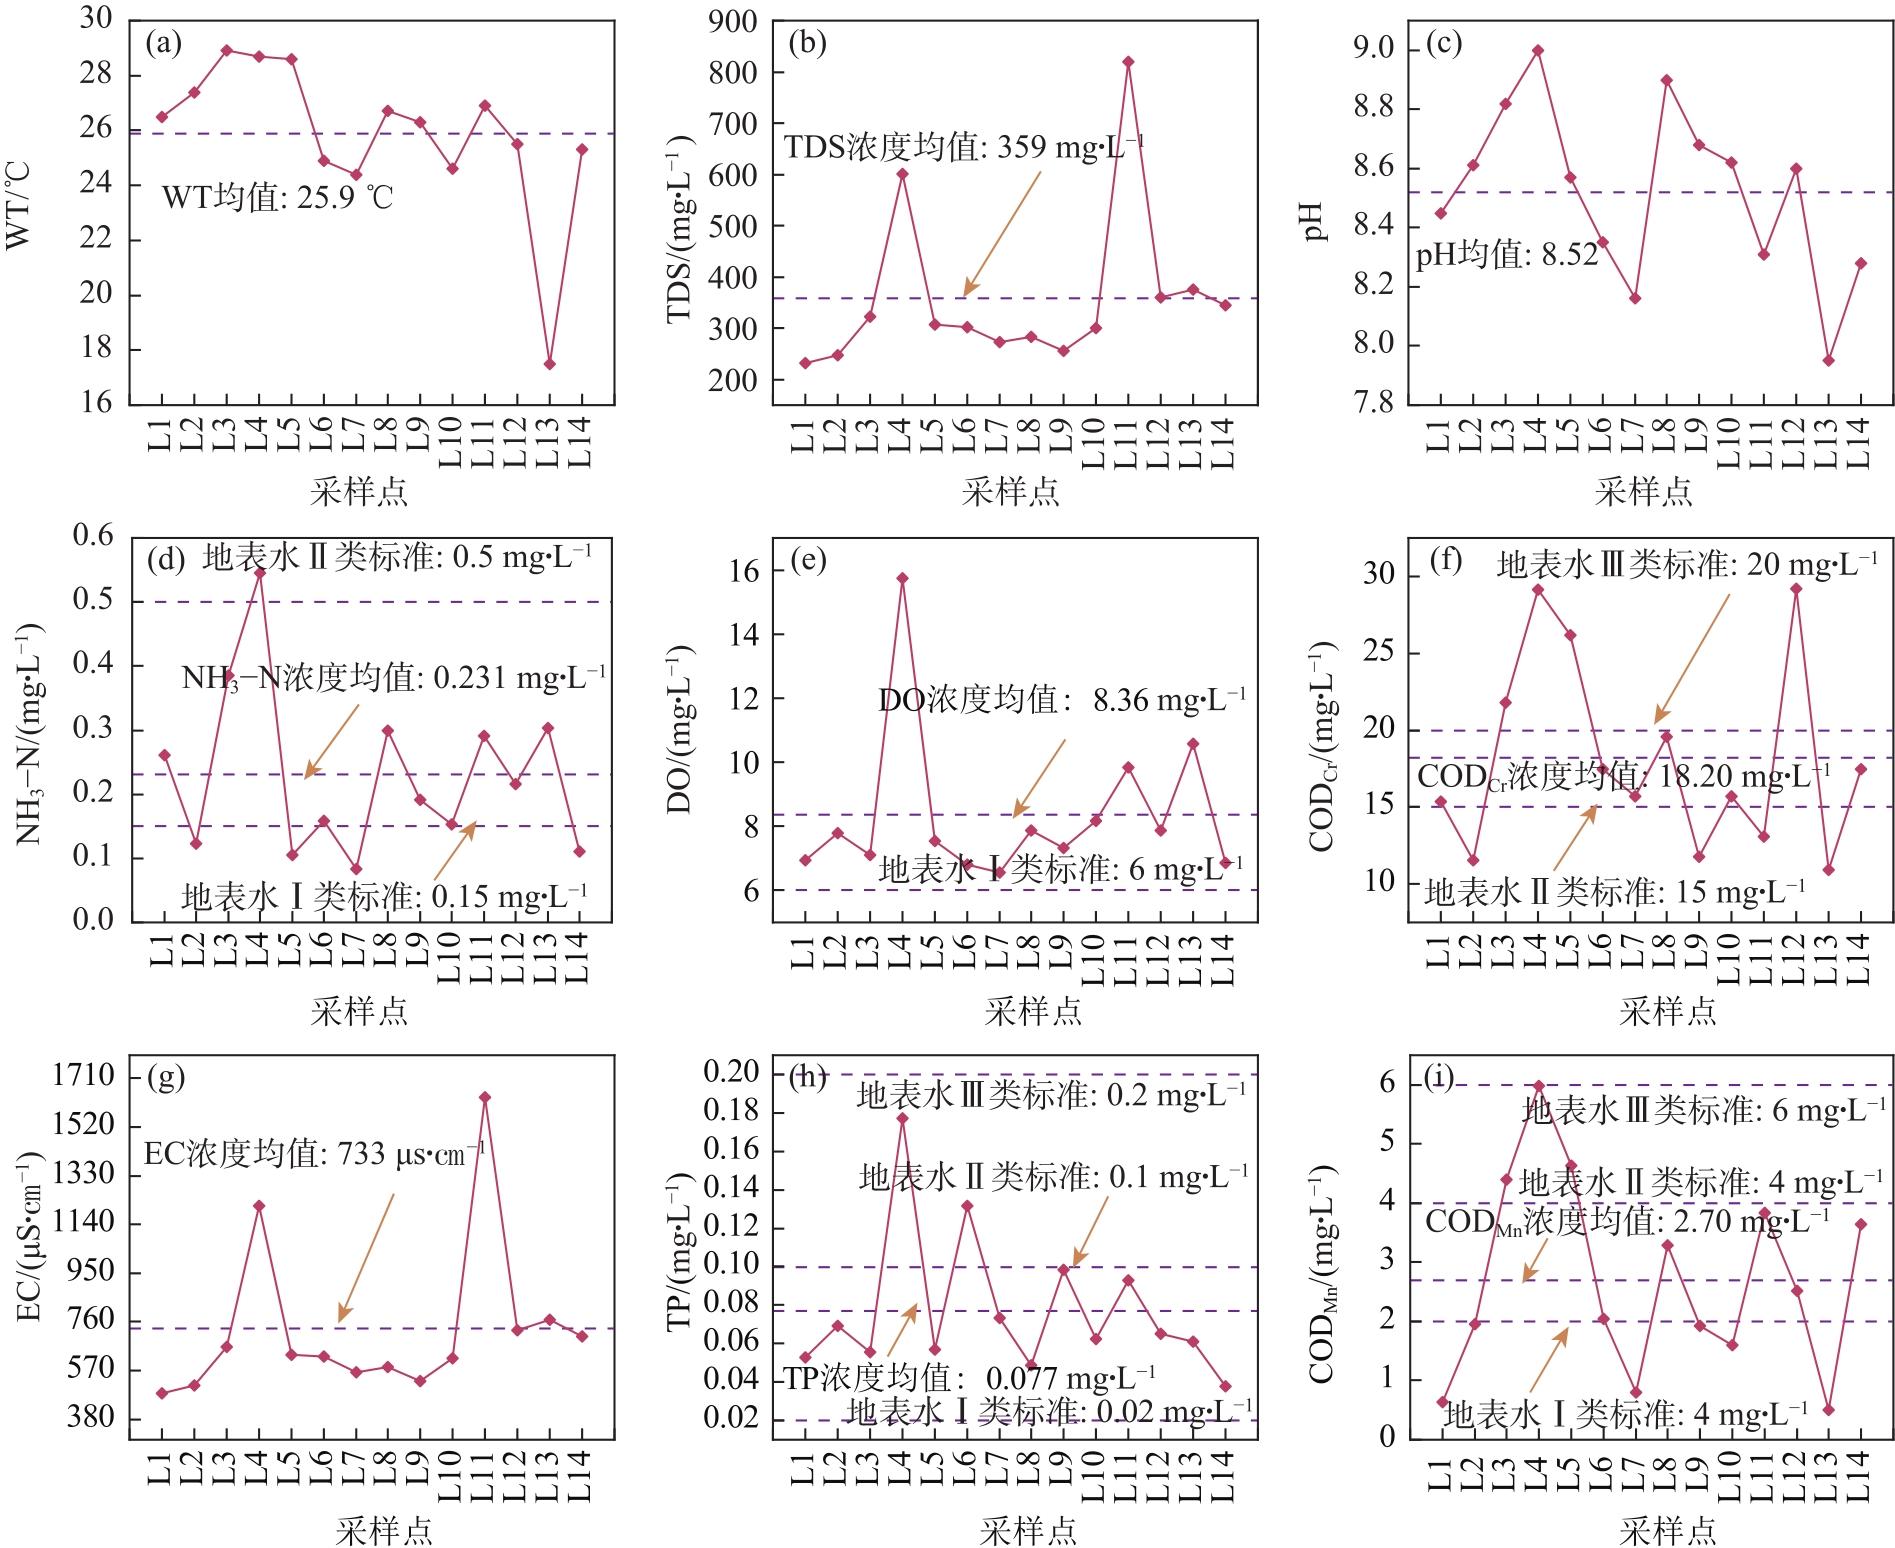
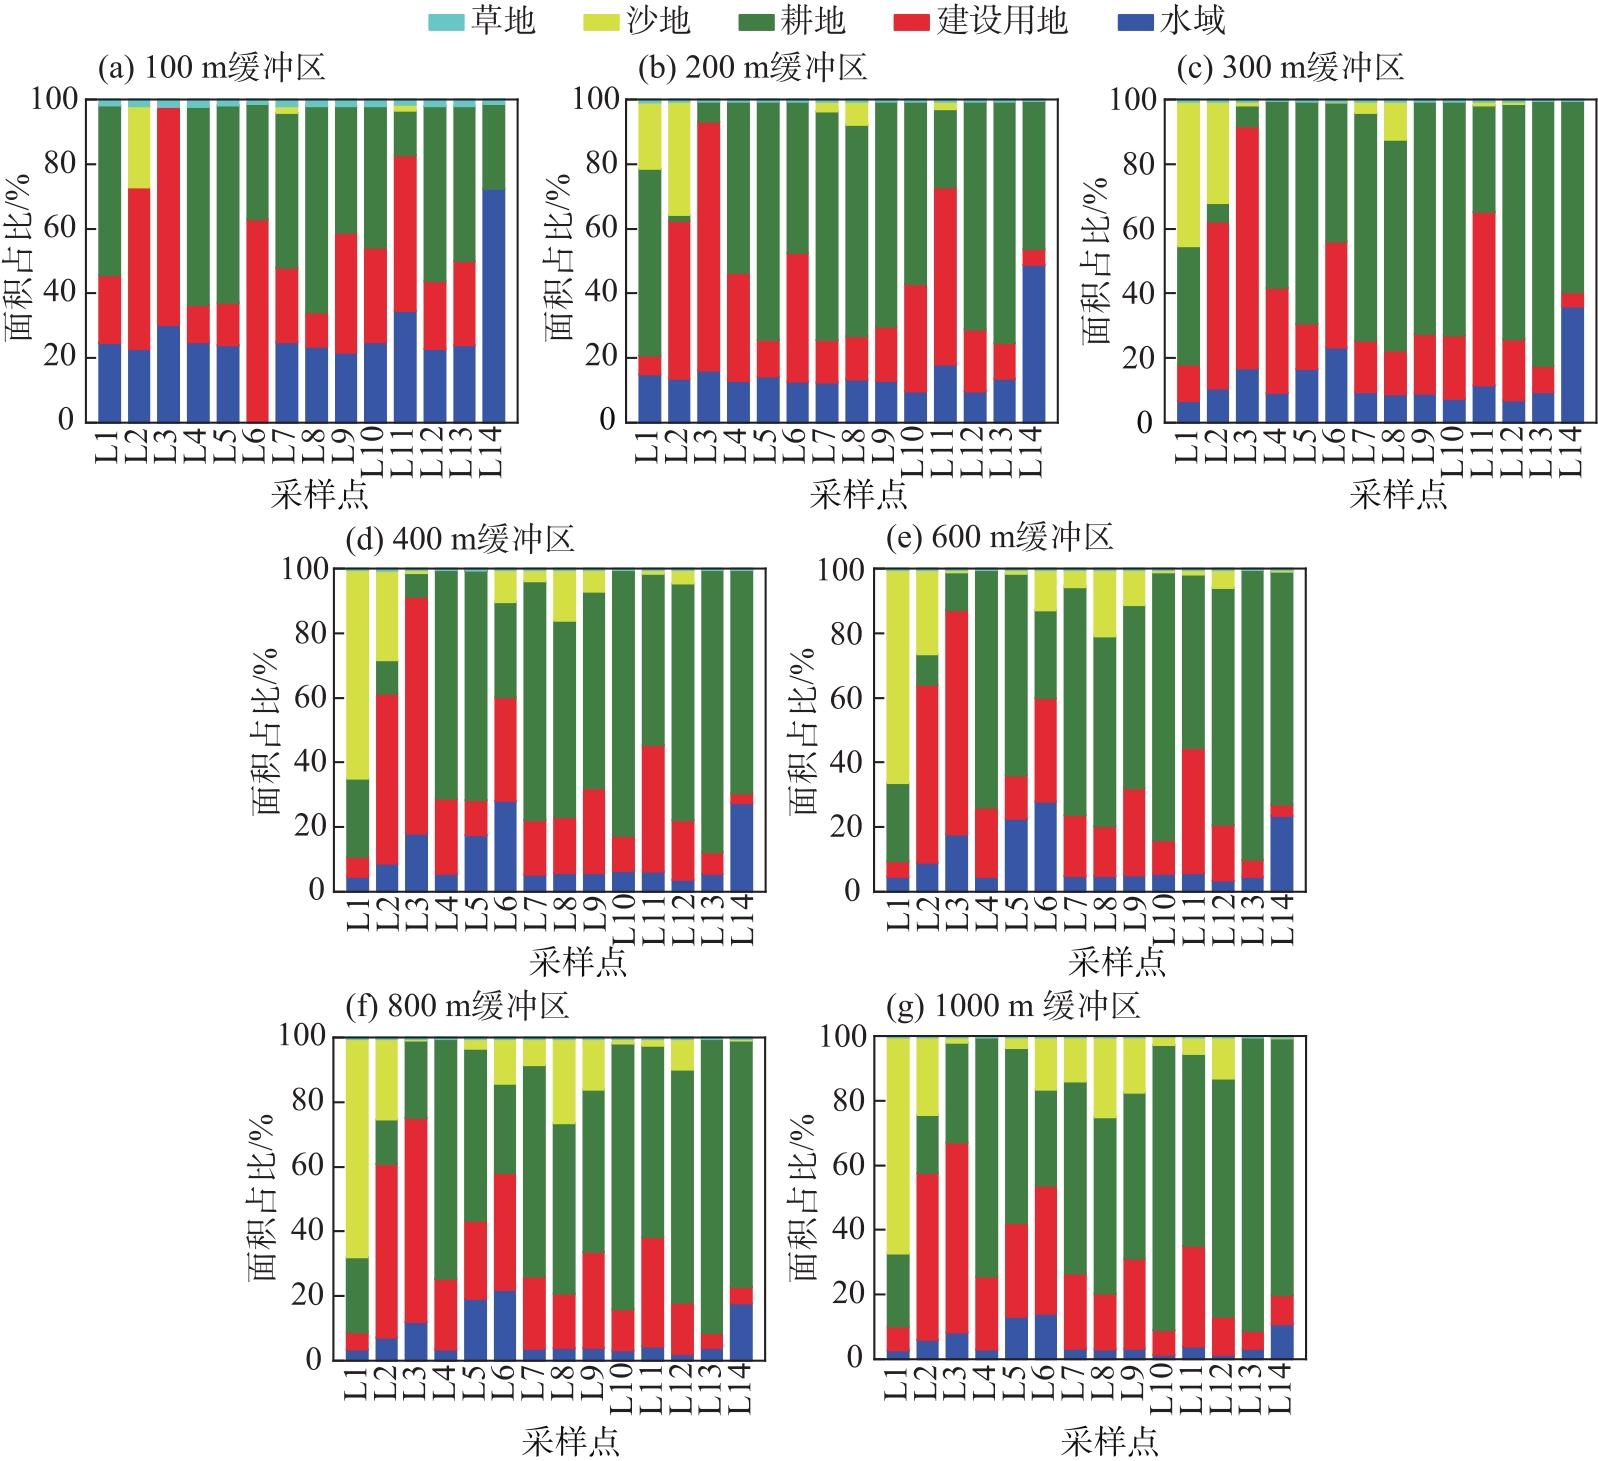
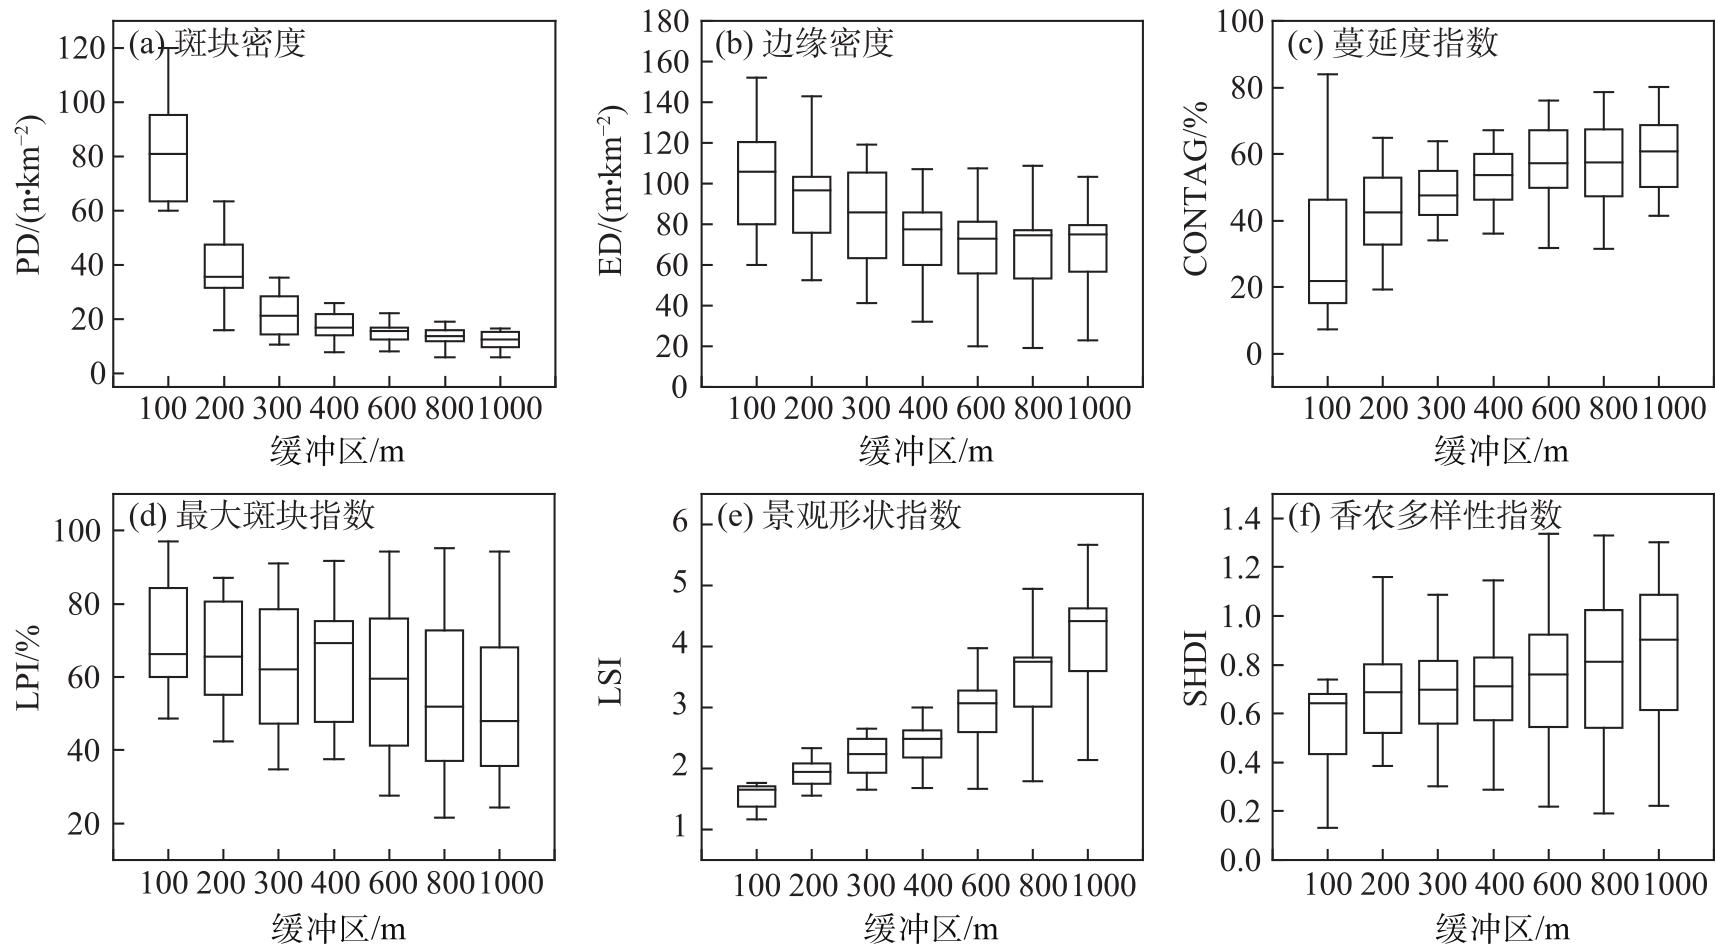
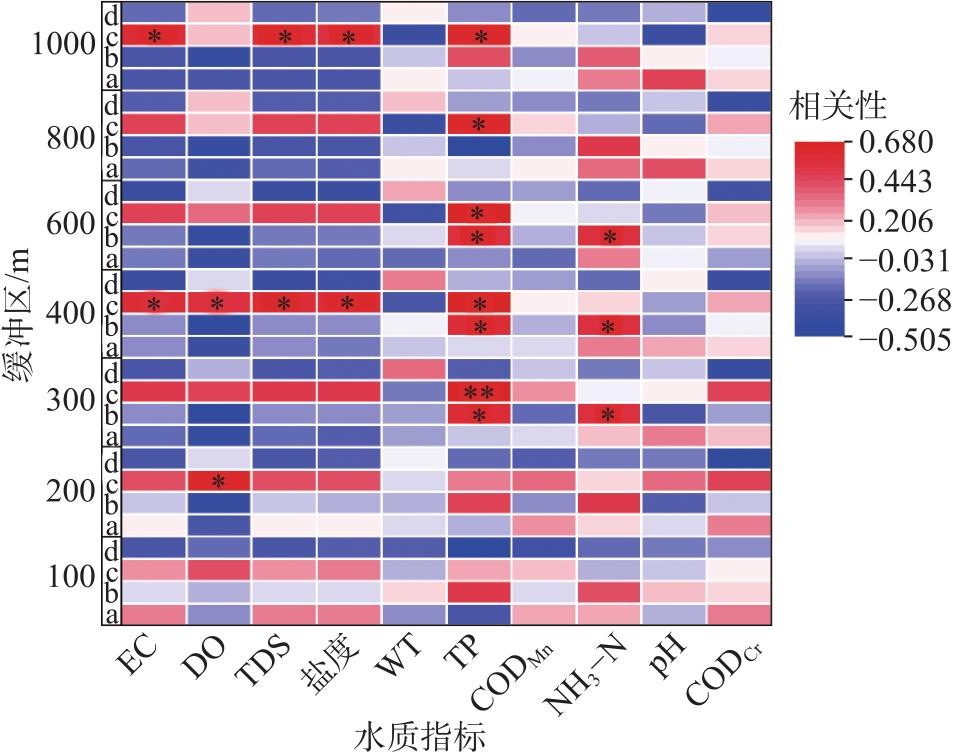
研究景观格局对内陆河水质的影响程度和机制对于干旱区内陆河流域水环境保护具有重要意义。本文以临泽县梨园河为研究对象,基于景观格局数据及实测水质数据,采用冗余分析和相关性分析探究了不同缓冲区下景观格局与水质之间的关系。结果显示:研究区水体总体符合Ⅱ类水质标准,除化学需氧量(CODCr)浓度均值处于Ⅲ类水质标准,溶解氧(DO)、总磷(TP)、高锰酸盐指数(CODMn)和氨氮(NH3-N)浓度均值满足Ⅱ类水质标准;缓冲区景观组成均以耕地为主,建设用地次之;对景观指数进行分析发现人类活动在缓冲区内强弱不均,100 m缓冲区内人类干扰程度最大。耕地面积占比与DO、TP、电导率(EC)、溶解性固体(TDS)、TP和盐度呈显著正相关,建设用地与TP和NH3-N呈显著正相关,最大斑块指数(LPI)、蔓延度指数(CONTAG)与水质指标呈正相关,斑块密度(PD)、边缘密度(ED)、景观形状指数(LSI)、香农多样性指数(SHDI)与水质指标呈负相关;冗余分析显示景观构成和景观指数对水质指标变化的解释率均在300 m缓冲区内最高,确定了300 m缓冲区是景观格局对水质指标影响的最佳缓冲区尺度。因此,通过优化300 m缓冲区内景观结构可提升景观对污染物的截留吸附能力,达到改善梨园河流域水质效果。
王昱 , 李能安 , 雒天峰 , 张英 , 袁兴鹏 , 田苗 , 信雅玲 , 胡飞燕 . 梨园河流域景观格局对地表水质的影响[J]. 干旱区研究, 2024 , 41(11) : 1831 -1841 . DOI: 10.13866/j.azr.2024.11.04
Studying the degree and mechanism of landscape pattern’s influence on inland river water quality is of great significance for the water environment protection of inland river basins in arid areas. This study was based on the Liyuan River in Linze County. We studied landscape pattern data and measured water quality, using redundancy and correlation analyses to investigate the relationship between landscape patterns and water quality in different buffer zones. The water bodies in the study area generally met the Class II water quality standard, except for the average value of the chemical oxygen demand (CODCr) concentration, which fell into Class III. Additionally, the average dissolved oxygen (DO), total phosphorus (TP), permanganate index (CODMn), and ammonia nitrogen (NH3-N) concentration values met the Class II water quality standard. The buffer zone’s landscape composition was dominated by arable land, and construction land was the second largest type. Analyzing the landscape index revealed that the strength of human activities was not evenly distributed in the buffer zone, and the degree of human interference was the greatest in the 100 m buffer zone. The human interference degree in the 100 m buffer zone was the greatest. The proportion of cultivated land was significantly and positively correlated with DO, TP, electrical conductivity (EC), dissolved solids (TDS), and salinity, while constructed land was significantly and positively correlated with TP and NH3-N. The largest patch index (LPI) and contagion index (CONTAG) were positively correlated with the water quality indicators, whereas patch density (PD), edge density (ED), landscape shape index (LSI), and Shannon’s diversity index (SHDI) were negatively correlated. Redundancy analysis indicated that the explanatory rate of the changes in the water quality indicators by the composition of the landscape and landscape indices was the highest in the 300 m buffer zone. The analysis indicated that the explanatory rate of landscape composition and index on water quality index changes were the highest in the 300 m buffer zone, and the 300 m buffer zone was determined to be the optimal buffer scale for landscape pattern’s influence on the water quality index. Therefore, optimizing the landscape structure within the 300 m buffer zone to enhance the retention and adsorption capacity of pollutants can improve the water quality of the Liyuan River.
Key words: correlation analysis; landscape pattern; water quality; Liyuan River
表2 景观指数的生态含义Tab. 2 Ecological implications of landscape indices |
| 景观指数 | 生态含义 |
|---|---|
| 斑块密度(PD) | 单位面积上的斑块数,反映景观破碎 化程度 |
| 边缘密度(ED) | 反映单位面积上各斑块类型边界长 度或总边界长度 |
| 最大斑块指数(LPI) | 反映景观的优势类型,也可间接反映人类活动的干扰程度,LPI值越大,人 类干扰程度越高 |
| 景观形状指数(LSI) | LSI值越大,表示景观斑块不规则化程度越高,空间异质特征越高 |
| 蔓延度指数(CONTAG) | 反映景观不同斑块类型的团聚程度和延展趋势,表征景观类型的聚散性 程度 |
| 香农多样性指数(SHDI) | SHDI值越大,景观类型越丰富,空间异质特征越强 |
表3 不同缓冲区内景观指数与水质指标的相关关系Tab. 3 Correlation between landscape indices and water quality indicators in different buffer zones |
| 缓冲区/m | 景观指数 | EC | DO | TDS | 盐度 | CODMn | NH3-N | CODCr |
|---|---|---|---|---|---|---|---|---|
| 100 | PD | -0.144 | -0.522 | -0.144 | -0.159 | -0.024 | -0.605* | 0.311 |
| LPI | 0.055 | -0.080 | 0.055 | 0.063 | 0.265 | 0.138 | -0.023 | |
| ED | -0.201 | -0.318 | -0.201 | -0.204 | -0.099 | -0.523 | -0.013 | |
| LSI | -0.124 | -0.249 | -0.124 | -0.130 | -0.002 | -0.513 | -0.041 | |
| CONTAG | 0.178 | 0.077 | 0.178 | 0.194 | 0.177 | 0.135 | -0.013 | |
| SHDI | -0.059 | 0.118 | -0.059 | -0.052 | -0.374 | -0.196 | -0.114 | |
| 200 | PD | -0.377 | -0.561* | -0.377 | -0.381 | 0.013 | -0.359 | -0.292 |
| LPI | 0.424 | 0.543* | 0.424 | 0.452 | 0.526 | 0.352 | 0.564* | |
| ED | -0.495 | -0.712** | -0.495 | -0.509 | -0.155 | -0.700** | -0.326 | |
| LSI | -0.528 | -0.767** | -0.528 | -0.522 | -0.162 | -0.667** | -0.351 | |
| CONTAG | 0.257 | 0.341 | 0.257 | 0.278 | 0.533* | 0.429 | 0.322 | |
| SHDI | -0.451 | -0.568* | -0.451 | -0.463 | -0.347 | -0.476 | -0.643* | |
| 300 | PD | -0.446 | -0.634* | -0.446 | -0.449 | 0.053 | -0.502 | -0.030 |
| LPI | 0.711** | 0.659* | 0.711** | 0.724** | 0.294 | 0.366 | 0.668** | |
| ED | -0.801** | -0.723** | -0.801** | -0.805** | -0.290 | -0.700** | -0.321 | |
| LSI | -0.792** | -0.700** | -0.792** | -0.796** | -0.261 | -0.702** | -0.300 | |
| CONTAG | 0.563* | 0.139 | 0.563* | 0.569* | 0.666** | 0.266 | 0.606* | |
| SHDI | -0.648* | -0.438 | -0.648* | -0.650* | -0.293 | -0.455 | -0.730** | |
| 400 | PD | -0.275 | -0.475 | -0.275 | -0.286 | -0.007 | -0.355 | 0.019 |
| LPI | 0.604* | 0.664** | 0.604* | 0.623* | 0.193 | 0.292 | 0.380 | |
| ED | -0.626* | -0.620* | -0.626* | -0.634* | -0.216 | -0.660* | -0.311 | |
| LSI | -0.688** | -0.594* | -0.688** | -0.692** | -0.191 | -0.628* | -0.291 | |
| CONTAG | 0.538* | 0.042 | 0.538* | 0.542* | 0.353 | 0.183 | 0.520 | |
| SHDI | -0.486 | -0.284 | -0.486 | -0.489 | -0.180 | -0.431 | -0.404 |
注:EC为电导率,DO为溶解氧,TDS为溶解性固体,CODMn为高锰酸盐指数,NH3-N为氨氮,CODCr为化学需氧量,PD为斑块密度,LPI为最大斑块指数,ED为边缘密度,LSI为景观形状指数,CONTAG为蔓延度指数,SHDI为香农多样性指数;*表示显著性水平P<0.05,**表示显著性水平P<0.01。 |
表4 不同缓冲区下景观构成和景观指数对水质的解释率Tab. 4 Explanatory rates of landscape composition and landscape indices for water quality under different buffer zones |
| 景观格局 | 缓冲区/m | 解释率% | ||
|---|---|---|---|---|
| 轴一 | 轴二 | 所有轴 | ||
| 景观构成 | 100 | 10.2 | 8.2 | 19.5 |
| 200 | 9.9 | 7.9 | 18.8 | |
| 300 | 14.4 | 5.7 | 26.7 | |
| 400 | 7.4 | 6.5 | 16.1 | |
| 600 | 8.1 | 6.6 | 17.1 | |
| 800 | 10.6 | 5.8 | 17.6 | |
| 1000 | 10.7 | 4.4 | 17.9 | |
| 景观指数 | 100 | 20.2 | 10.6 | 38.4 |
| 200 | 26.2 | 21 | 54.6 | |
| 300 | 41.1 | 11.7 | 60.9 | |
| 400 | 31.7 | 14.1 | 53.4 | |
| 600 | 32.4 | 10.1 | 47.7 | |
| 800 | 31.6 | 9.5 | 47.4 | |
| 1000 | 30.8 | 8.6 | 47.1 | |
表5 景观格局影响地表水质的特征尺度Tab. 5 Characteristic scales of landscape patterns affecting surface water quality |
| [1] |
|
| [2] |
|
| [3] |
|
| [4] |
|
| [5] |
吕志强, 庆旭瑶, 任玉芬, 等. 山地城市河流土地利用结构对水质的影响——以重庆市为例[J]. 湖泊科学, 2016, 28(2): 319-327.
[
|
| [6] |
|
| [7] |
|
| [8] |
|
| [9] |
米秋菊, 边玉明, 甄立鹏, 等. 土地利用结构与景观格局对黎河水质的影响[J]. 水生态学杂志, 2024, 45(3): 78-85.
[
|
| [10] |
胡琳, 李思悦. 不同空间尺度土地利用结构与景观格局对龙川江流域水质的影响[J]. 生态环境学报, 2021, 30(7): 1470-1481.
[
|
| [11] |
方娜, 刘玲玲, 游清徽, 等. 不同尺度土地利用方式对鄱阳湖湿地水质的影响[J]. 环境科学, 2019, 40(12): 5348-5357.
[
|
| [12] |
吕乐婷, 高晓琴, 刘琦, 等. 东江流域景观格局对氮、磷输出的影响[J]. 生态学报, 2021, 41(5): 1758-1765.
[
|
| [13] |
曹灿, 张飞, 阿依尼格尔·亚力坤, 等. 艾比湖区域景观格局与河流水质关系探讨[J]. 环境科学, 2018, 39(4): 1568-1577.
[
|
| [14] |
张微微, 李晓娜, 王超, 等. 密云水库上游白河地表水质对不同空间尺度景观格局特征的响应[J]. 环境科学, 2020, 41(11): 4895-4904.
[
|
| [15] |
|
| [16] |
谭娟, 熊丽君, 王卿, 等. 不同时空尺度下土地利用结构与空间格局对苏州河水质的影响[J]. 环境科学, 2024, 45(2): 768-779.
[
|
| [17] |
张清寰, 齐识, 马金珠. 甘肃梨园河流域地下水来源及其水化学特征[J]. 干旱区研究, 2012, 29(5): 898-906.
[
|
| [18] |
顾洋, 张平究, 秦风约, 等. 多时空景观格局对南淝河水质的影响[J]. 农业环境科学学报, 2024, 43(7): 1580-1589.
[
|
| [19] |
代孟均, 张兵, 杜倩倩, 等. 不同缓冲区的土地利用方式对地表水水质的影响: 以海河流域天津段为例[J]. 环境科学, 2024, 45(3): 1512-1524.
[
|
| [20] |
吕乐婷, 郑晓宇, 刘琦, 等. 非点源污染对景观格局响应的空间尺度效应——以东北太子河流域为例[J]. 应用生态学报, 2024, 35(4): 1112-1122.
[
|
| [21] |
项颂, 庞燕, 储昭升, 等. 入湖河流水质对土地利用时空格局的响应研究: 以洱海北部流域为例[J]. 环境科学, 2016, 37(8): 2947-2956.
[
|
| [22] |
王小平, 张飞, 李晓航, 等. 艾比湖区域景观格局空间特征与地表水质的关联分析[J]. 生态学报, 2017, 37(22): 7438-7452.
[
|
| [23] |
|
| [24] |
胡艳芳, 范中亚, 陈昭婷, 等. 汕头市练江流域景观格局与水质的关联分析[J]. 中国环境监测, 2021, 37(3): 126-133.
[
|
| [25] |
|
| [26] |
周俊菊, 向鹃, 王兰英, 等. 祁连山东部冰沟河流域景观格局与河流水化学特征关系[J]. 生态学杂志, 2019, 38(12): 3779-3788.
[
|
| [27] |
张旭达, 韩谞, 孙长顺, 等. 无定河及延河流域不同时空尺度下土地利用对水质的影响[J]. 环境科学, 2024, 45(8): 4540-4552.
[
|
| [28] |
乔郭亮, 周寅康, 顾铮鸣, 等. 苏南地区景观格局特征与坑塘水质关联关系[J]. 农业工程学报, 2021, 37(10): 224-234.
[
|
| [29] |
胡和兵, 刘红玉, 郝敬锋, 等. 南京市九乡河流域景观格局空间分异对河流水质的影响[J]. 环境科学, 2012, 33(3): 794-801.
[
|
| [30] |
|
| [31] |
徐明珠, 徐国策, 乔海亮, 等. 秦岭南麓小流域不同空间尺度景观格局对水质的影响分析[J]. 环境科学学报, 2023, 43(10): 396-406.
[
|
| [32] |
张鹏, 刘慧, 王为木, 等. 东南山丘区水库流域多空间尺度景观格局对水质的影响[J]. 水生态学杂志, 2023, 44(3): 17-25.
[
|
| [33] |
|
| [34] |
|
| [35] |
杨强强, 徐光来, 杨先成, 等. 青弋江流域土地利用/景观格局对水质的影响[J]. 生态学报, 2020, 40(24): 9048-9058.
[
|
/
| 〈 |
|
〉 |