
古浪县八步沙区域生态环境质量变化
|
魏倩(1999-),女,硕士研究生,主要从事荒漠生态研究. E-mail: wqsy256@163.com |
收稿日期: 2024-06-23
修回日期: 2025-04-16
网络出版日期: 2025-08-12
基金资助
国家自然科学基金项目(32160410)
中央财政林业科技推广示范项目(2021ZYTG002)
甘肃省防沙治沙科技创新项目(2023-ZS-01)
Change in the ecological environment quality in Babusha region in the Gulang County
Received date: 2024-06-23
Revised date: 2025-04-16
Online published: 2025-08-12
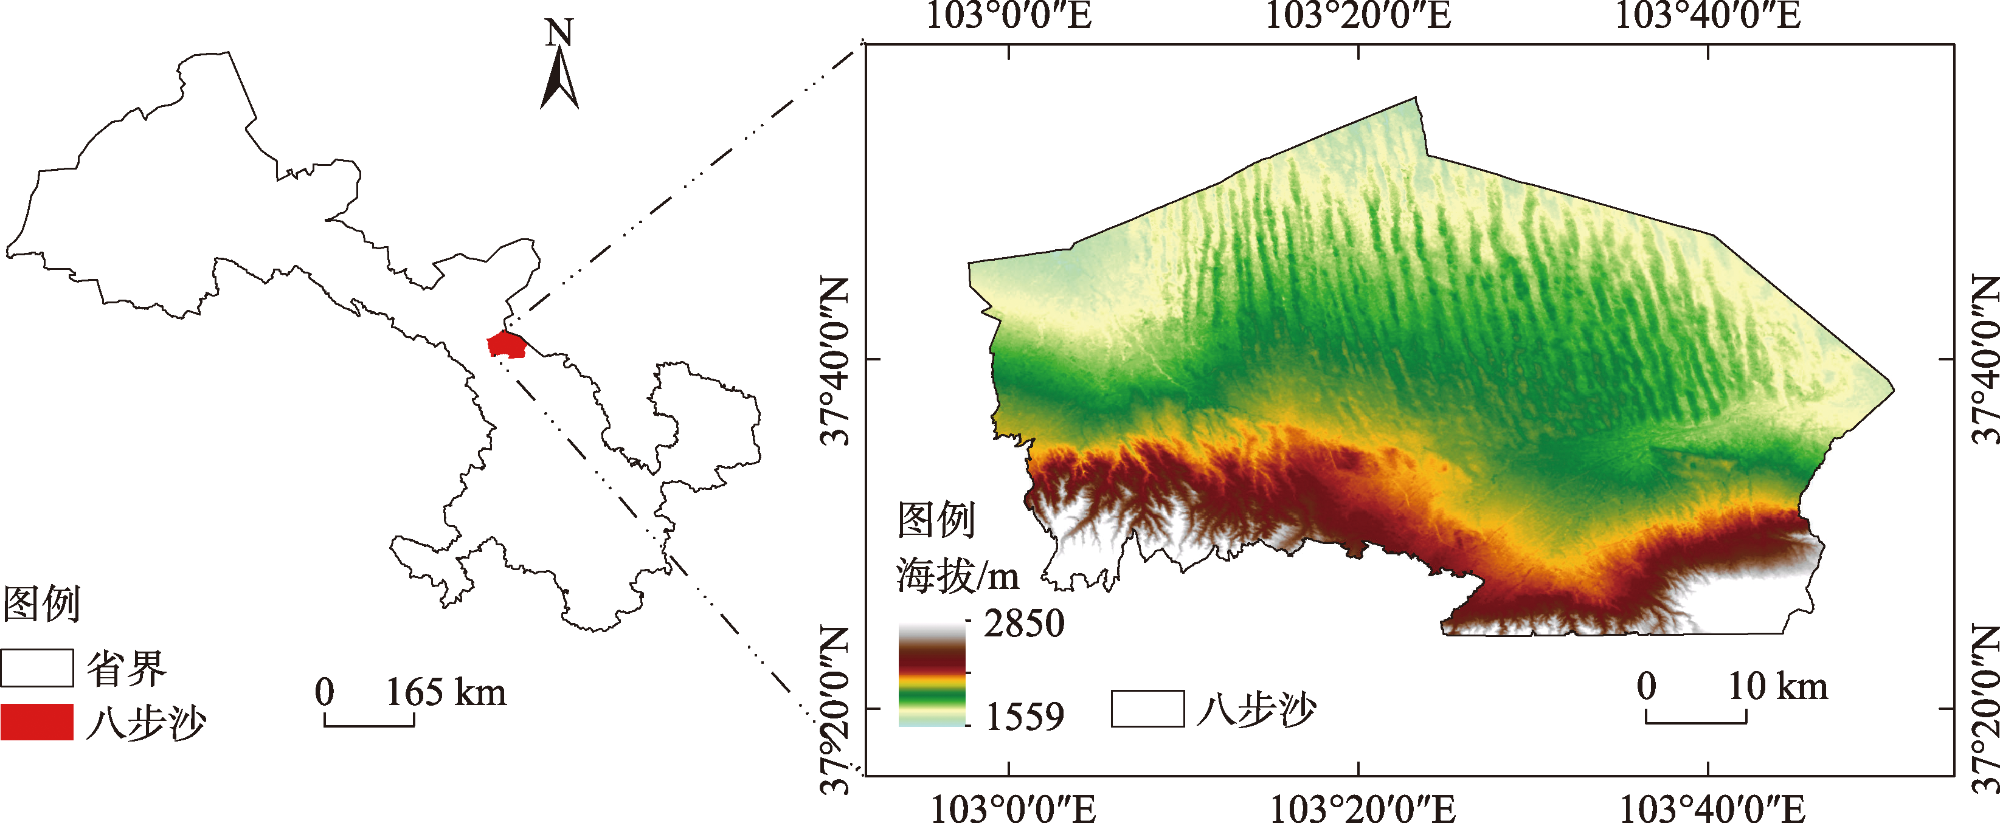
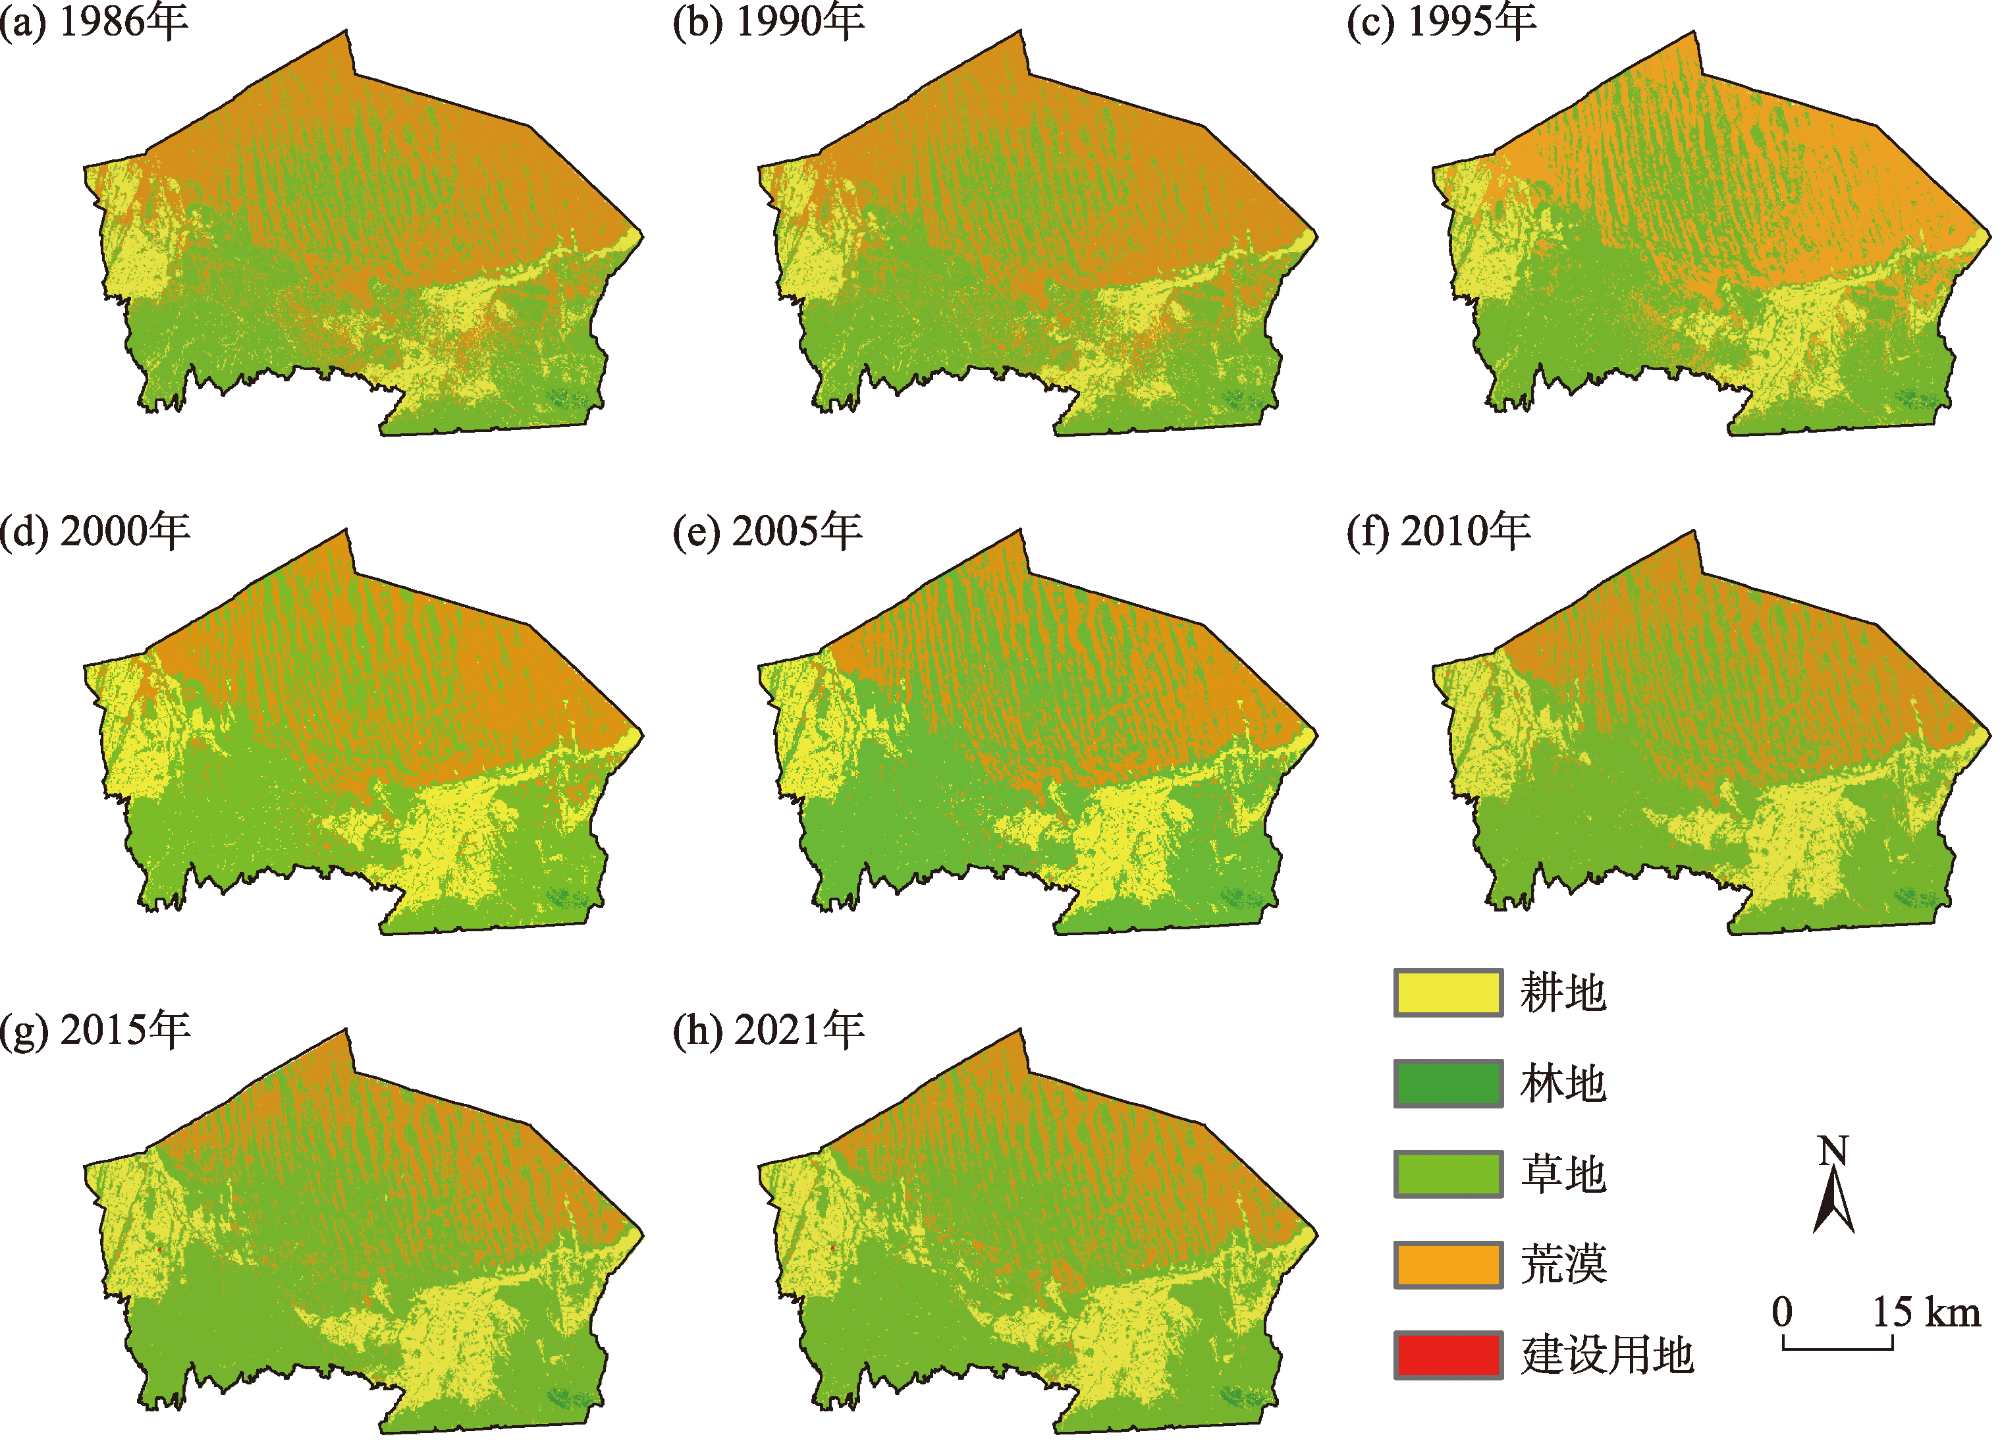
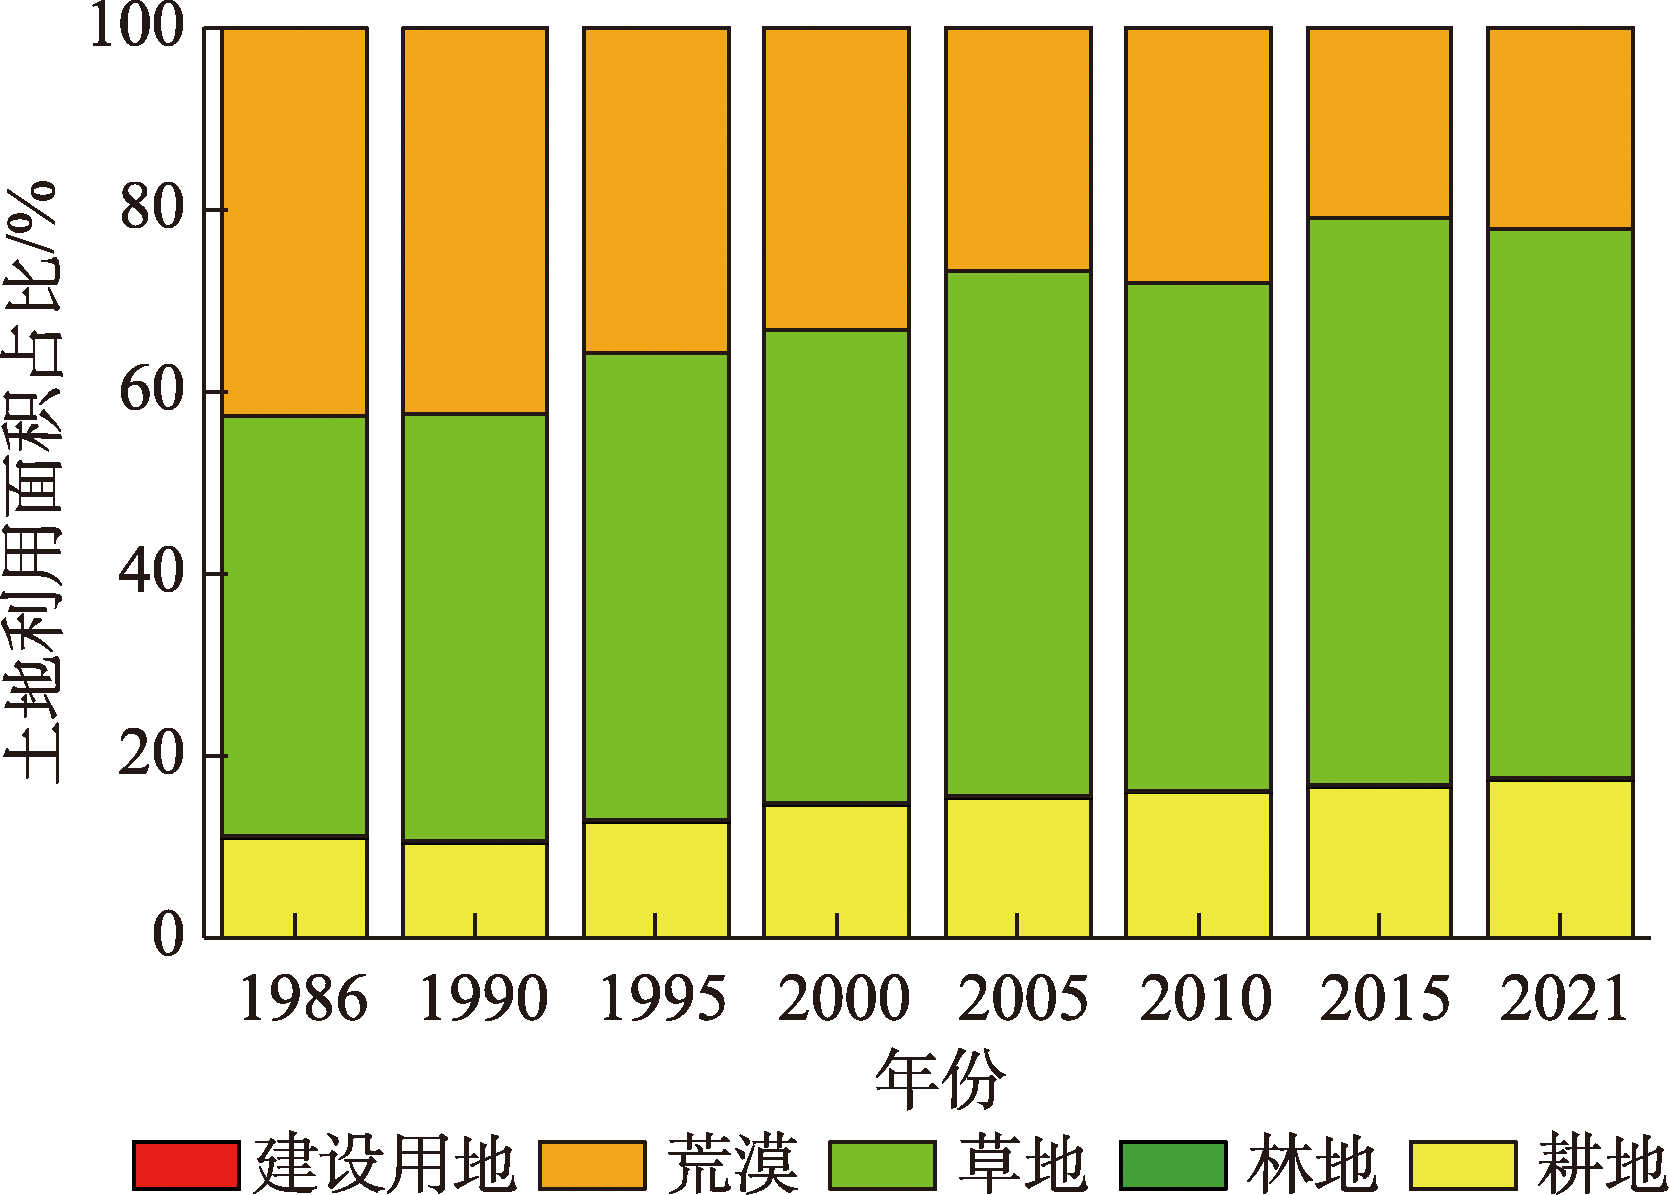
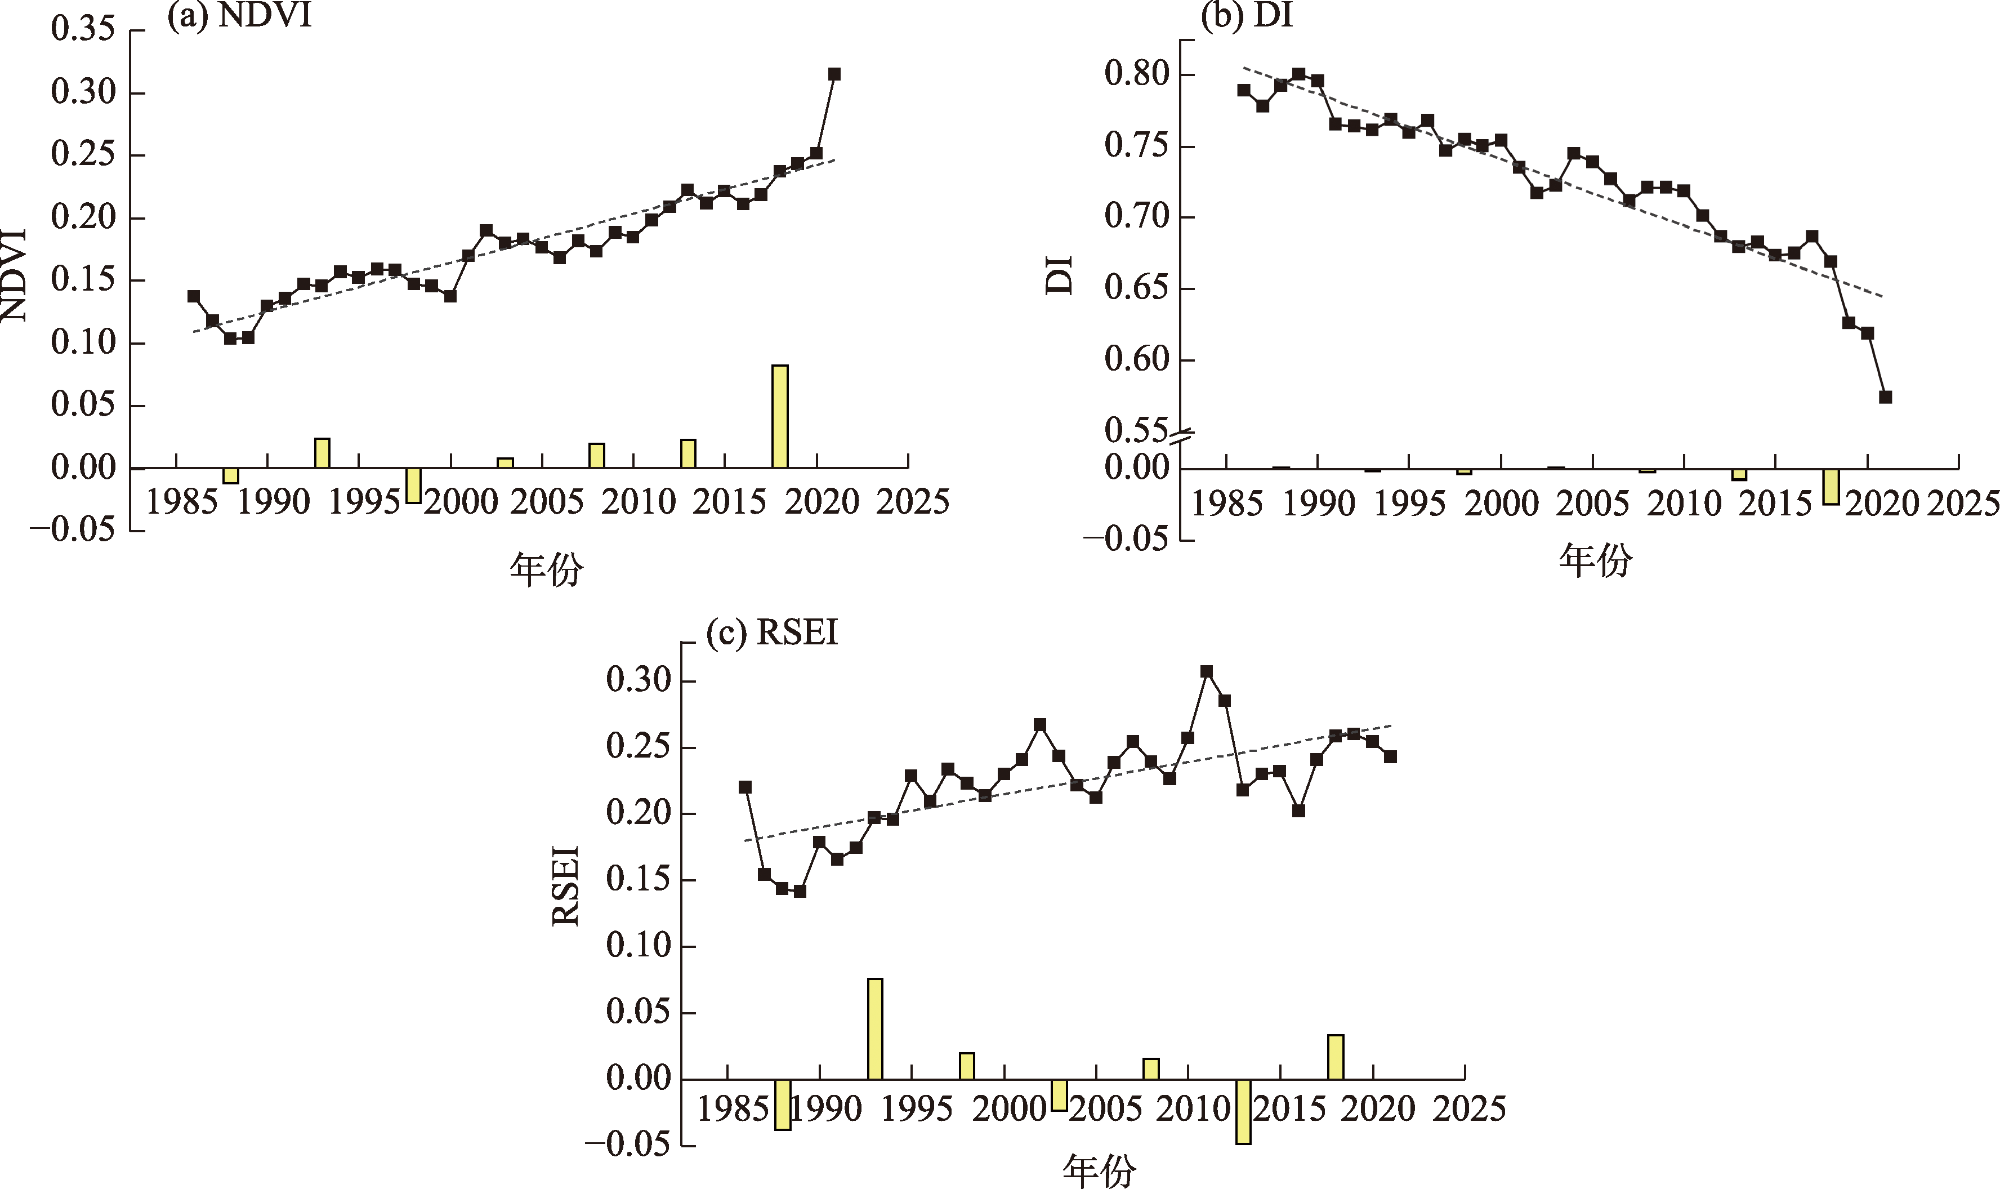
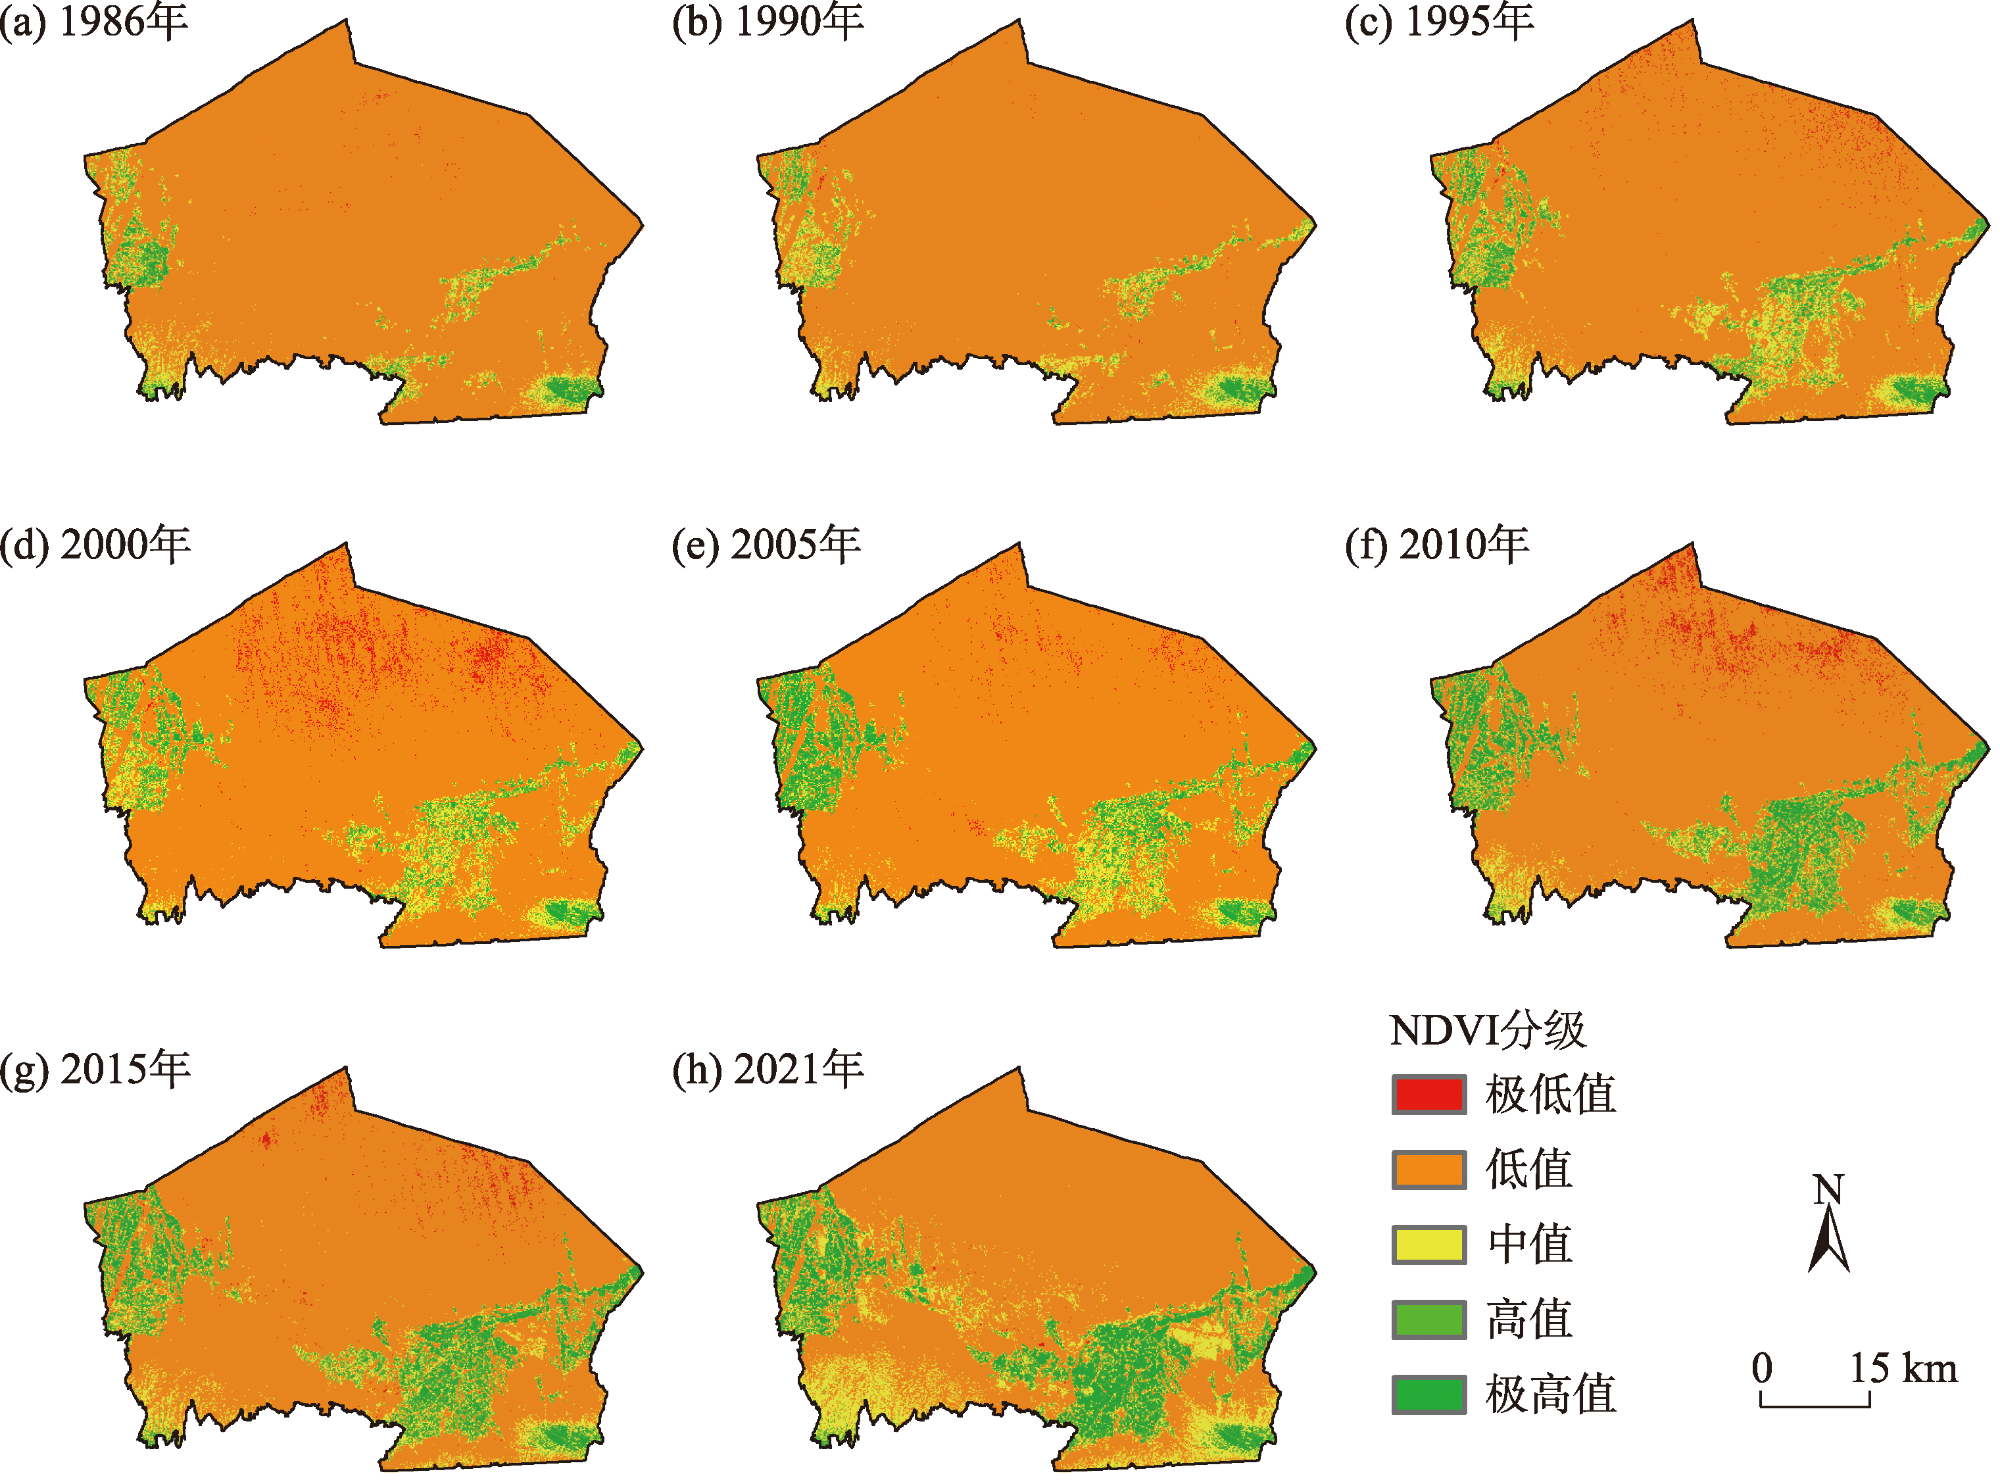
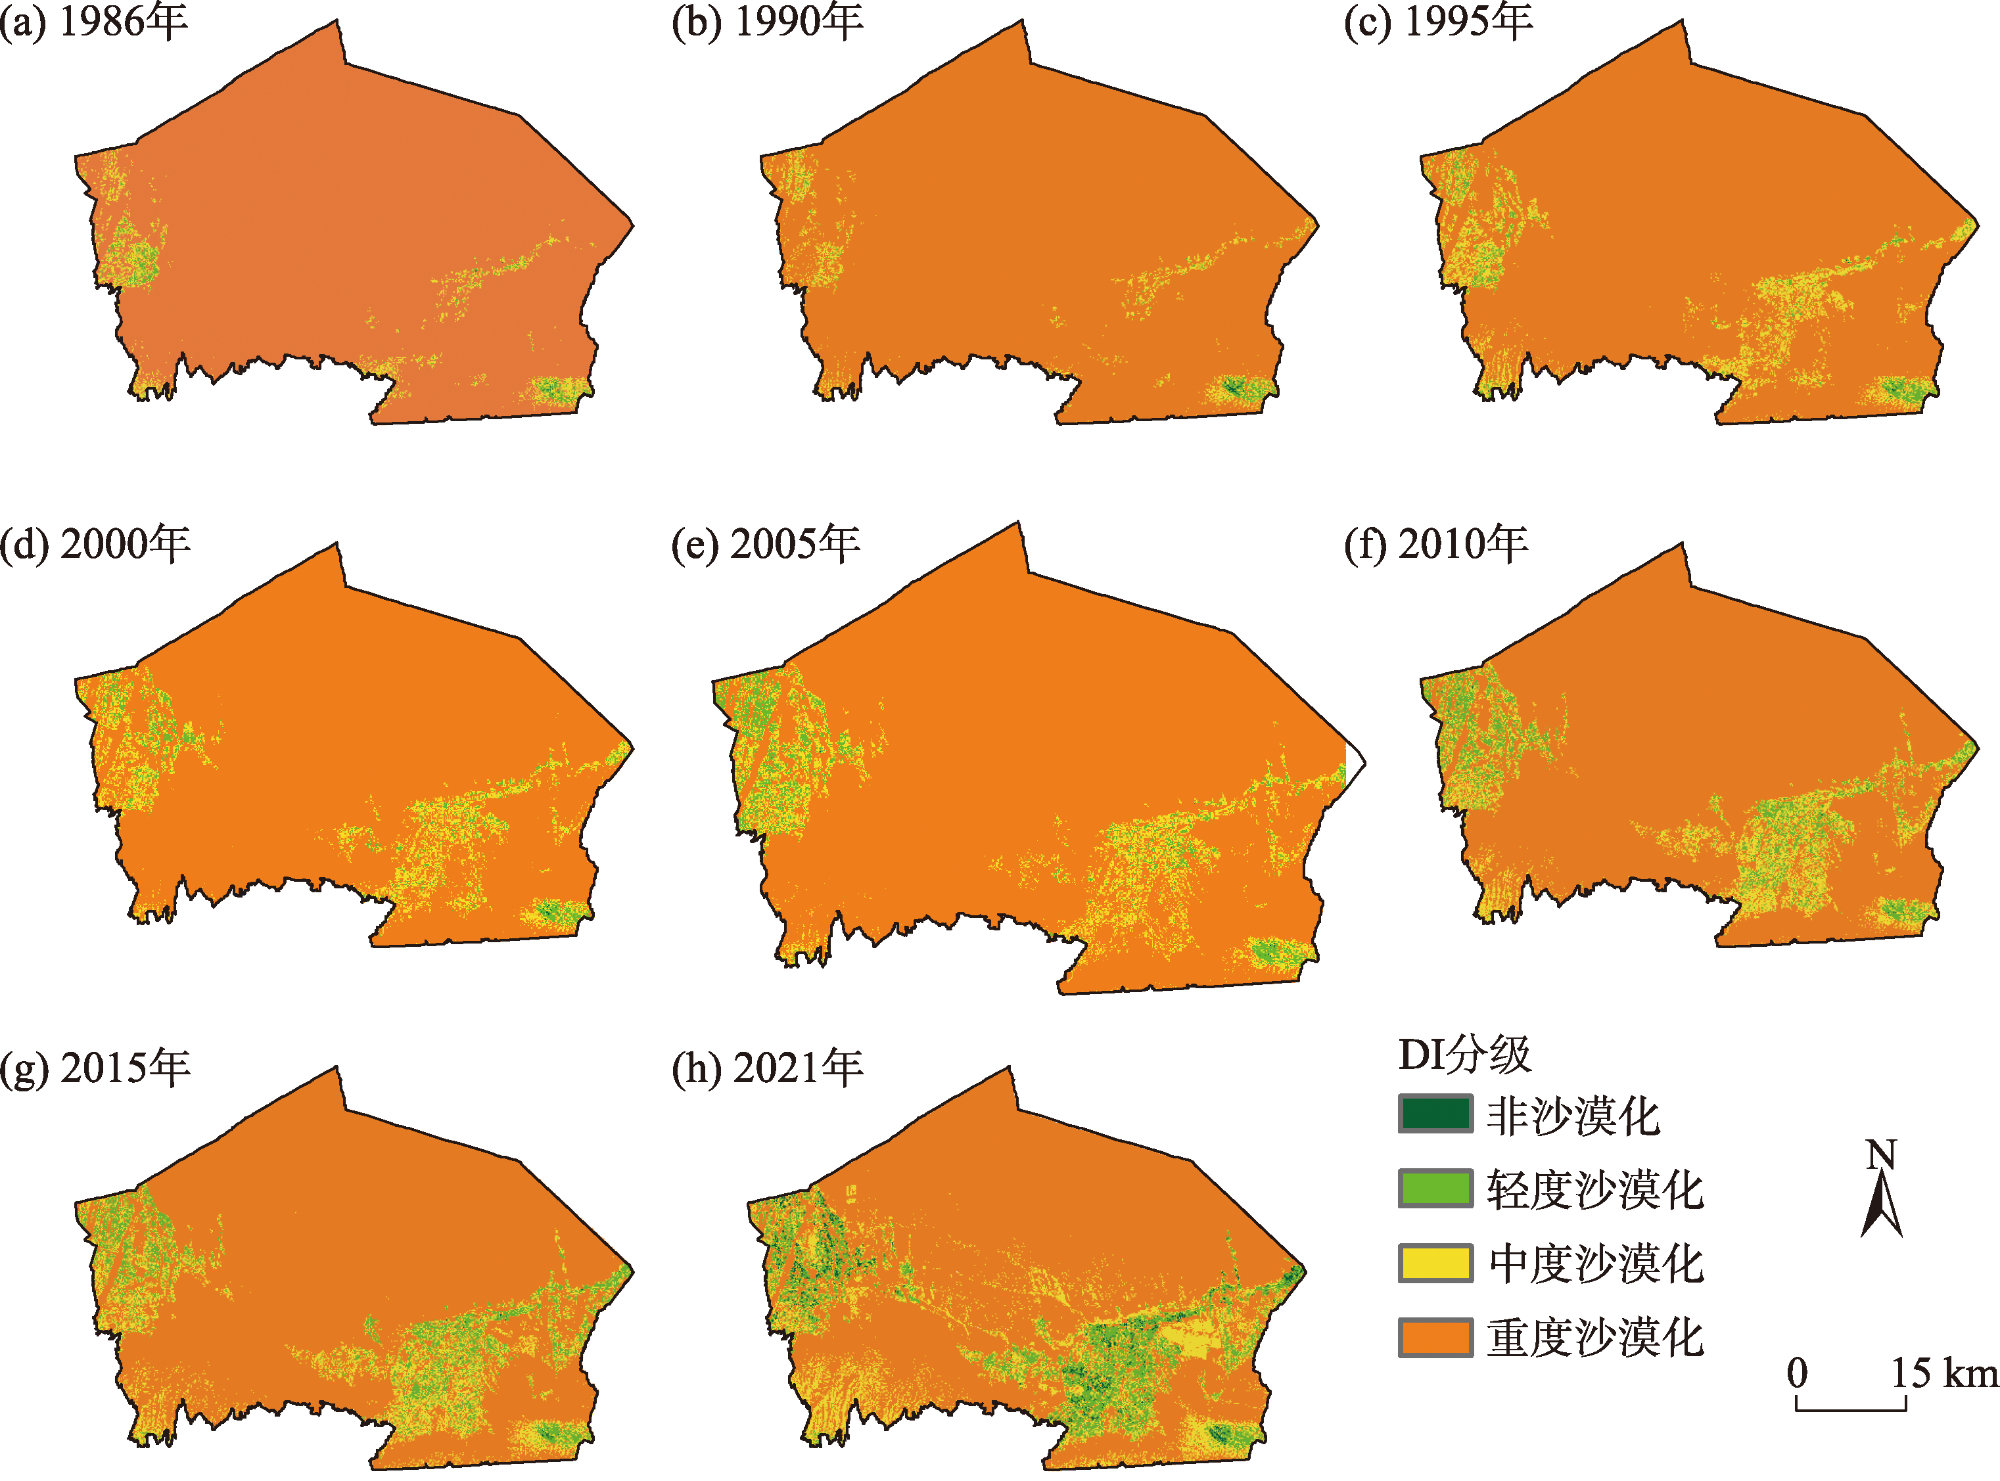
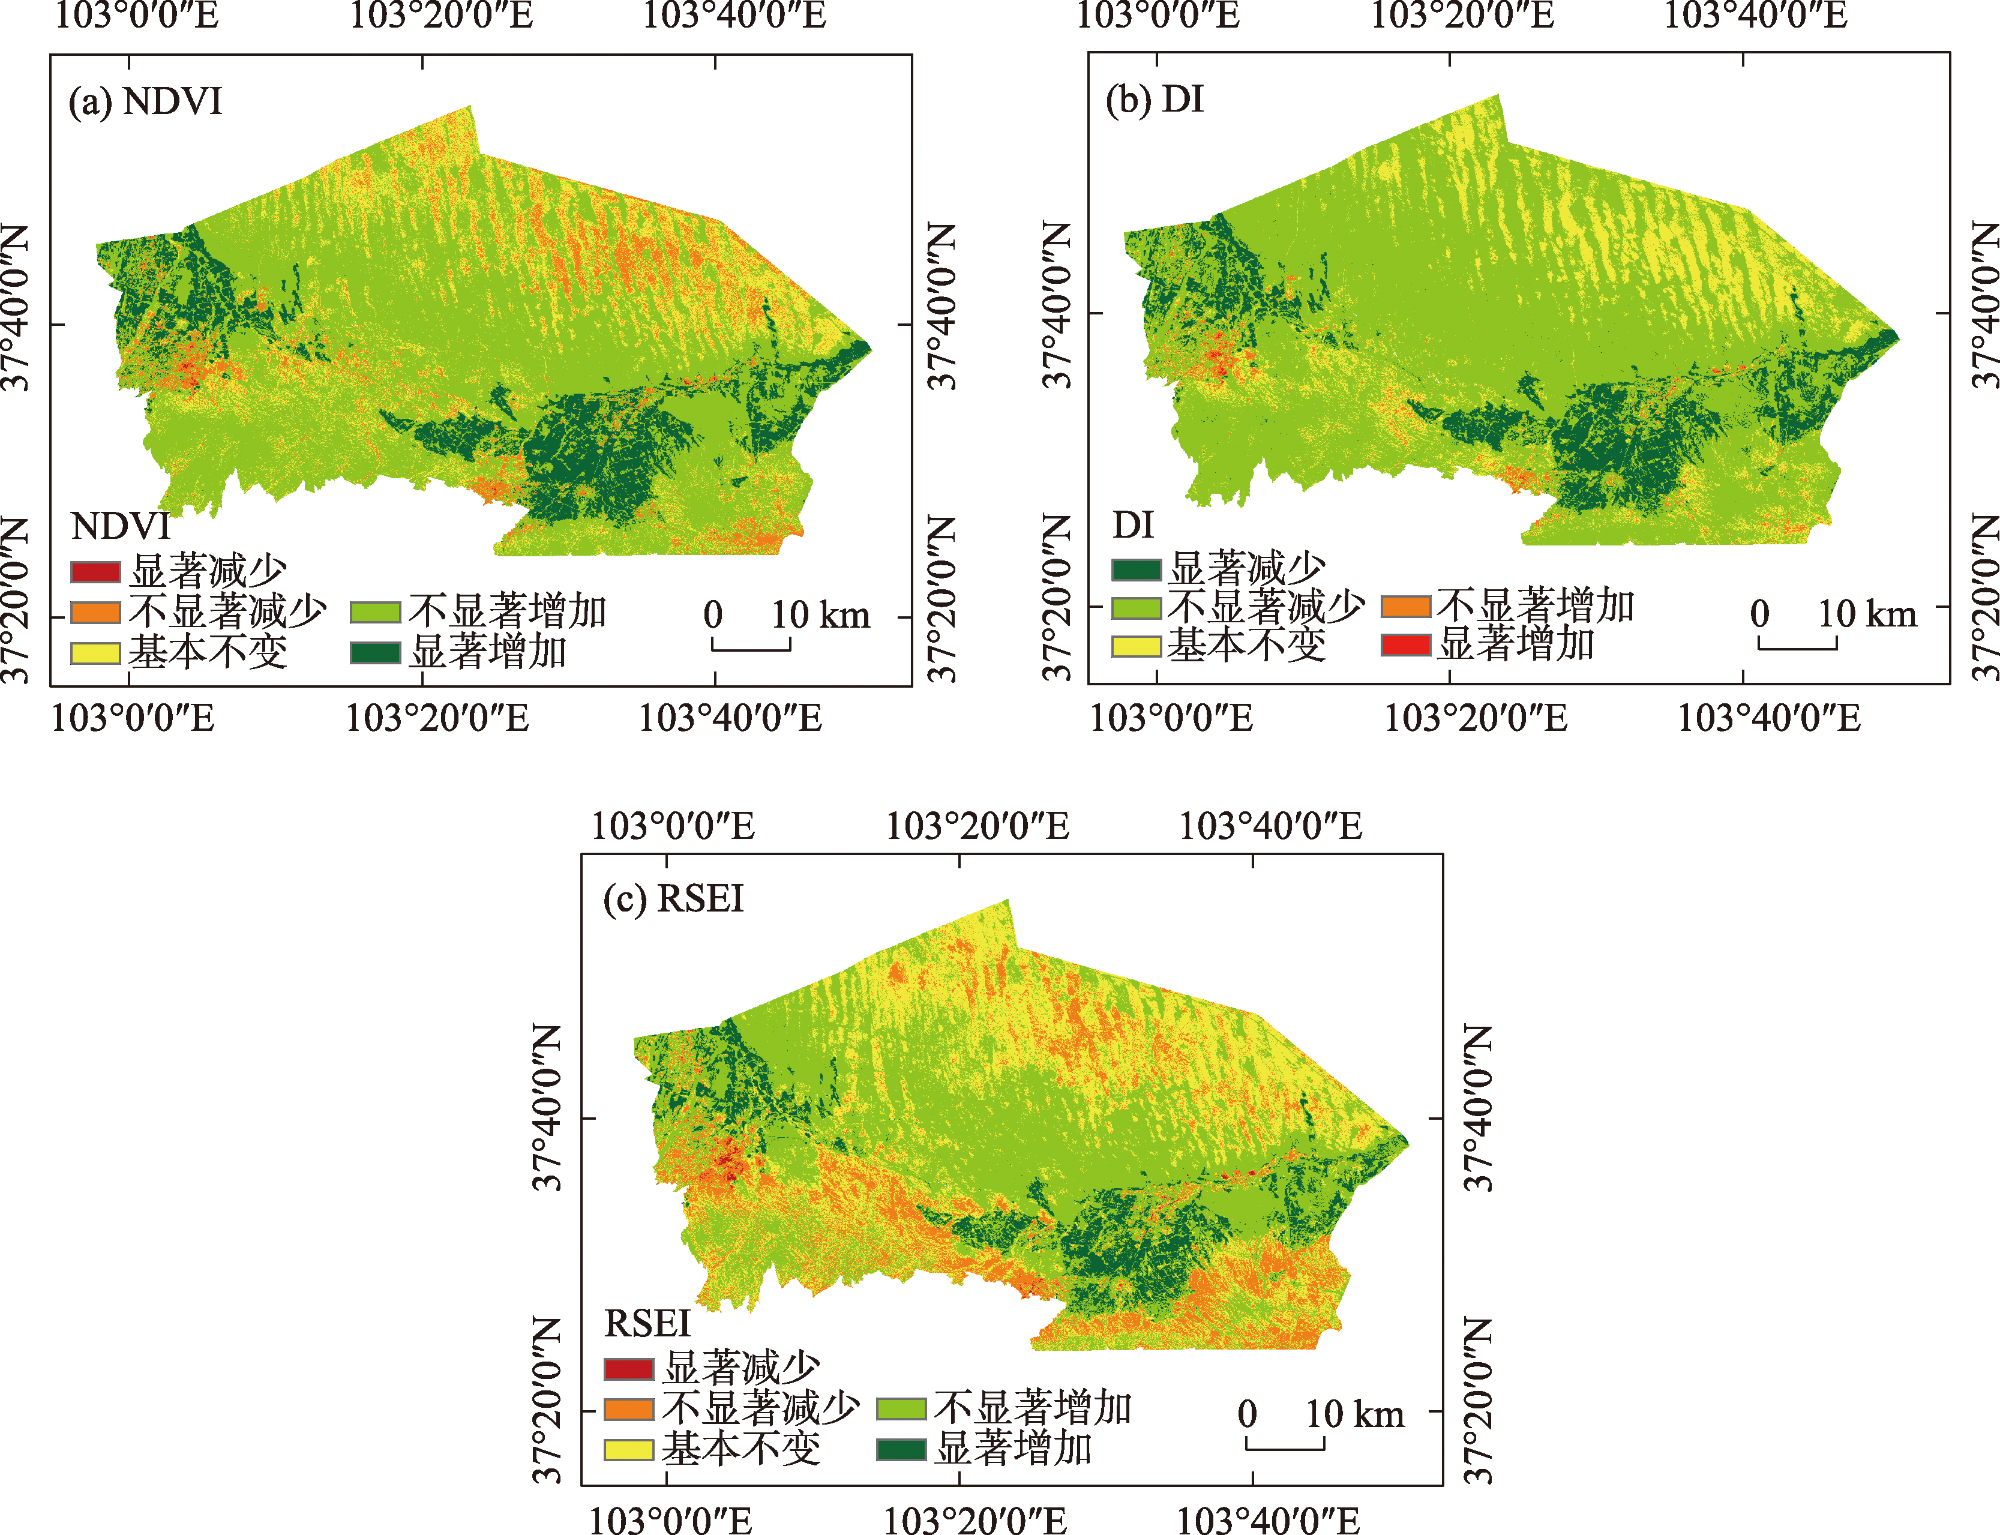
八步沙区域地处青藏高原生态屏障与北方防沙带的交汇地带,是抵御腾格里沙漠南侵的前沿阵地,评估其生态环境质量的变化对评价区域防沙治沙成效、推进“三北”工程攻坚战具有一定指导意义。本研究基于Google Earth Engine(GEE)平台数据,探讨1986—2021年八步沙区域土地利用格局变化趋势,利用归一化植被指数(NDVI)、沙漠化指数(DI)和遥感生态指数(RSEI)对区域生态环境质量的时空变化进行综合评估。 结果表明:(1) 在时间尺度上,八步沙区域荒漠面积持续减少、草地面积持续增加、植被覆盖度增加。1986—2021年NDVI和RSEI呈波动上升趋势,其中NDVI由0.14上升至0.31,增长幅度达1倍以上;RSEI由0.22上升至0.24,增幅为9.39%;DI呈波动下降趋势,由0.79递减至0.57,累计降幅达27.85%。(2) 在空间尺度上,NDVI和RSEI高值区集中在研究区南部及西北部且以林地和耕地为主,低值区分布在研究区北部且以极低覆盖度植被和荒漠为主。(3) 研究区NDVI和RSEI趋势变化以不显著/显著增加为主,DI以不显著减少为主。其中,NDVI不显著、显著增加区域占比达12.12%、61.10%;RSEI不显著、显著增加区域占比达5.06%、38.63%,生态环境质量改善区域集中在人类活动较多的西北部和东南部。1986—2021年八步沙区域植被覆盖度明显提高,生态环境质量持续改善,防沙治沙成效显著,形成了可复制的八步沙模式。
魏倩 , 马全林 , 赵锐锋 . 古浪县八步沙区域生态环境质量变化[J]. 干旱区研究, 2025 , 42(6) : 1114 -1125 . DOI: 10.13866/j.azr.2025.06.14
Located in the convergence zone of the Qinghai-Xizang Plateau Ecological Barrier and the Northern Sand Control Belt, the Babusha region acts as a frontline defense against the southward encroachment of the Tengger Desert. Assessing changes in the ecological environment quality in the Babusha region holds significant value for evaluating the effectiveness of regional desertification control and advancing the Three-North Shelterbelt Development Program. This study used data from the Google Earth Engine platform to investigate land use pattern changes in the Babusha region from 1986 to 2021. A comprehensive assessment of the spatiotemporal changes in the regional ecological environment quality was conducted using the normalized difference vegetation index (NDVI), desertification index (DI), and remote sensing ecological index (RSEI). The results were as follows: (1) Over time, the desert area in the Babusha region has continued to decrease, the grassland area has progressively increased, and the vegetation coverage has improved. From 1986 to 2021, NDVI and RSEI showed a fluctuating upward trend, with NDVI increasing from 0.14 to 0.31 (>50% increase) and RSEI increasing from 0.22 to 0.24 (9.39% increase). In contrast, DI exhibited a fluctuating downward trend, decreasing from 0.79 to 0.57 with a cumulative reduction of 27.85%. (2) Areas with high NDVI and RSEI values were concentrated in the southern and northwestern parts of the study region, dominated by woodland and cultivated land, whereas areas with low NDVI and RSEI values were distributed in the northern region characterized by extremely low vegetation coverage and desert. (3) The trend analysis primarily revealed a nonsignificant or significant increase in NDVI and RSEI values and a nonsignificant decrease in DI values. Specifically, 12.12% and 61.10% of the study area exhibited a nonsignificant and significant increase in NDVI, respectively, whereas 5.06% and 38.63% of the study area showed a nonsignificant and significant increase in RSEI, respectively. The ecological improvement areas were concentrated in the northwestern and southeastern regions with higher human activity levels. From 1986 to 2021, the Babusha region demonstrated marked vegetation restoration, sustained improvement in the ecological environment, and significantly effective desertification control, facilitating the establishment of a replicable Babusha model.
图5 1986—2021年八步沙区域NDVI分级Fig. 5 NDVI classification for the Babusha region from 1986 to 2021 |
表1 八步沙区域NDVI各等级面积占比Tab. 1 Percentage of area in each class of NDVI in the Babusha region /% |
| NDVI | 1986年 | 1990年 | 1995年 | 2000年 | 2005年 | 2010年 | 2015年 | 2021年 |
|---|---|---|---|---|---|---|---|---|
| 极低值 | 0.02 | 0.02 | 0.21 | 0.47 | 0.10 | 0.44 | 0.19 | 0.04 |
| 低值 | 92.16 | 92.05 | 85.83 | 86.38 | 83.78 | 81.09 | 79.44 | 70.78 |
| 中值 | 4.27 | 5.17 | 7.40 | 7.14 | 7.10 | 5.94 | 7.21 | 13.43 |
| 高值 | 2.20 | 1.86 | 4.51 | 4.31 | 4.63 | 6.05 | 6.29 | 5.06 |
| 极高值 | 1.35 | 0.90 | 2.05 | 1.70 | 4.40 | 6.49 | 6.87 | 10.69 |
图6 1986—2021年八步沙区域DI分级Fig. 6 DI classification for the Babusha region from 1986 to 2021 |
表2 八步沙区域DI各等级面积占比Tab. 2 Percentage of area in each class of DI in Babusha region /% |
| DI | 1986年 | 1990年 | 1995年 | 2000年 | 2005年 | 2010年 | 2015年 | 2021年 |
|---|---|---|---|---|---|---|---|---|
| 非沙漠化 | 0.01 | 0.04 | 0.02 | 0.02 | 0.01 | 0.02 | 0.03 | 1.19 |
| 轻度沙漠化 | 0.92 | 0.63 | 1.64 | 2.11 | 3.18 | 5.07 | 6.16 | 9.18 |
| 中度沙漠化 | 3.05 | 2.55 | 6.63 | 6.65 | 6.84 | 8.91 | 9.51 | 13.16 |
| 重度沙漠化 | 96.02 | 96.77 | 91.72 | 91.21 | 89.98 | 86.01 | 84.31 | 76.47 |
图7 1986—2021年八步沙区域RSEI分级Fig. 7 RSEI classification for the Babusha region from 1986 to 2021 |
表3 八步沙区域RSEI各等级面积占比Tab. 3 Percentage of area in each class of RSEI in Babusha region /% |
| RSEI等级 | 1986年 | 1990年 | 1995年 | 2000年 | 2005年 | 2010年 | 2015年 | 2021年 |
|---|---|---|---|---|---|---|---|---|
| 差 | 54.23 | 68.36 | 61.16 | 54.84 | 64.91 | 53.55 | 52.25 | 62.35 |
| 较差 | 36.40 | 25.24 | 24.48 | 29.54 | 20.61 | 26.01 | 30.40 | 21.41 |
| 中等 | 6.93 | 5.35 | 10.20 | 11.51 | 8.26 | 9.28 | 14.48 | 5.05 |
| 良好 | 2.07 | 0.76 | 3.63 | 3.74 | 4.85 | 8.47 | 2.56 | 5.46 |
| 优秀 | 0.38 | 0.28 | 0.53 | 0.36 | 1.38 | 2.70 | 0.31 | 5.73 |
| [1] |
程莉, 宁志英, 杨红玲, 等. 固沙措施对流动沙丘植被和土壤特性的影响[J]. 中国沙漠, 2024, 44(2): 273-282.
[
|
| [2] |
王涛. 中国沙漠与沙漠化[M]. 河北: 河北科学技术出版社, 2003.
[
|
| [3] |
任利广, 马维伟, 李广, 等. 基于GIS的甘肃省农牧交错带土地沙化敏感性时空分布格局[J]. 干旱区资源与环境, 2022, 36(6): 149-156.
[
|
| [4] |
刘冰晶, 杨艳昭, 李依. 北方农牧交错带土地利用结构特征定量研究——以西辽河流域为例[J]. 干旱区资源与环境, 2018, 32(6): 64-71.
[
|
| [5] |
朱尖. 试论北疆文化的学理与实践定位[J]. 内蒙古社会科学, 2024, 45(1): 33-39.
[
|
| [6] |
杨景云, 金鑫, 金彦香, 等. 高寒内陆河流域湿地面积变化及其影响因素研究[J/OL]. 生态学报, 2025, 45(8): 1-16. [2025-04-08].
[
|
| [7] |
王天宏, 蒋馥根, 龙依, 等. 1990—2020年长江源地区生态环境质量动态变化及驱动力分析[J/OL]. 南京林业大学学报(自然科学版), 1-9, [2025-04-08].
[
|
| [8] |
黄豪奔, 徐海量, 林涛, 等. 2001—2020年新疆阿勒泰地区归一化植被指数时空变化特征及其对气候变化的响应[J]. 生态学报, 2022, 42(7): 2798-2809.
[
|
| [9] |
|
| [10] |
徐涵秋. 区域生态环境变化的遥感评价指数[J]. 中国环境科学, 2013, 33(5): 889-897.
[
|
| [11] |
石敏, 李慧颖, 贾明明. 基于GEE云平台与Landsat数据的山口自然保护区红树林时空变化分析[J]. 自然资源遥感, 2023, 35(2): 61-69.
[
|
| [12] |
赵安周, 田新乐. 基于GEE平台的1986—2021年黄土高原植被覆盖度时空演变及影响因素[J]. 生态环境学报, 2022, 31(11): 2124-2133.
[
|
| [13] |
张神宝, 王永芳, 郭恩亮, 等. 基于GEE的奈曼旗植被覆盖时空演变及驱动力分析[J]. 草业科学, 2023, 40(8): 1965-1976.
[
|
| [14] |
王乐. 合作治理视角下西部地区荒漠化治理研究[D]. 兰州: 兰州大学, 2022.
[
|
| [15] |
许冬梅, 梁开军, 张兴林. 甘肃省古浪县八步沙林场践行“两山”理论的调查与思考[J]. 环境保护, 2019, 47(21): 73-74.
[
|
| [16] |
胡晓娟, 李霞, 王讷. 八步沙林场防沙治沙区植被覆盖度时空演变分析[J]. 地理空间信息, 2022, 20(1): 66-69, 8.
[
|
| [17] |
马婧, 郭方君, 邹枝慧, 等. 腾格里沙漠南缘不同恢复阶段沙质草地植被的季节变化特征[J]. 草业学报, 2023, 32(5): 203-210.
[
|
| [18] |
赵鹏, 徐先英, 屈建军, 等. 民勤绿洲荒漠过渡带人工梭梭群落与水土因子的关系[J]. 生态学报, 2017, 37(5): 1496-1505.
[
|
| [19] |
|
| [20] |
梁植, 孙若辰, 段青云. 黄河水源涵养区植被NDVI时空变化特征及其驱动因子[J]. 地理科学进展, 2023, 42(9): 1717-1732.
[
|
| [21] |
付沙沙, 彭威, 邵爱梅, 等. 秦巴山区夏季NDVI变化特征及其对气候因子的响应[J]. 干旱区研究, 2023, 40(10): 1563-1574.
[
|
| [22] |
申子傲, 吴静, 李纯斌. 2000—2020年河西内陆河流域植被覆盖时空变化特征及其驱动力[J]. 中国沙漠, 2024, 44(3): 119-127.
[
|
| [23] |
|
| [24] |
赵鸿雁, 颜长珍, 李森, 等. 黄河流域2000—2020年土地沙漠化遥感监测及驱动力分析[J]. 中国沙漠, 2023, 43(3): 127-137.
[
|
| [25] |
|
| [26] |
陈帅, 昝梅. 新疆伊犁地区植被水分利用效率时空格局研究[J]. 生态科学, 2023, 42(2): 127-138.
[
|
| [27] |
龚天星. 高质量打造古浪八步沙林场“两山”实践创新基地的对策研究[J]. 农业科技与信息, 2023(5): 93-96.
[
|
| [28] |
李佳霖. 古浪县沙漠化时空演变格局及对气候-人作用的响应机制分析[D]. 淄博: 山东理工大学, 2024.
[
|
| [29] |
张清雨, 赵东升, 吴绍洪, 等. 基于生态分区的内蒙古地区植被覆盖变化及其影响因素研究[J]. 地理科学, 2013, 33(5): 594-601.
[
|
| [30] |
胡丽莉. 古浪县近51年气候变化特征[J]. 现代农业科技, 2011(17): 17-18.
[
|
| [31] |
罗晓玲, 赵慧华, 杨梅, 等. 基于MCI的河西走廊东部近60年干旱特征及对厄尔尼诺事件的响应[J/OL]. 沙漠与绿洲气象, 1-11, [2025-04-08].
[
|
| [32] |
王婷婷, 冯起, 郭小燕, 等. 1959—2014年古浪河流域降水变化特征及突变分析[J]. 高原气象, 2019, 38(6): 1251-1262.
[
|
| [33] |
胡晓娟. 利用长时序卫星影像评估防沙治沙区植被变化[J]. 北京测绘, 2024, 38(5): 739-744.
[
|
| [34] |
安婧荣. 古浪县北部沙区林分退化原因及修复措施[J]. 现代园艺, 2025, 48(6): 168-170.
[
|
/
| 〈 |
|
〉 |
