
近20 a塔里木河流域山区NDSI对气候变化的响应
|
张音(1995-),女,博士,讲师,研究方向为水文水资源. E-mail: zhyin3621@163.com |
收稿日期: 2024-04-18
修回日期: 2024-06-06
网络出版日期: 2025-08-12
基金资助
国家基础调查专项第三次新疆综合科学考察项目(2022xjkk010103)
科技创新领军人才项目(2022TSYCLJ0012)
山西省基础研究计划青年项目(202303021222222)
山西省基础研究计划青年项目(202203021222243)
Response of NDSI in the Tarim River Basin mountainous areas to climate change over the past 20 years
Received date: 2024-04-18
Revised date: 2024-06-06
Online published: 2025-08-12
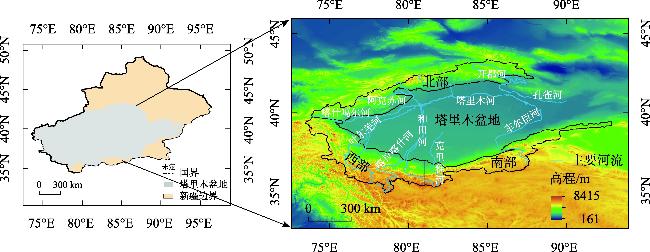
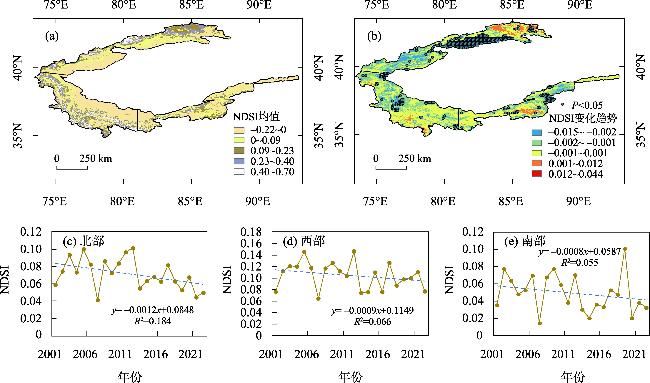
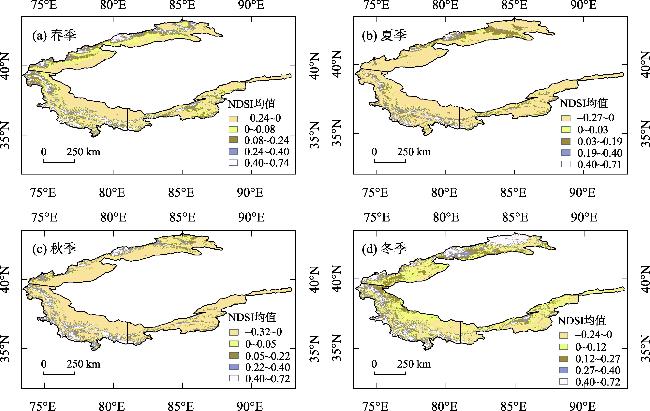
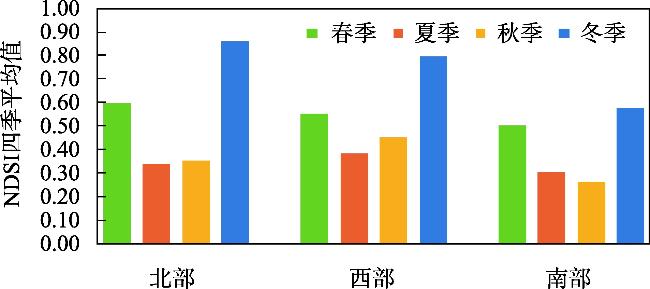
NDSI(归一化差异积雪指数)是一种评估地表积雪覆盖程度的指数,对研究山区积雪变化有重要作用。本研究基于2001—2022年遥感数据和再分析数据,采用趋势分析法、多元线性回归法等,分析了近20 a来塔里木河流域山区NDSI时空变化及其归因。结果表明:塔里木河流域山区2001—2022年NDSI均呈下降趋势,具有显著的空间异质性。北部和西部山区,NDSI值的季节变化相同,NDSI平均值从高到低为:冬季>春季>秋季>夏季,而南部山区的NDSI平均值夏季高于秋季。塔里木河流域山区年均实际蒸散发均呈上升趋势。北部山区的降水呈略微下降的趋势,而西部和南部山区表现为上升趋势。所有山区的饱和水汽压差均呈上升趋势。下行地表太阳辐射呈下降趋势。北部和西部山区的最低气温呈上升趋势,南部山区略呈下降趋势,而所有区域最高气温均呈上升趋势。众多变量中,气温和饱和水汽压对NDSI的影响较大。本研究可为政策决策提供科学依据。
张音 , 孙从建 , 刘庚 , 钞锦龙 , 耿甜伟 . 近20 a塔里木河流域山区NDSI对气候变化的响应[J]. 干旱区研究, 2024 , 41(10) : 1639 -1648 . DOI: 10.13866/j.azr.2024.10.03
NDSI is used to evaluate the degree of surface snow cover, which plays a vital role in exploring snow cover changes in mountainous areas. In this study, remote sensing data and reanalysis data from 2001 to 2022, trend analysis, and multiple linear regression were used to analyze the spatiotemporal changes and attribution of NDSI in the mountainous areas of the Tarim River Basin over the past 20 years. Results indicated a downward trend of NDSI in the mountainous areas of the Tarim River Basin from 2001 to 2022, with significant spatial heterogeneity. The seasonal variation of NDSI was similar in the northern and western mountainous areas, with the average NDSI ranking from high to low in winter>spring>autumn>summer. However, the average NDSI in the southern mountainous areas was higher in summer than in autumn. The average annual actual evapotranspiration in the mountainous areas of the Tarim River Basin showed an increasing trend. Precipitation in the northern mountainous areas exhibited a slight downward trend, whereas that in the western and southern mountainous areas showed an upward trend. The difference in saturated water vapor pressure showed an upward trend in all mountainous areas. The downward surface solar radiation exhibited a decreasing trend. The minimum temperature in the northern and western mountainous areas showed an increasing trend, whereas that in the southern mountainous areas showed a slightly decreasing trend. The maximum temperature in all regions exhibited an upward trend. Among these variables, temperature and saturated water vapor pressure exerted a significant impact on NDSI. This study can provide a scientific basis for policy decision-making.
Key words: Tarim River Basin; snow cover; climate change; NDSI; multiple linear regression
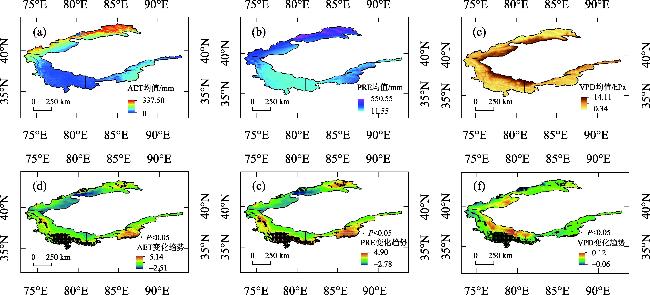
图5 2001—2022年流域AET、PRE和VPD的空间分布Fig. 5 Spatial distribution of AET, PRE, and VPD in the basin from 2001 to 2022 |
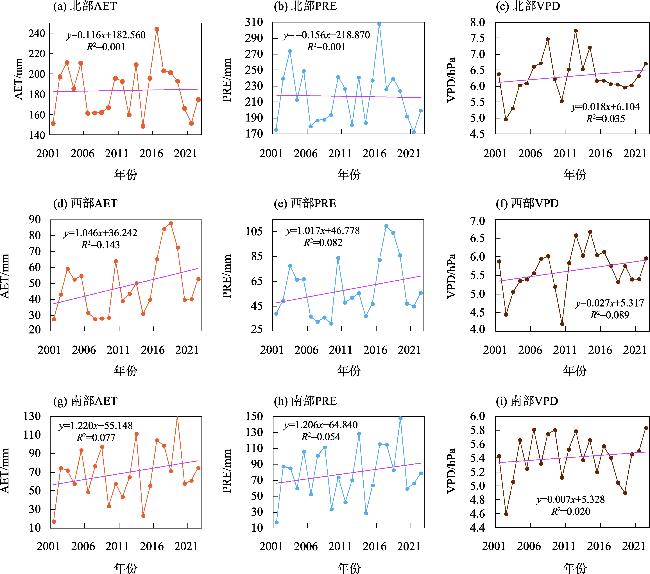
图6 2001—2022年流域AET、PRE和VPD的变化趋势Fig. 6 Trend changes of AET, PRE, and VPD in the basin from 2001 to 2022 |
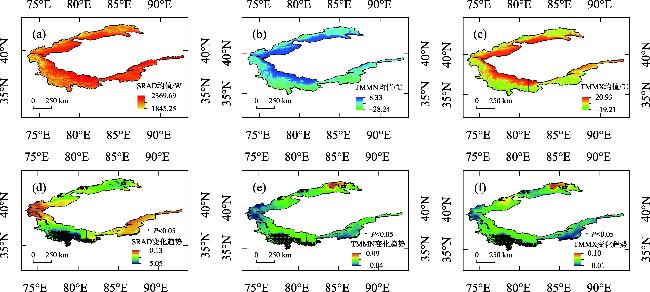
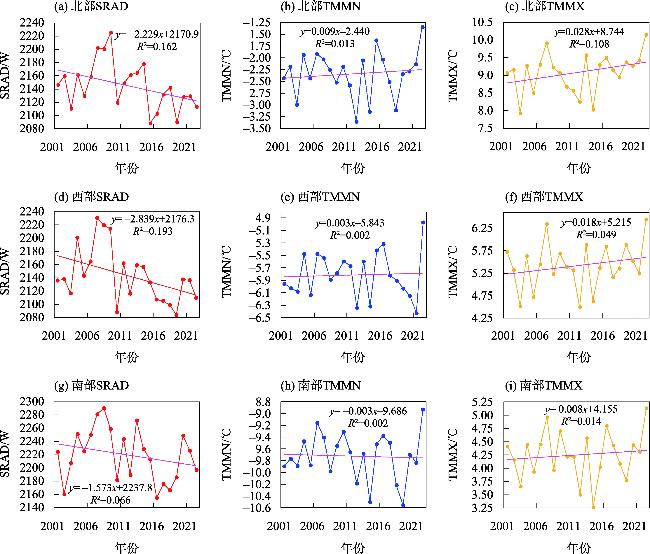
图7 2001—2022年流域SRAD、TMMN、TMMX的空间分布Fig. 7 Spatial distribution of SRAD, TMMN, and TMMX in the basin from 2001 to 2022 |
表1 NDSI与各变量之间的回归系数Tab. 1 Regression coefficients between NDSI and various variables |
| β1(AET) | β2(PRE) | β3(VPD) | β4(SRAD) | β5(TMMN) | β6(TMMX) | ||
|---|---|---|---|---|---|---|---|
| 北部 | 年均值 | -0.13* | 0.48* | 0.89* | -0.18* | -0.60* | -0.53* |
| 春季 | -0.16* | -0.15* | -0.16* | 0.40* | 0.26* | -0.53* | |
| 夏季 | -0.19* | 0.54* | -0.37* | -0.86* | -1.94* | 3.48* | |
| 秋季 | -0.24* | -0.11* | -1.09* | -0.37* | -0.64* | 1.95* | |
| 冬季 | 0.16* | -0.34* | -0.65* | -0.14* | -0.01 | 0.33* | |
| 西部 | 年均值 | -0.10* | 0.12* | 0.81* | -0.88* | -1.89* | 1.08* |
| 春季 | 0.20* | 0.32* | 0.48* | 0.44* | -1.22* | 0.45* | |
| 夏季 | 0.14* | -0.02 | 0.84* | -0.37* | -1.73* | 1.17* | |
| 秋季 | 0.24* | 0.20* | 0.73* | 0.47* | -0.82* | -0.29 | |
| 冬季 | 0.00 | 0.18* | 0.51* | -0.38* | -2.63* | 2.39* | |
| 南部 | 年均值 | -0.32* | 0.21* | 0.84* | -0.92* | -2.32* | 1.68* |
| 春季 | 0.32* | -0.06* | 0.67* | 0.01 | 2.89* | -3.85* | |
| 夏季 | -0.14* | -0.02 | 0.54* | -0.32* | 1.13* | -1.60* | |
| 秋季 | 0.12* | -0.13* | 0.98* | 0.05* | 1.93* | -3.15* | |
| 冬季 | 0.09* | -0.01 | -0.19* | -0.03 | 0.11 | 0.01 |
注:*表示P<0.05水平下显著。正负表示正负驱动。 |
| [1] |
康世昌, 郭万钦, 钟歆玥, 等. 全球山地冰冻圈变化、影响与适应[J]. 气候变化研究进展, 2020, 16(2): 143-152.
[
|
| [2] |
肖雄新, 张廷军. 基于被动微波遥感的积雪深度和雪水当量反演研究进展[J]. 地球科学进展, 2018, 33(6): 590-605.
[
|
| [3] |
孙成杰, 王剑庚, 张永宏, 等. 2002—2021年北半球中高纬度典型山脉积雪的时空变化对比分析[J]. 冰川冻土, 2024, 46(2): 475-488.
[
|
| [4] |
效存德, 杨佼, 张通, 等. 冰冻圈变化的可预测性、不可逆性和深度不确定性[J]. 气候变化研究进展, 2022, 18(1): 1-11.
[
|
| [5] |
王建, 车涛, 李震, 等. 中国积雪特性及分布调查[J]. 地球科学进展, 2018, 33(1): 12-26.
[
|
| [6] |
曹晓云, 肖建设, 郝晓华, 等. 2001—2020年三江源地区积雪日数变化及地形分异[J]. 干旱区地理, 2022, 45(5): 1370-1380.
[
|
| [7] |
李虹, 李忠勤, 陈普晨, 等. 近20 a新疆阿尔泰山积雪时空变化及其影响因素[J]. 干旱区研究, 2023, 40(7): 1040-1051.
[
|
| [8] |
|
| [9] |
黄晓东, 马英, 李雨馨, 等. 1980—2020年青藏高原积雪时空变化特征[J]. 冰川冻土, 2023, 45(2): 423-434.
[
|
| [10] |
钟鼎杰, 孙梦鑫, 张岳, 等. 2001—2020年川西高原积雪时空变化及影响因素分析研究[J]. 干旱区资源与环境, 2021, 35(11): 111-118.
[
|
| [11] |
|
| [12] |
|
| [13] |
秦艳, 丁建丽, 赵求东, 等. 2001—2015年天山山区积雪时空变化及其与温度和降水的关系[J]. 冰川冻土, 2018, 40(2): 249-260.
[
|
| [14] |
|
| [15] |
张齐飞, 陈亚宁, 孙从建, 等. 塔里木河流域水储量变化及绿洲生态安全评估[J]. 干旱区地理, 2024, 47(1): 1-14.
[
|
| [16] |
王诗语, 孙从建, 陈伟, 等. 基于水化学及径流组成的中国西北内陆河流域水资源风险评估[J]. 地理学报, 2023, 78(11): 2763-2780.
[
|
| [17] |
孙从建, 陈伟, 王诗语. 气候变化下的塔里木盆地西南部内陆河流域径流组分特征分析[J]. 干旱区研究, 2022, 39(1): 113-122.
[
|
| [18] |
|
| [19] |
|
| [20] |
梁天刚, 高新华, 黄晓东, 等. 新疆北部MODIS积雪制图算法的分类精度[J]. 干旱区研究, 2007, 24(4): 446-452.
[
|
| [21] |
肖潇, 邱新法, 徐金勤. 基于TerraClimate数据集的1960—2019年中国干湿气候变化特征[J]. 长江科学院院报, 2023, 40(2): 27-33, 43.
[
|
| [22] |
|
| [23] |
|
| [24] |
穆振侠, 姜卉芳. 新疆阿克苏河流域昆马力克河积雪消融规律对气候变化的响应[J]. 冰川冻土, 2012, 34(6): 1284-1292.
[
|
| [25] |
|
| [26] |
|
| [27] |
|
| [28] |
|
| [29] |
邓兴耀, 刘洋, 刘志辉, 等. 中国西北干旱区蒸散发时空动态特征[J]. 生态学报, 2017, 37(9): 2994-3008.
[
|
| [30] |
|
| [31] |
|
| [32] |
尤元红, 甘宏泽, 侯金亮, 等. 基于MODIS数据的2002—2020年北疆积雪时空变化研究[J]. 遥感技术与应用, 2024, 39(3): 718-726.
[
|
/
| 〈 |
|
〉 |