
Spatiotemporal changes of snow depth and climate attribution in the Three River Source Region from 1980 to 2020 based on remote sensing monitoring
Received date: 2025-03-06
Revised date: 2025-05-26
Online published: 2026-03-11
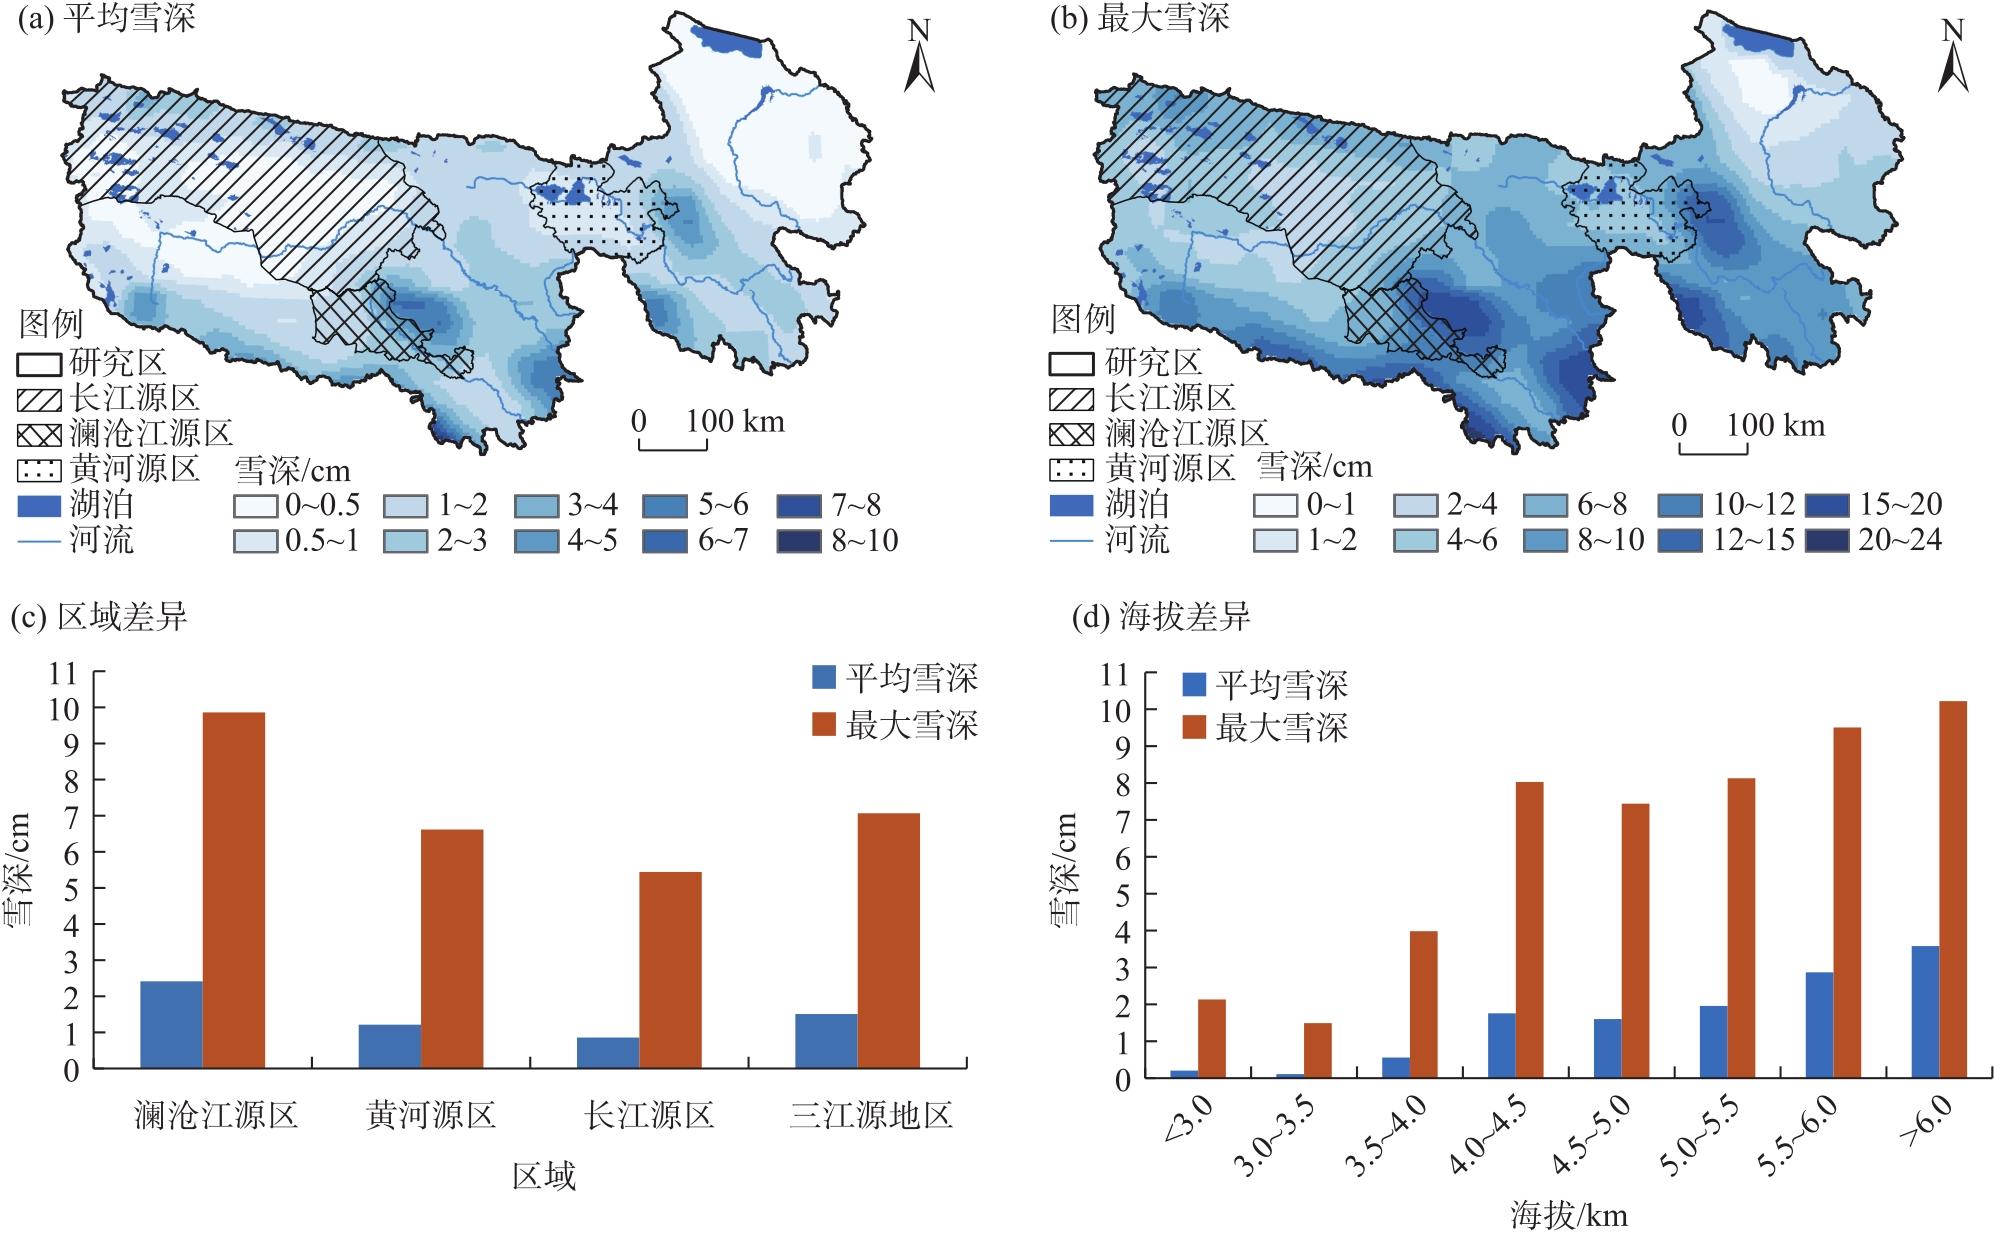
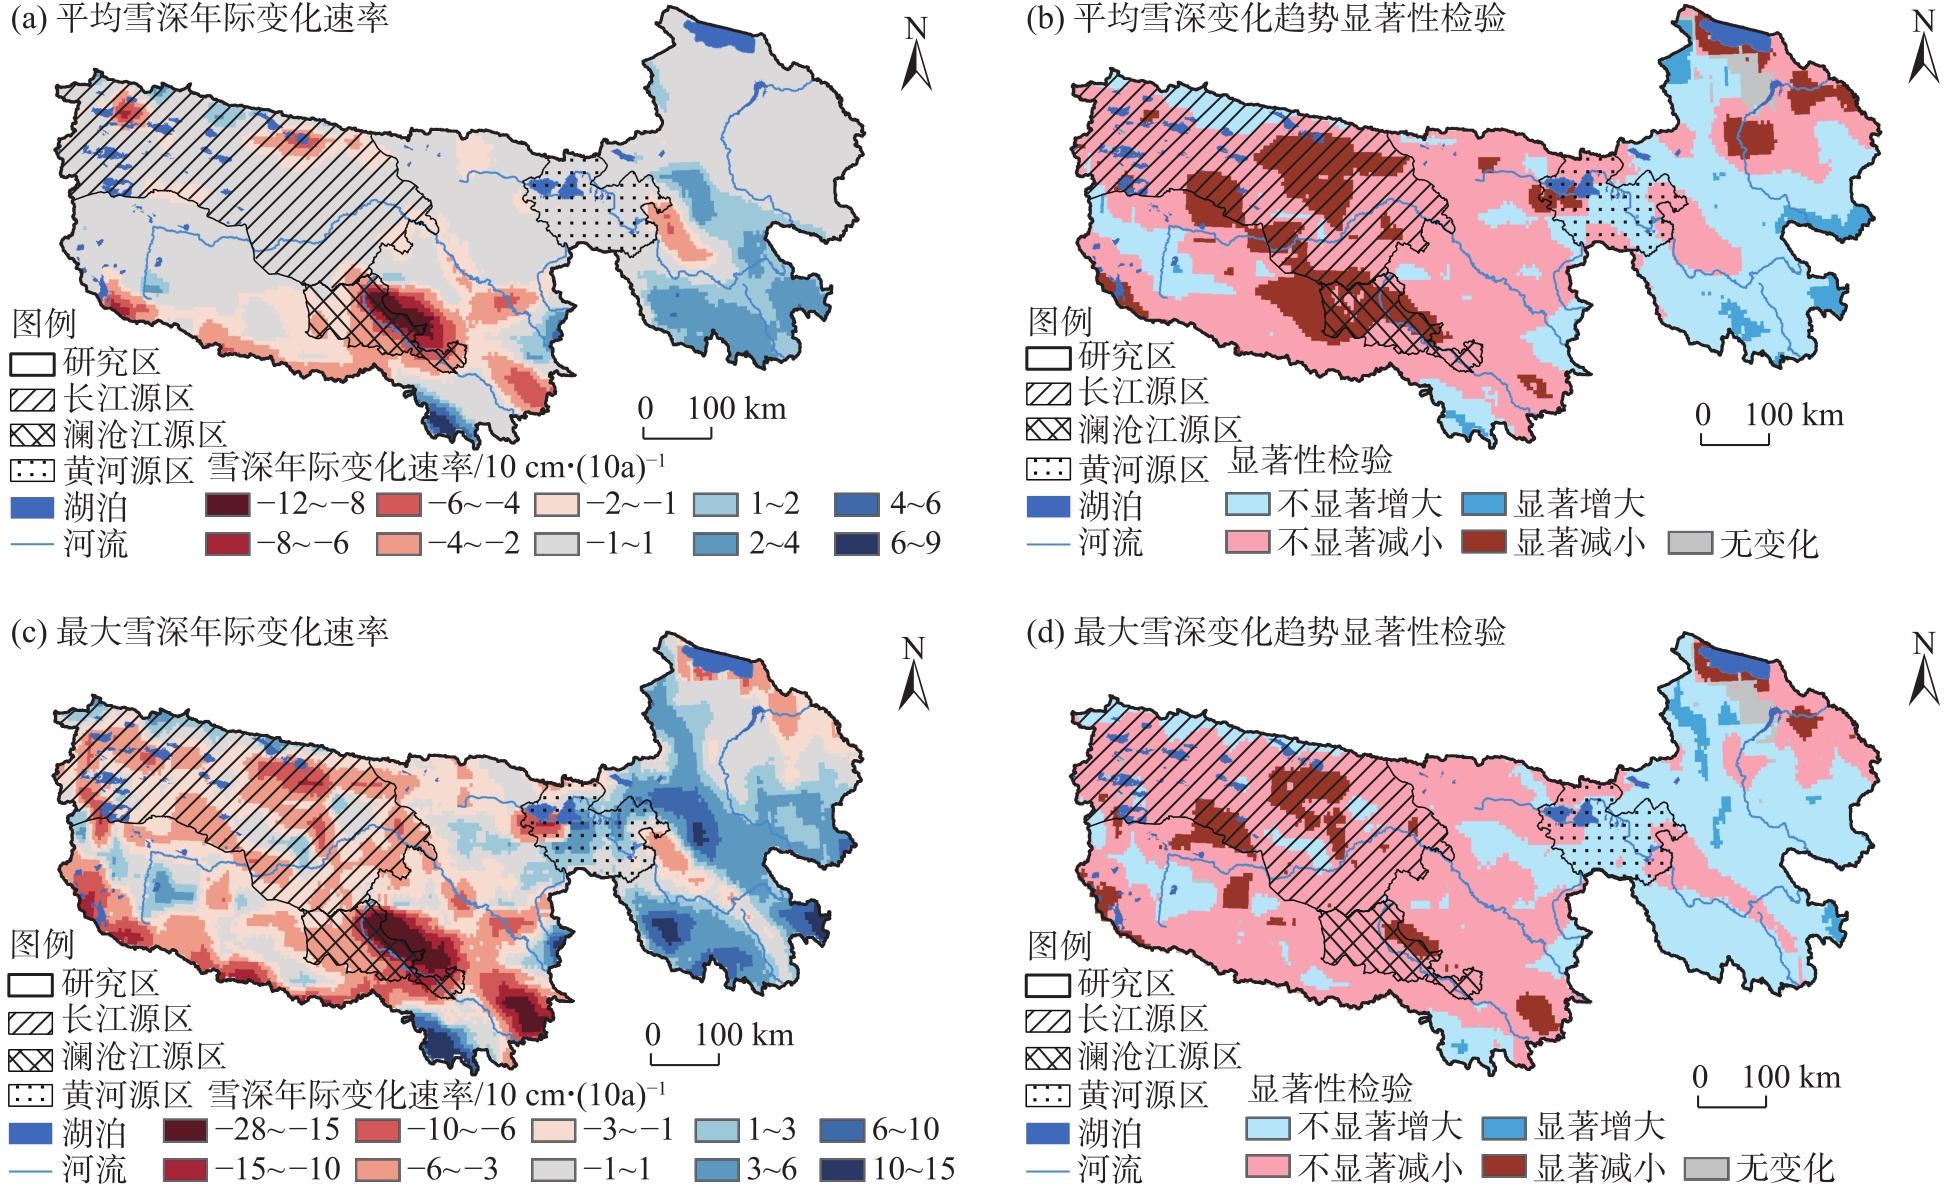
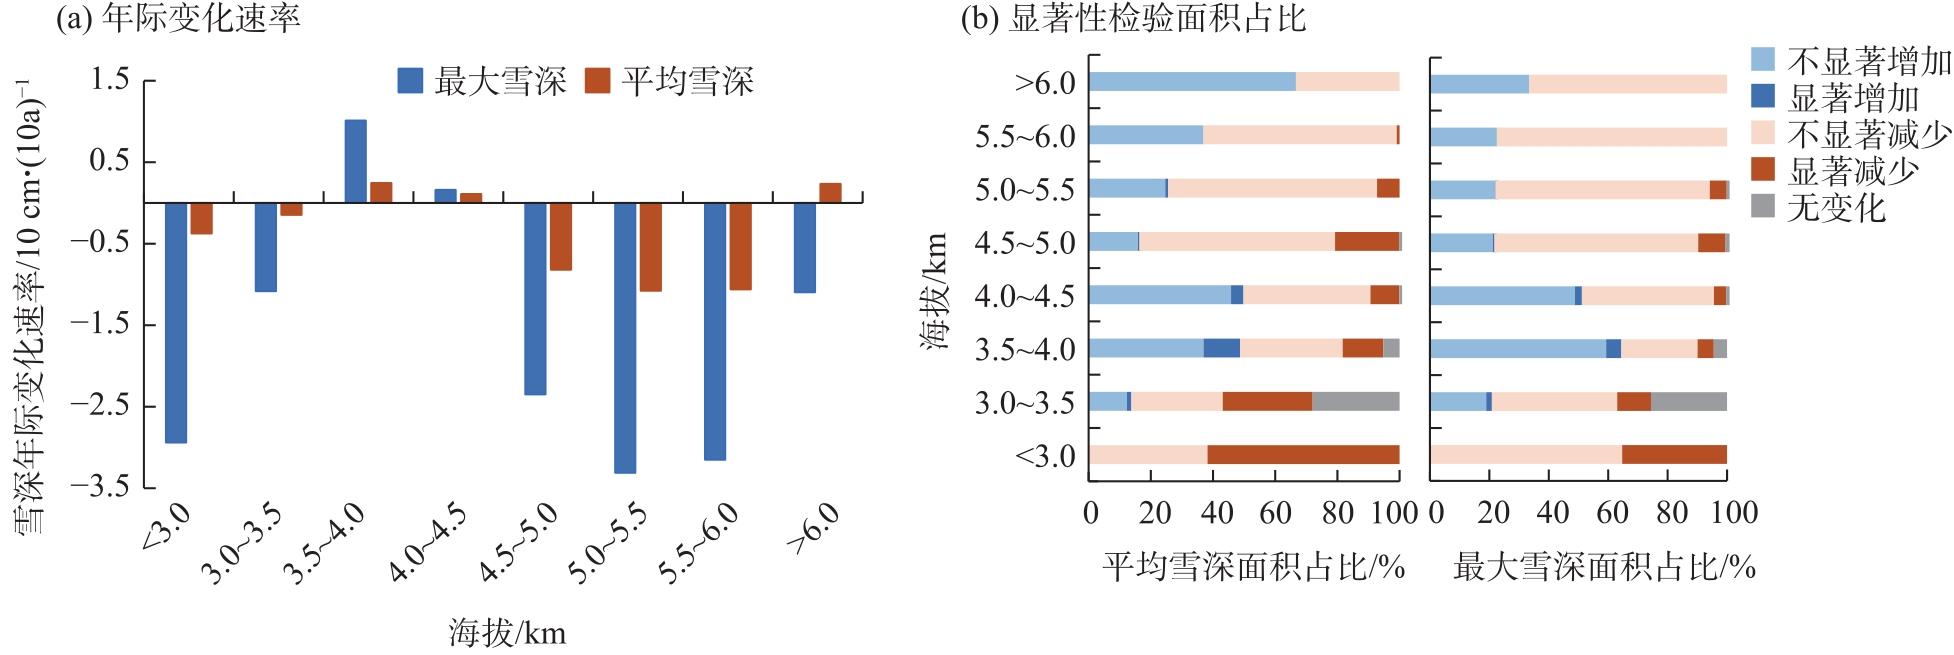
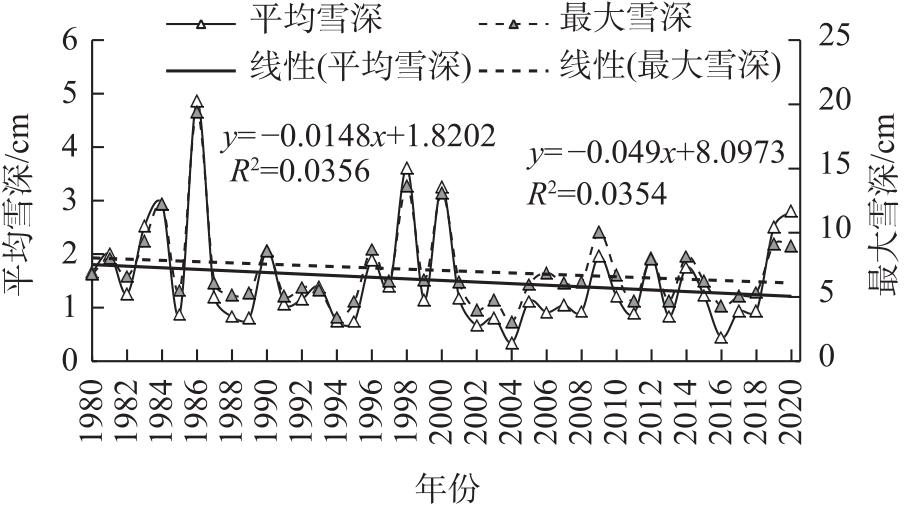
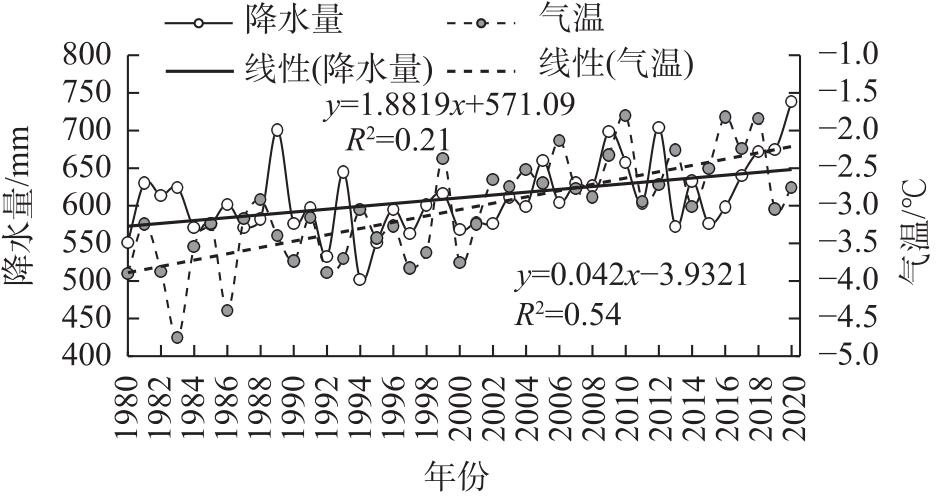
Changes in the snowpack in the Three Rivers Source Region have important implications for regional and global climate, the hydrological cycle, and ecosystems. However, systematic, long-term monitoring of snow depth dynamics and climate attribution based on remotely sensed data across regions and elevation gradients remains limited. This study analyzed the spatial and temporal patterns of snow depth change in the Three Rivers Source Region from 1980 to 2020 using remote sensing data stratified by subregions and elevation bands, and quantified the relative contributions of temperature and precipitation. The results show that (1) Snow depth in the Three Rivers Source Region exhibited pronounced spatial heterogeneity over the past 41 years, with average snow depth in high-elevation mountain ranges generally exceeding 3 cm and maximum snow depth generally exceeding 6 cm. Average and maximum snow depths decreased significantly at rates of 0.15 cm·(10a)-1 and 0.49 cm·(10a)-1, respectively. A decreasing trend was observed in average snow depth across 68.44% of the region and in maximum snow depth across 63.83% of the region, with significantly decreasing areas accounting for 15.64% and 7.47%, respectively. (2) Pronounced regional and altitudinal differences in snow depth and its changes were observed, with the highest mean and maximum snow depths (2.41 cm and 9.86 cm, respectively) and the fastest decreasing rates [0.37 cm·(10a)-1 and 0.81 cm·(10a)-1, respectively] occurring in the Lancang River source area. Snow depth increased with altitude, with vertical gradients of 0.49 cm·km-1 for mean snow depth and 1.29 cm·km-1 for maximum snow depth. Mean snow depth declined across all elevation bands except the 3.5-4.5 km and >6.0 km bands, whereas maximum snow depth declined across all elevation bands except the 3.5-4.5 km band, with the fastest decrease occurring in the 5.0-5.5 km band. (3) The pronounced “warming and humidifying” climate trend over the past 41 years is the primary driver of snow depth decline in the Three Rivers Source Region, with temperature identified as the dominant controlling factor. The influence of climate change exhibits clear regional and altitudinal differences, with snow depth reductions particularly evident in low-altitude (<3.5 km) and high-altitude (>4.5 km) areas. These findings provide a scientific basis for optimizing snow water resource allocation, ecosystem protection and restoration, and predicting regional climate change trends in the Three Rivers Source Region.
Xiaoyun CAO , Bingrong ZHOU , Chunmiao LEI , Zhiyuan LIU , Feifei SHI , Yuqian YAN . Spatiotemporal changes of snow depth and climate attribution in the Three River Source Region from 1980 to 2020 based on remote sensing monitoring[J]. Arid Land Geography, 2026 , 49(2) : 356 -368 . DOI: 10.12118/j.issn.1000-6060.2025.118
图5 1980—2020年三江源地区雪深年际变化速率及其显著性检验空间分布Fig. 5 Spatial distributions of interannual variation rate of snow depth and its significance test in the Three River Source Region from 1980 to 2020 |
表1 1980—2020 年三江源地区不同区域雪深年际变化速率及其显著性检验统计Tab. 1 Interannual variation rate of snow depth and its significance test in different regions of the Three River Source Region from 1980 to 2020 |
| 区域 | 年际变化速率 /10 cm·(10a)-1 | 不显著减小面积 占比/% | 显著减小面积 占比/% | 不显著增加面积 占比/% | 显著增加面积 占比/% | 无变化面积 占比/% | |||||||||||
|---|---|---|---|---|---|---|---|---|---|---|---|---|---|---|---|---|---|
| 平均 雪深 | 最大 雪深 | 平均 雪深 | 最大 雪深 | 平均 雪深 | 最大 雪深 | 平均 雪深 | 最大 雪深 | 平均 雪深 | 最大 雪深 | 平均 雪深 | 最大 雪深 | ||||||
| 澜沧江源区 | -3.73 | -8.14 | 43.47 | 90.67 | 56.53 | 9.33 | 0.00 | 0.00 | 0.00 | 0.00 | 0.00 | 0.00 | |||||
| 黄河源区 | -0.15 | 0.31 | 45.79 | 36.58 | 8.28 | 0.00 | 45.79 | 62.35 | 0.13 | 0.00 | 0.00 | 1.07 | |||||
| 长江源区 | -0.62 | -2.58 | 62.06 | 73.42 | 27.45 | 13.32 | 10.10 | 12.51 | 0.00 | 0.00 | 0.39 | 0.76 | |||||
| 三江源地区 | -1.48 | -4.90 | 52.80 | 56.36 | 15.64 | 7.47 | 27.38 | 33.25 | 2.90 | 1.52 | 1.28 | 1.39 | |||||
| [1] |
曹晓云, 肖建设, 郝晓华, 等. 2001—2020年三江源地区积雪日数变化及地形分异[J]. 干旱区地理, 2022, 45(5): 1370-1380.
[
|
| [2] |
车涛, 郝晓华, 戴礼云, 等. 青藏高原积雪变化及其影响[J]. 中国科学院院刊, 2019, 34(11): 1247-1253.
[
|
| [3] |
王建, 车涛, 李震, 等. 中国积雪特性及分布调查[J]. 地球科学进展, 2018, 33(1): 12-26.
[
|
| [4] |
王宁练, 盛煜, 金汇军, 等. 祁连山水塔变化及其影响[M]. 北京: 科学出版社, 2023: 116-135.
[
|
| [5] |
周秉荣, 袁佳双, 乔斌, 等. 青藏高原气候与冰冻圈变化研究进展[J]. 环境科学研究, 2024, 37(9): 1885-1896.
[
|
| [6] |
|
| [7] |
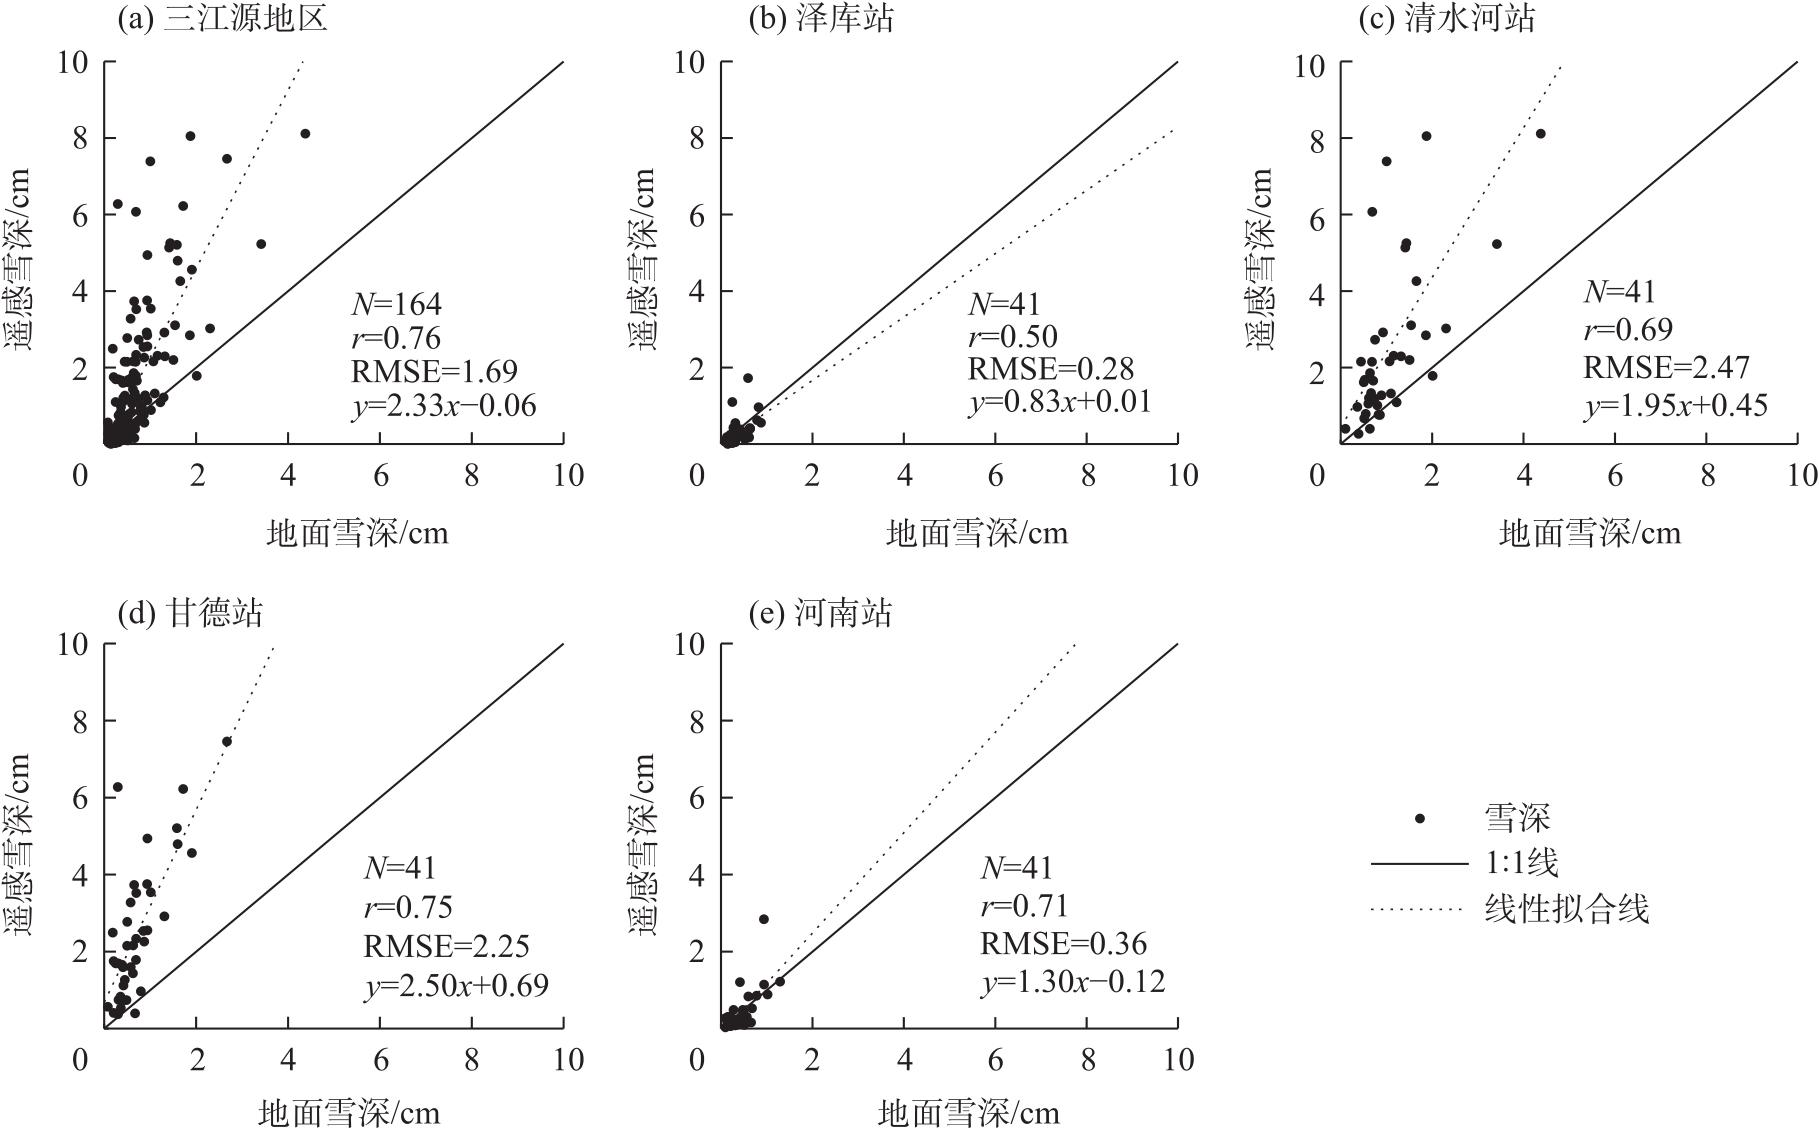
王静, 车涛, 戴礼云, 等. 被动微波遥感反演雪深与气象站观测雪深时空对比[J]. 遥感学报, 2023, 27(9): 2060-2071.
[
|
| [8] |
孟宪红, 陈昊, 李照国, 等. 三江源区气候变化及其环境影响研究综述[J]. 高原气象, 2020, 39(6): 1133-1143.
[
|
| [9] |
|
| [10] |
王成武, 尧良杰, 汪宙峰, 等. 2000—2020年三江源地区景观生态风险评价及驱动因素[J]. 干旱区研究, 2024, 41(11): 1908-1920.
[
|
| [11] |
姚檀栋, 王伟财, 杨威, 等. 亚洲水塔失衡与冰雪变化[J]. 气候变化研究进展, 2024, 20(6): 689-698.
[
|
| [12] |
靳铮, 游庆龙, 吴芳营, 等. 青藏高原三江源地区近60 a气候与极端气候变化特征分析[J]. 大气科学学报, 2020, 43(6): 1042-1055.
[
|
| [13] |
刘义花, 李红梅, 申红艳, 等. 三江源地区降雪量演变特征及其对径流的影响[J]. 高原气象, 2022, 41(2): 420-429.
[
|
| [14] |
曹晓云, 张娟, 王镜, 等. 近40 年青藏高原雪深变化及对气候变化的响应分析[J]. 高原气象, 2025, 44(5): 1133-1145.
[
|
| [15] |
陈龙飞, 张万昌, 高会然. 三江源地区1980—2019年积雪时空动态特征及其对气候变化的响应[J]. 冰川冻土, 2022, 44(1): 133-146.
[
|
| [16] |
李红梅, 颜亮东, 温婷婷, 等. 三江源地区气候变化特征及其影响评估[J]. 高原气象, 2022, 41(2): 306-316.
[
|
| [17] |
史飞飞, 李晓东, 肖建设, 等. 基于MOD10A1 V6产品下青海省各片区积雪的分布气候特征[J]. 生态科学, 2024, 43(4): 27-38.
[
|
| [18] |
黄晓东, 马英, 李雨馨, 等. 1980—2020年青藏高原积雪时空变化特征[J]. 冰川冻土, 2023, 45(2): 423-434.
[
|
| [19] |
效存德, 杨佼, 张通, 等. 冰冻圈变化的可预测性、不可逆性和深度不确定性[J]. 气候变化研究进展, 2022, 18(1): 1-11.
[
|
| [20] |
车涛, 戴礼云, 李新. 中国雪深长时间序列数据集(1979—2023)[DB/OL]. [2024-09-24]. https://www.tpdc.ac.cn/zh-hans/data/df40346a-0202-4ed2-bb07-b65dfcda9368.
[Che Tao, Dai Liyun, Li Xin. Long-term series of daily snow depth dataset in China (1979—2024)[DB/OL]. [2024-09-24]. https://www.tpdc.ac.cn/zh-hans/data/df40346a-0202-4ed2-bb07-b65dfcda9368.]
|
| [21] |
王园园, 郑照军. 气象台站积雪观测空间代表性评估数据集[DB/OL]. [2025-05-01]. https://www.geodata.cn/data/datadetails.html?dataguid=122629981720606&docId=3755.
[
|
| [22] |
王芝兰, 张飞民, 王澄海, 等. 1980—2019年青藏高原积雪深度时空差异性分析[J]. 冰川冻土, 2022, 44(3): 810-821.
[
|
| [23] |
徐帆, 张彦丽, 李克恭. 基于MODIS积雪覆盖度数据的青藏高原两套被动微波雪深产品降尺度对比研究[J]. 冰川冻土, 2024, 46(1): 65-76.
[
|
| [24] |
阳坤, 姜尧志, 唐文君, 等. 第三极地区长时间序列高分辨率地面气象要素驱动数据集(TPMFD, 1979—2022)[DB/OL]. [2025-04-02]. https://www.tpdc.ac.cn/zh-hans/data/44a449ce-e660-44c3-bbf2-31ef7d716ec7.
[Yang Kun, Jiang Yaozhi, Tang Wenjun, et al. A high-resolution near-surface meteorological forcing dataset for the Third Pole region (TPMFD, 1979—2022)[DB/OL]. [2025-04-02]. https://www.tpdc.ac.cn/zh-hans/data/44a449ce-e660-44c3-bbf2-31ef7d716ec7.]
|
| [25] |
张群慧, 常亮, 顾小凡, 等. 1979—2020年柴达木盆地人体舒适度指数时空变化及趋势分析[J]. 干旱区研究, 2024, 41(8): 1300-1308.
[
|
| [26] |
黄嘉佑, 李庆祥. 气象数据统计分析方法[M]. 北京: 气象出版社, 2015: 12-50.
[
|
| [27] |
沈鎏澄, 吴涛, 游庆龙, 等. 青藏高原中东部积雪深度时空变化特征及其成因分析[J]. 冰川冻土, 2019, 41(5): 1150-1161.
[
|
| [28] |
陈乾金, 王丽华, 高波, 等. 青藏高原1985年冬季异常少雪和1986年异常多雪的环流及气候特征对比研究[J]. 气象学报, 2000, 58(2): 202-213.
[
|
| [29] |
|
| [30] |
李双双, 胡佳岚, 段克勤, 等. 基于遥感监测的秦岭南北积雪日数时空变化及影响因素[J]. 地理学报, 2023, 78(1): 121-138.
[
|
/
| 〈 |
|
〉 |