
Muskmelon production pattern and its contributing factors in Xinjiang
Received date: 2024-10-19
Revised date: 2024-12-31
Online published: 2026-03-11
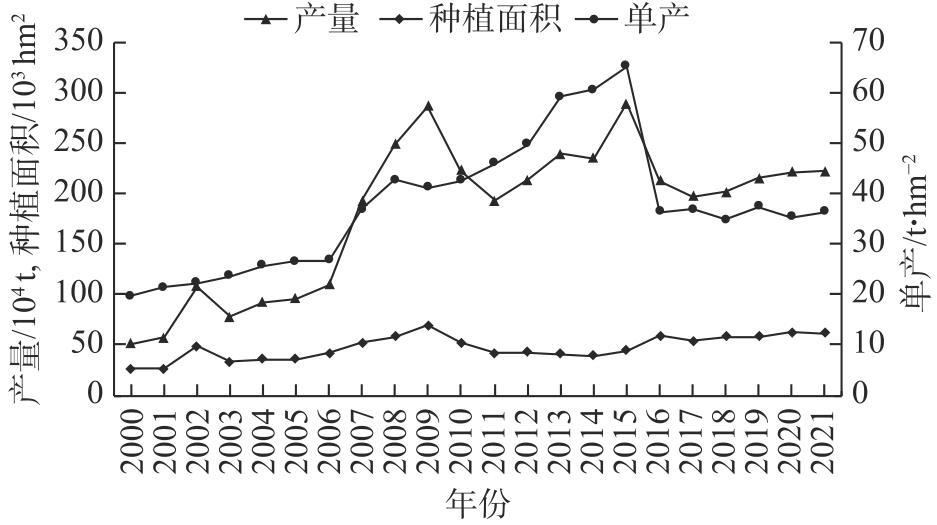
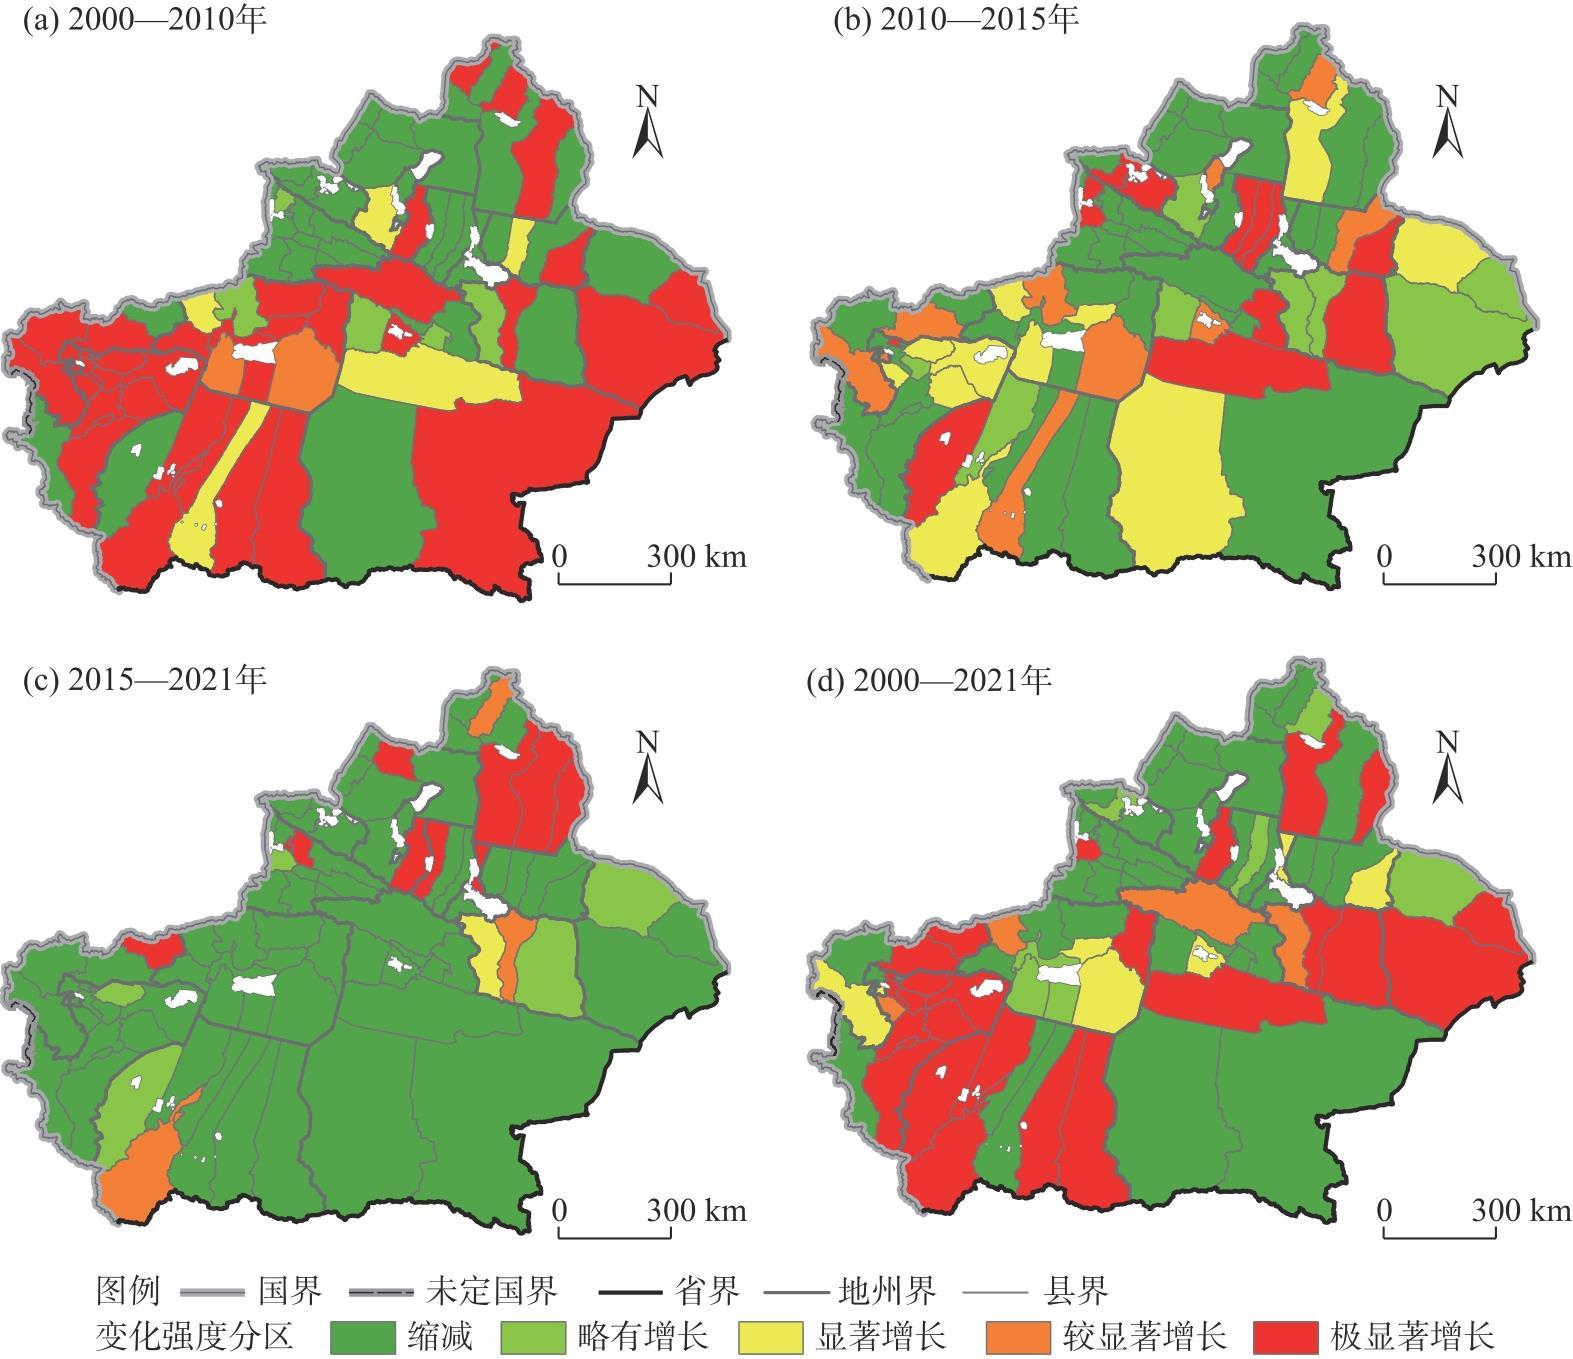
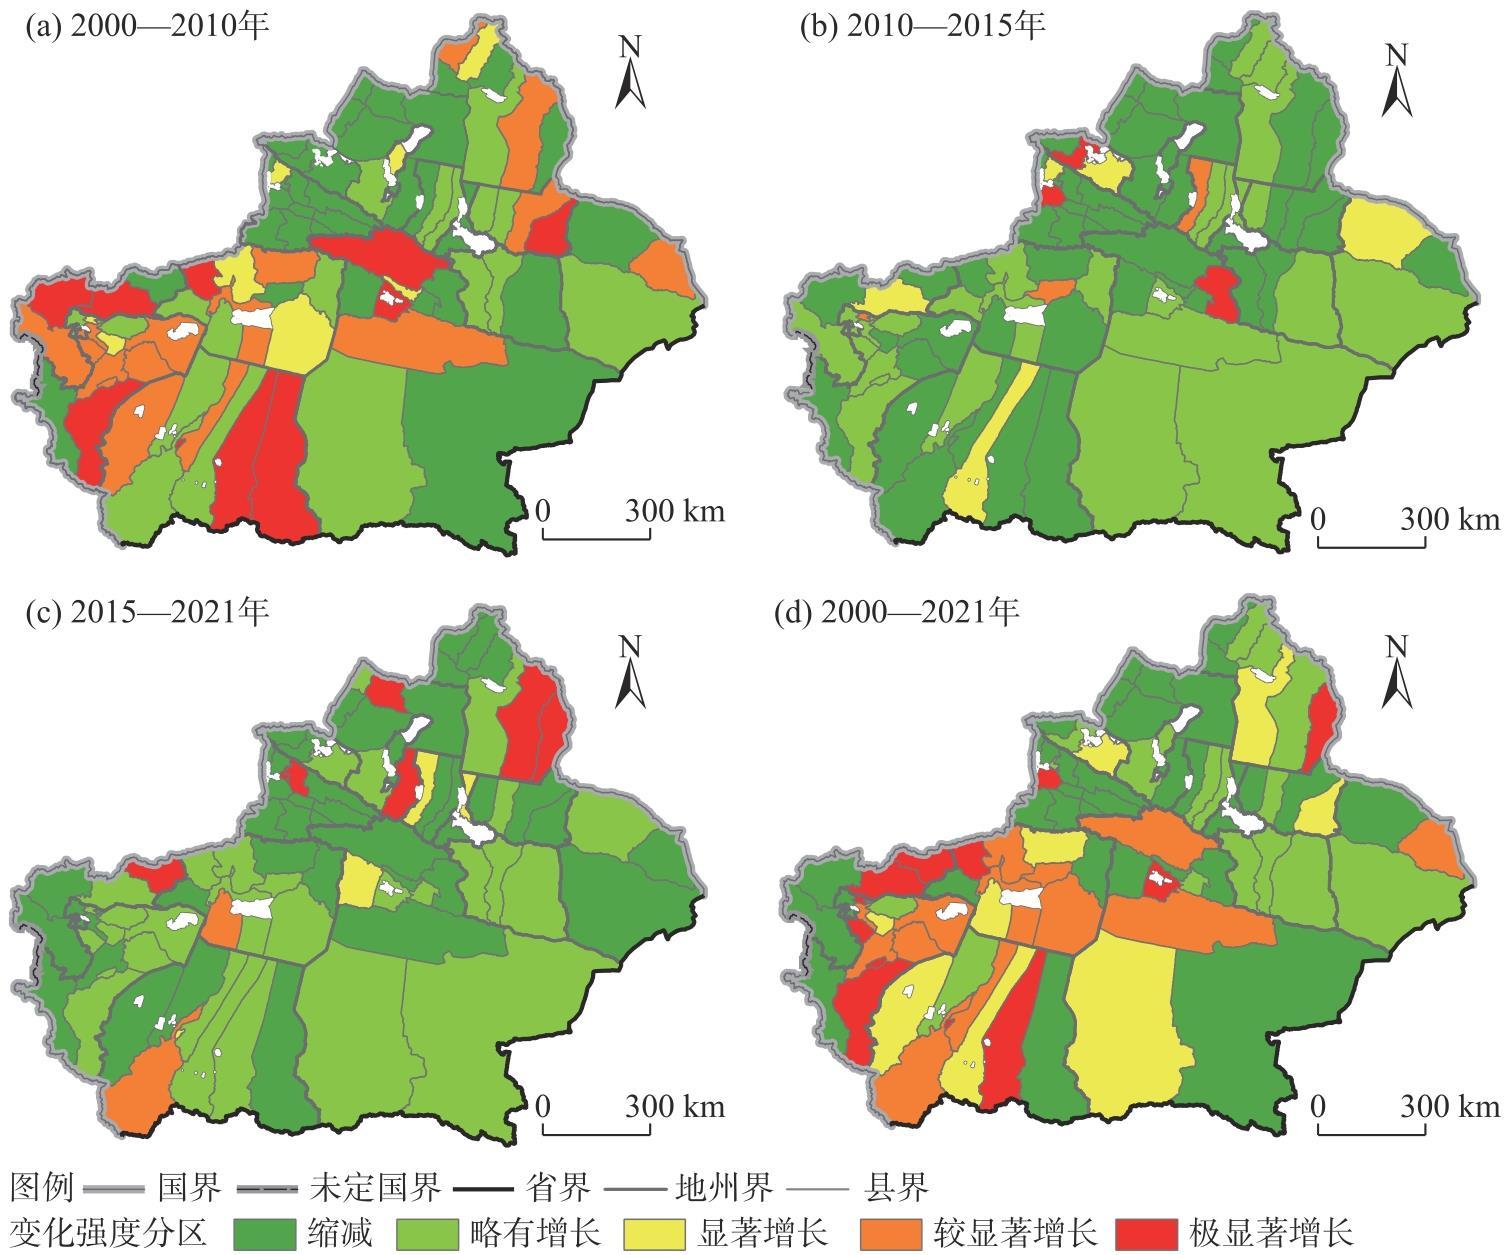
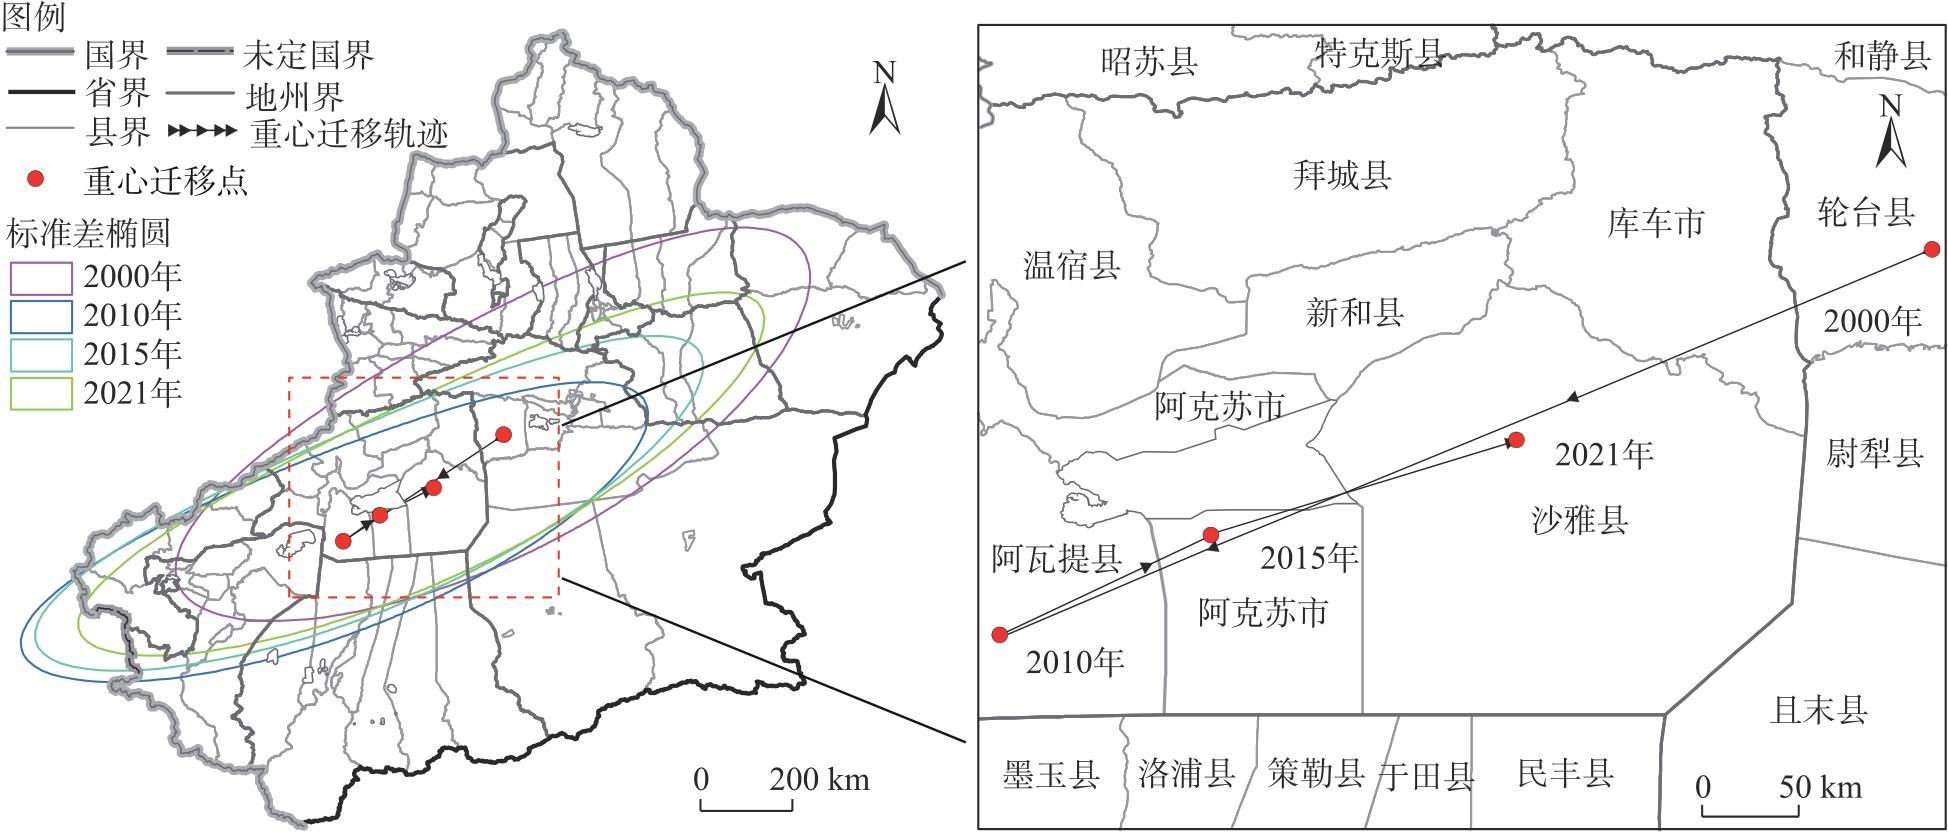
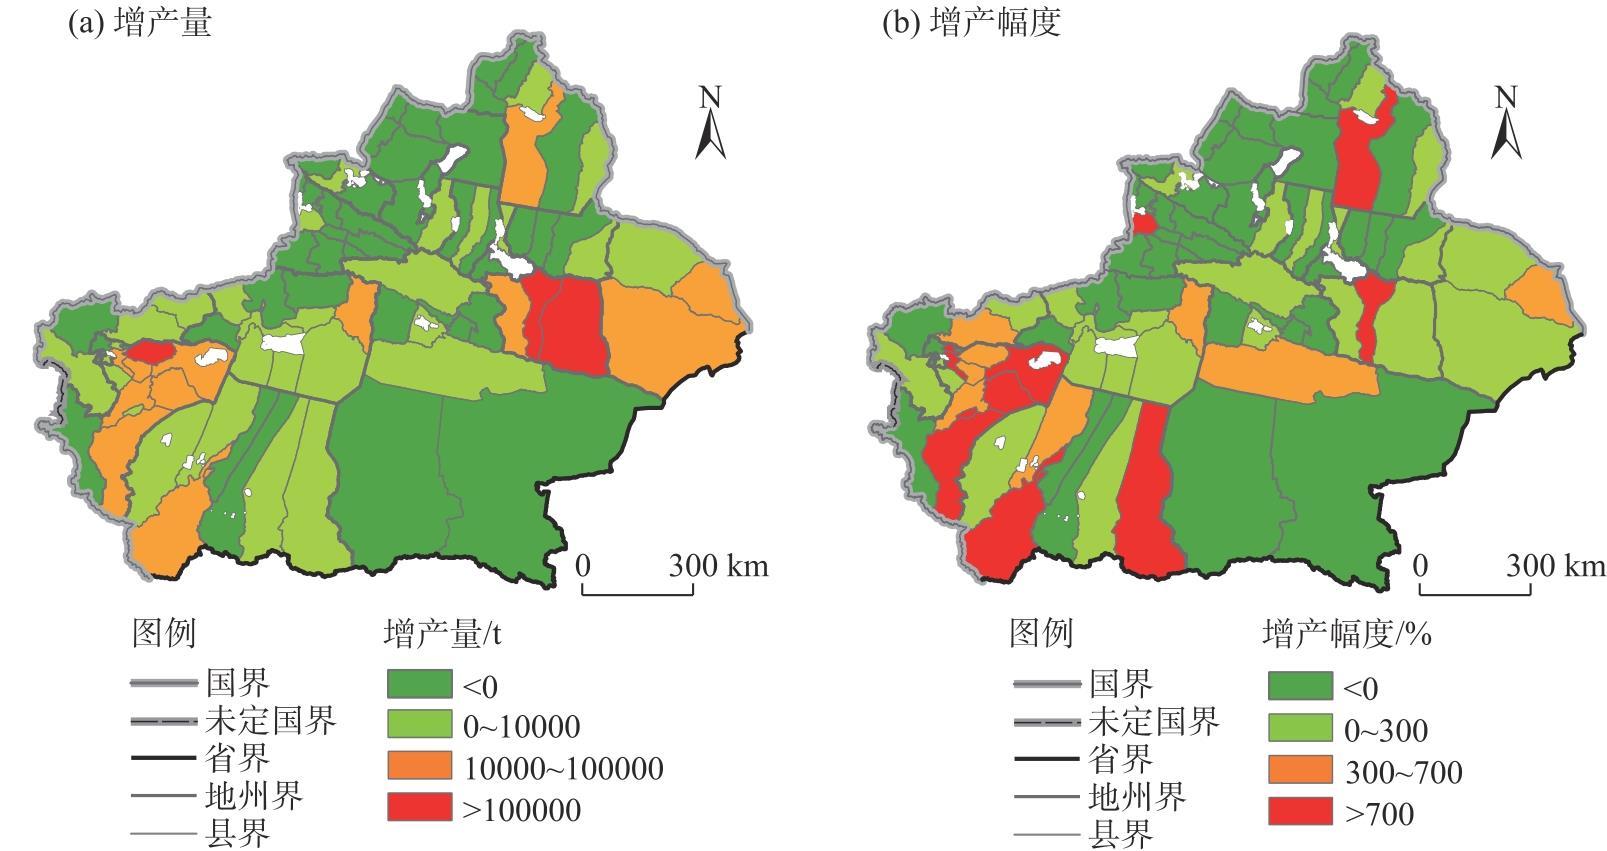
This study explores the production dynamics and yield growth patterns of muskmelons in Xinjiang, China, to enhance farmers’ income in underdeveloped regions and optimize the structure of economic crops. Employing methods such as the gravity center model, standard deviational ellipse, and logarithmic mean Divisia index decomposition, it examines muskmelon production patterns and contributory factors at the county level from 2000 to 2021. The findings are as follows: (1) From 2000 to 2021, muskmelon production in Xinjiang exhibited significant growth, with planting areas and total output following an “M-shaped” fluctuation trend. Yield per unit area peaked in 2015 but subsequently declined, exerting a notable impact on total production changes. (2) The ratio of counties with increased production to those with decreased production was 1.39:1. The production gravity center shifted gradually from the southwest to the northeast, highlighting significant spatial distribution changes. (3) Planting area and yield per unit area were the primary drivers of production changes. However, from 2015 to 2021, yield per unit area decline negatively impacted production, with a contribution rate of -124.38%.
Key words: muskmelon; spatiotemporal pattern; contribution factors; Xinjiang
Liangliang LI , Yong XIA , Fuhong WANG , Bingxin GUO , Lanlan ZHAO . Muskmelon production pattern and its contributing factors in Xinjiang[J]. Arid Land Geography, 2025 , 48(9) : 1567 -1577 . DOI: 10.12118/j.issn.1000-6060.2024.631
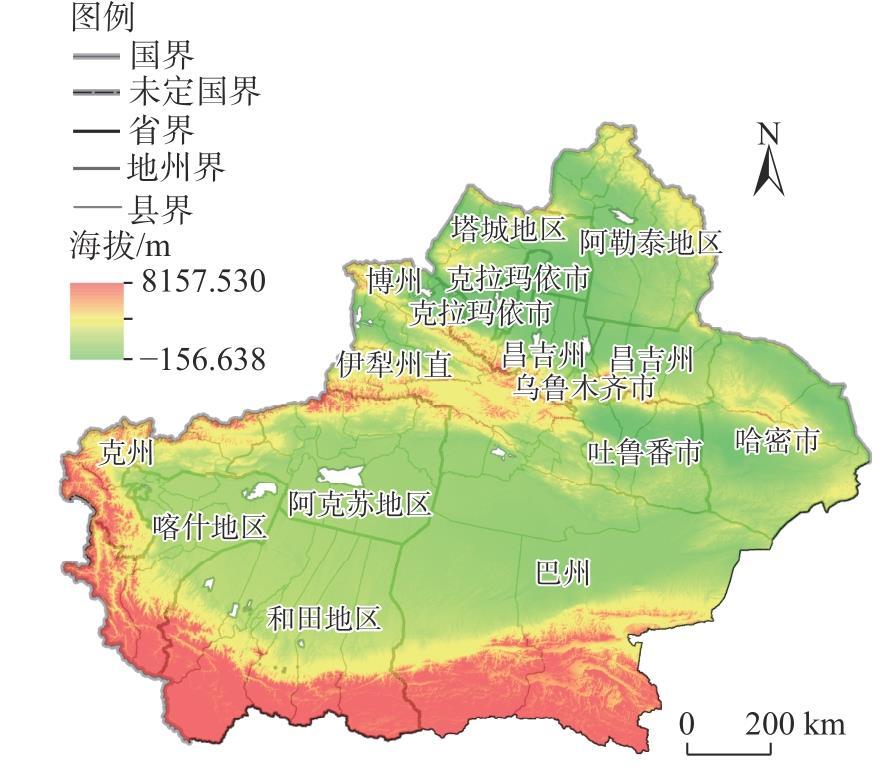
图6 2000—2021年新疆甜瓜产量标准差椭圆及重心迁移轨迹Fig. 6 Standard deviation ellipse and gravity center migration trajectory of muskmelon yield in Xinjiang from 2000 to 2021 |
表1 2000—2021年新疆甜瓜生产重心迁移及标准差椭圆参数Tab. 1 Gravity center migration and standard deviation ellipse parameters of muskmelon production in Xinjiang from 2000 to 2021 |
| 年份 | 重心坐标 | 重心迁移 | 长轴/km | 短轴/km | 转角/(°) | 面积/105 km2 | ||||
|---|---|---|---|---|---|---|---|---|---|---|
| 经度/E | 纬度/N | 方向 | 距离/km | 速率/km∙a-1 | ||||||
| 2000 | 84°29′25″ | 42°03′28″ | - | - | - | 757.33 | 247.83 | 79.93 | 5.88 | |
| 2010 | 80°37′22″ | 39°46′54″ | 西南 | 498.60 | 49.86 | 706.58 | 196.12 | 82.98 | 4.37 | |
| 2015 | 81°27′16″ | 40°21′46″ | 东北 | 112.72 | 22.54 | 766.25 | 194.32 | 81.84 | 4.69 | |
| 2021 | 82°44′41″ | 40°58′27″ | 东北 | 158.65 | 26.44 | 801.11 | 190.78 | 80.91 | 4.80 | |
表2 2000—2021年新疆甜瓜增产贡献情况Tab. 2 Contribution of muskmelon yield increase in Xinjiang from 2000 to 2021 |
| 年份 | 增产量/104 t | 种植面积贡献量/104 t | 种植面积贡献率/% | 单产贡献量/104 t | 单产贡献率/% | 贡献类型 |
|---|---|---|---|---|---|---|
| 2000—2010 | 171.36 | 81.67 | 47.66 | 89.69 | 52.34 | 共同主导 |
| 2010—2015 | 66.30 | -42.60 | -64.25 | 108.90 | 164.25 | 单产主导 |
| 2015—2021 | -66.41 | 82.60 | -124.38 | -149.01 | 224.38 | 单产主导 |
| 2000—2021 | 171.25 | 100.00 | 58.39 | 71.25 | 41.61 | 共同主导 |
表3 2000—2021年新疆各县域甜瓜增产情况Tab. 3 Yield increase of muskmelon in each county of Xinjiang from 2000 to 2021 |
| 分区 | 地州市 | 县域 | 增产量/t | 产量变化幅度/% | 种植面积贡献率/% | 单产贡献率/% |
|---|---|---|---|---|---|---|
| 南疆 | 喀什地区 | 伽师县 | 541950 | 652.56 | 86.42 | 13.58 |
| 喀什市 | 6542 | 65420.00 | 51.32 | 48.84 | ||
| 巴楚县 | 64074 | 701.41 | 61.88 | 38.12 | ||
| 麦盖提县 | 51940 | 1545.83 | 62.97 | 37.03 | ||
| 疏勒县 | 43326 | 763.59 | 58.71 | 41.29 | ||
| 和田地区 | 和田县 | 30785 | 4629.32 | 11.54 | 88.46 | |
| 巴州 | 且末县 | -4563 | -67.23 | 148.63 | -48.63 | |
| 东疆 | 吐鲁番市 | 鄯善县 | 146530 | 226.19 | 83.82 | 16.18 |
| 高昌区 | 137991 | 1314.33 | 93.80 | 6.20 | ||
| 托克逊县 | 46447 | 187.29 | 73.55 | 26.45 | ||
| 哈密市 | 伊吾县 | 66129 | 366.28 | 53.52 | 46.48 | |
| 伊州区 | 32879 | 254.92 | 71.31 | 28.69 | ||
| 北疆 | 阿勒泰地区 | 福海县 | 46570 | 887.05 | 77.63 | 22.37 |
| 昌吉州 | 阜康市 | -3805 | -67.23 | 89.91 | 10.09 | |
| 奇台县 | -6230 | -98.28 | 94.58 | 5.42 | ||
| 昌吉市 | -16584 | -59.06 | 101.84 | -1.84 | ||
| 伊犁州直 | 察布查尔锡伯自治县 | 1845 | 1476.00 | 60.14 | 39.86 |
注:因篇幅限制,新疆86个县域甜瓜增产情况未作全部展示,仅展示部分县域情况。巴州、昌吉州、伊犁州直分别为巴音郭楞蒙古自治州、昌吉回族自治州、伊犁哈萨克自治州直属县市的简称。 |
| [1] |
|
| [2] |
李干琼, 王志丹. 新疆西瓜甜瓜绿色生产调查研究[J]. 中国瓜菜, 2020, 33(6): 59-62.
[
|
| [3] |
周忠丽, 夏英, 曲颂. 甜瓜生产经营收益影响因素分析——以新疆瓜农样本为例[J]. 中国蔬菜, 2013(14): 17-24.
[
|
| [4] |
唐华俊, 吴文斌, 杨鹏, 等. 农作物空间格局遥感监测研究进展[J]. 中国农业科学, 2010, 43(14): 2879-2888.
[
|
| [5] |
白桂萍, 谢雄泽, 谢捷, 等. 我国油菜生产布局时空演变及影响因素分析[J]. 中国油脂, 2023, 48(4): 1-6.
[
|
| [6] |
陈光燕, 司伟, 蓝红星. 中国糖料生产布局变动及其影响因素分析[J]. 中国农业资源与区划, 2021, 42(3): 158-166.
[
|
| [7] |
蔡荣, 陶素敏. 中国粮食生产布局演变及空间机制分解: 1978-2018[J]. 干旱区资源与环境, 2021, 35(6): 1-7.
[
|
| [8] |
冯珊珊, 张磊, 刘序, 等. 2000—2020年广东省耕地面积与粮食生产的时空演变特征[J]. 水土保持通报, 2024, 44(3): 252-262.
[
|
| [9] |
栾军强, 王荣成, 朱子媛, 等. 山东省粮食供需变动下农业生产格局研究[J]. 中国农业资源与区划, 2021, 42(8): 201-209.
[
|
| [10] |
李国景, 杨亚东, 刘洋, 等. 县域水稻生产区域差异与增产效应[J]. 中国农业大学学报, 2024, 29(10): 60-71.
[
|
| [11] |
张强强, 司瑞石, 施凡基, 等. 中国水果生产集中化水平的演进趋势[J]. 中国农业资源与区划, 2021, 42(2): 96-108.
[
|
| [12] |
刘华, 赵祎平, 王琳. 中国草莓生产空间布局变迁及影响因素研究[J]. 中国农业资源与区划, 2024, 45(12): 49-59.
[
|
| [13] |
马文江, 白妙琴, 阿迪力·艾合买提, 等. “双碳”目标下新疆粮食绿色全要素生产率的时空分异及驱动因素分析[J]. 干旱区地理, 2023, 46(12): 2029-2041.
[
|
| [14] |
崔涵, 王丙参, 周明生. 中国农业碳排放时空演进及驱动因素[J]. 中国生态农业学报(中英文), 2024, 32(7): 1097-1108.
[
|
| [15] |
陶源, 赵晓颖, 刘庆志. 水肥一体化技术的环境效应与经济效应分析——基于山东省苹果种植户的调研数据[J]. 中国农业资源与区划, 2023, 44(9): 60-70.
[
|
| [16] |
孙立新, 王晓君, 吴敬学, 等. 中国西瓜甜瓜生产区域布局变迁及驱动因素研究[J]. 中国农业资源与区划, 2023, 44(8): 42-51.
[
|
| [17] |
张志高, 李艳敏, 袁征, 等. 1988—2020年新疆棉花生产格局与贡献因素[J]. 农业资源与环境学报, 2024, 41(5): 1192-1200.
[
|
| [18] |
王海军, 张彬, 刘耀林, 等. 基于重心-GTWR模型的京津冀城市群城镇扩展格局与驱动力多维解析[J]. 地理学报, 2018, 73(6): 1076-1092.
[
|
| [19] |
夏利恒, 刘京, 尉芳, 等. 陕西渭北旱塬区耕地时空格局变化分析[J]. 农业工程学报, 2021, 37(5): 256-264.
[
|
| [20] |
宋戈, 张文琦. 粮食作物种植视角下东北粮食主产区耕地利用的时空分化特征[J]. 农业工程学报, 2020, 36(15): 1-8.
[
|
| [21] |
孙通, 封志明, 杨艳昭. 2003—2013年中国县域单元粮食增产格局及贡献因素研究[J]. 自然资源学报, 2017, 32(2): 177-185.
[
|
| [22] |
|
| [23] |
王福红, 夏咏. 干旱区主要农作物生产时空格局演化及影响因素分析——以新疆地区为例[J]. 干旱区地理, 2025, 48(3): 444-454.
[
|
| [24] |
杜国明, 张扬, 李全峰. 21世纪以来三江平原农作物种植结构演化研究[J]. 农业现代化研究, 2019, 40(5): 736-744.
[
|
| [25] |
屠爽爽, 简代飞, 龙花楼, 等. 广西主要农作物生产格局演变特征与机制研究[J]. 地理学报, 2022, 77(9): 2322-2337.
[
|
| [26] |
杨海钰, 马兴栋, 邵砾群. 区域要素禀赋变化与农业技术变迁路径差异——基于苹果产业视角和7个主产省的数据[J]. 湖南农业大学学报(社会科学版), 2018, 19(2): 16-22.
[
|
| [27] |
严茂林, 郭丹, 周晓亮, 等. 中国油茶增产格局及其贡献因素分析[J]. 中国油料作物学报, 2025, 47(1): 9-19.
[
|
/
| 〈 |
|
〉 |