
Spatiotemporal differentiation pattern and driving factors of common prosperity level in Ningxia county areas
Received date: 2024-07-22
Revised date: 2024-09-23
Online published: 2026-03-11
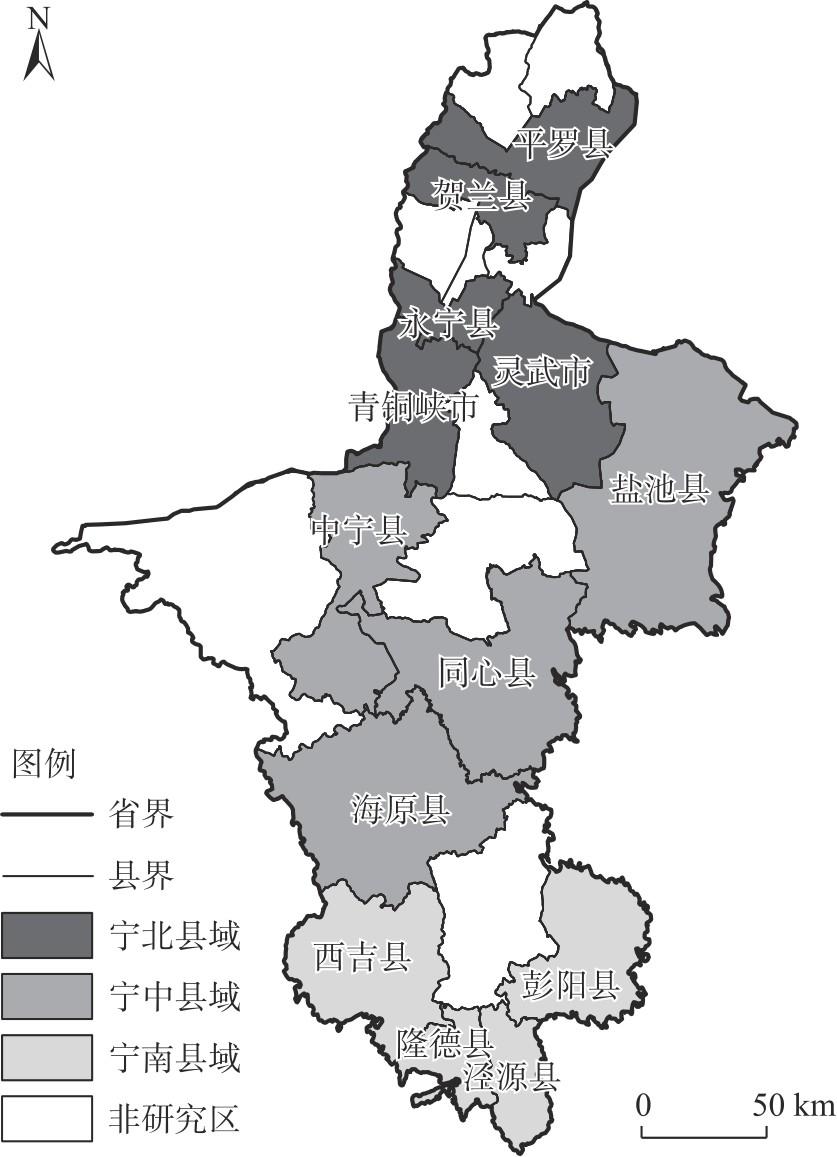
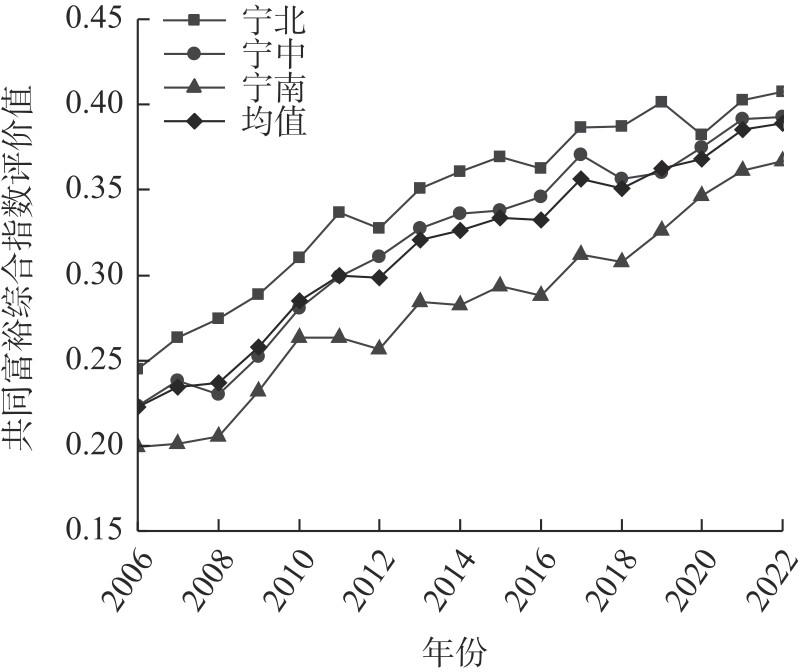
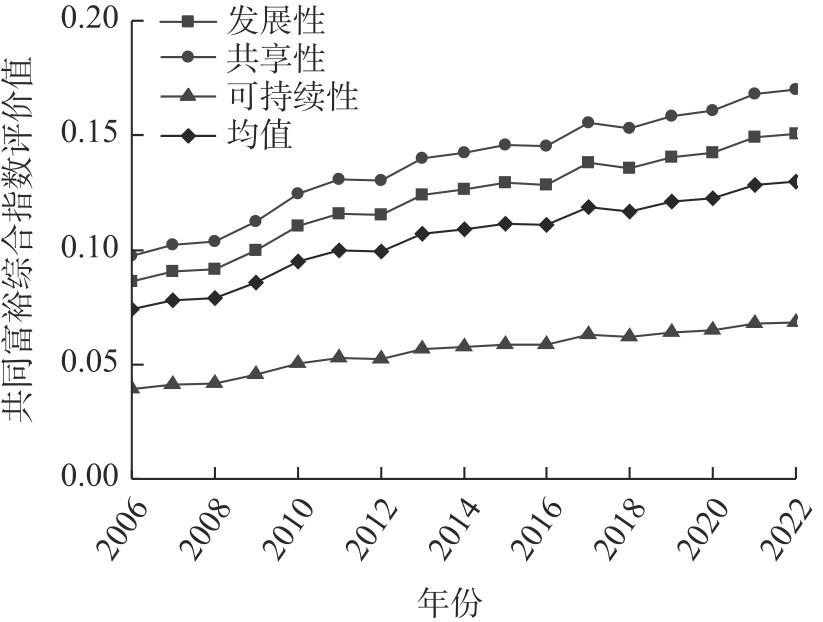
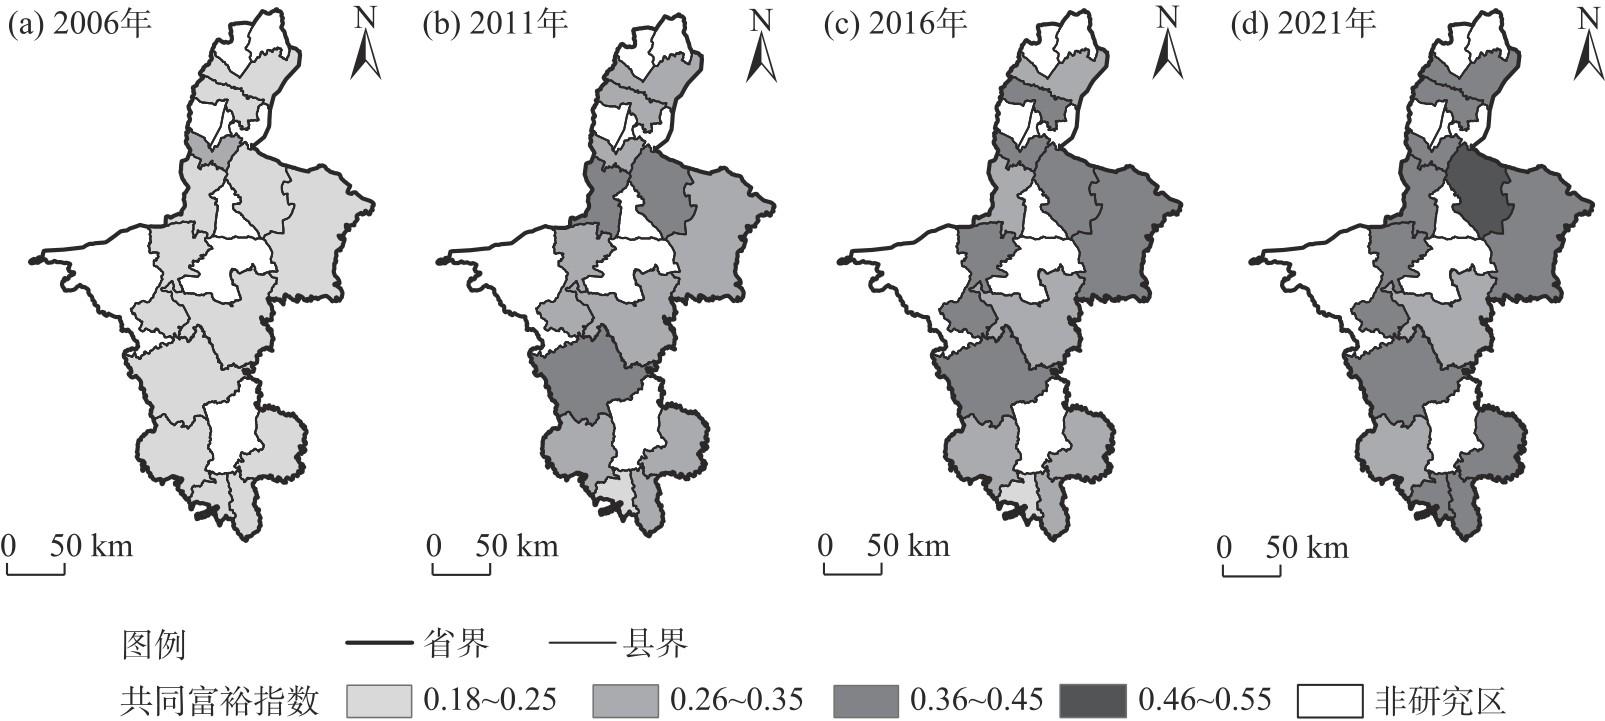
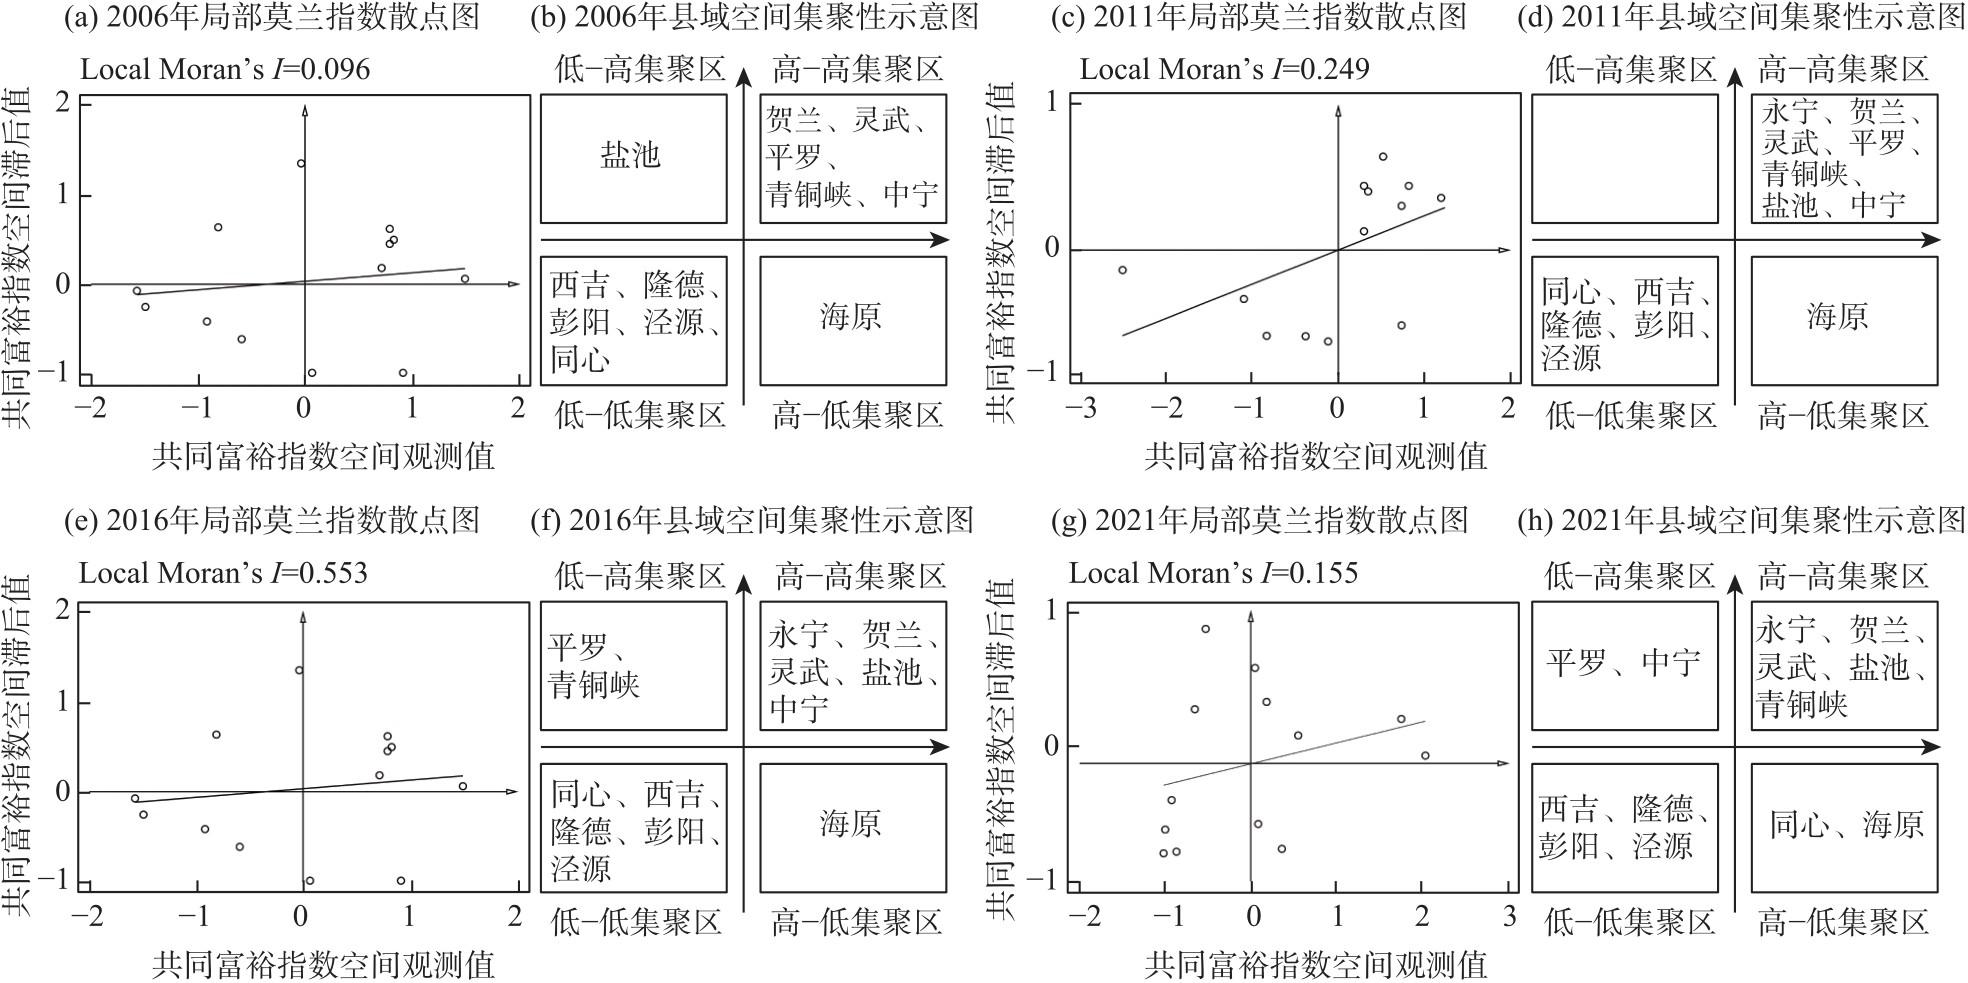
This study describes the gradual achievement of common prosperity as a goal and a path of Chinese-style modernization. Using panel data from Ningxia county areas from 2006 to 2022, we develop a comprehensive evaluation index system for assessing common prosperity at the county level, We employ exploratory spatial data analysis, the Thiel index, and baseline regression analysis to investigate the spatiotemporal differentiation patterns and driving factors affecting the common prosperity levels in Ningxia counties. The results show the following. (1) From 2006 to 2022, the level of common prosperity in Ningxia county areas generally exhibited an upward trend; however, the growth rates in northern, central, and southern regions of Ningxia varied significantly across different dimensions of the index. (2) According to the Thiel index, disparities in common prosperity development have regularly existed in Ningxia county areas, but the overall inequality has been gradually decreasing. Notably, the growth rate of the disparity between groups has far exceeded that of the disparity within groups. (3) The level of common prosperity in Ningxia county areas has transformed overall to a higher level, presenting a “patchy distribution” spatial pattern with significant clustering characteristics. (4) The progression toward common prosperity in Ningxia county areas has been relatively slow, driven positively by factors such as economic development, education levels, industrial structure, and infrastructure. By contrast, the urbanization process has shown a stage-inhibitory effect on the advancement of common prosperity in these areas.
Key words: county areas; common prosperity; spatiotemporal pattern; driving factors; Ningxia
Xin WANG , Fang ZHENG , Lingyao HE , Haoliang HE , Ying HOU . Spatiotemporal differentiation pattern and driving factors of common prosperity level in Ningxia county areas[J]. Arid Land Geography, 2025 , 48(7) : 1293 -1303 . DOI: 10.12118/j.issn.1000-6060.2024.443
表1 宁夏县域共同富裕水平综合评价指标体系Tab. 1 Comprehensive evaluation index system of common prosperity level in Ningxia county areas |
| 维度 | 指标 | 指标释义 | 权重/% | 属性 | 参考 来源 | ||
|---|---|---|---|---|---|---|---|
| EWM | CRITIC | 组合 | |||||
| 发展性 | 人均GDP | 地区经济发展水平 | 4.580 | 3.121 | 3.851 | + | [10,21] |
| 人均社会消费品零售额 | 地区消费实力 | 5.594 | 4.455 | 5.024 | + | [10] | |
| 经济稳定性 | 地区经济运行稳定状况 | 12.568 | 7.154 | 9.861 | + | [7] | |
| 二三产业增加值占GDP比重 | 产业结构合理性 | 2.885 | 5.031 | 3.958 | + | [21] | |
| 常住人口城镇化率 | 人口城镇化水平 | 3.408 | 5.377 | 4.392 | + | [22] | |
| 城乡就业率 | 居民就业情况 | 3.495 | 6.936 | 5.215 | + | [23] | |
| 城乡居民收入泰尔指数 | 城乡收入差距 | 3.875 | 6.642 | 5.259 | - | [22] | |
| 地区发展差异系数 | 地区发展差距 | 2.292 | 4.127 | 3.209 | - | [10] | |
| 共享性 | 每万人口普通中学在校学生数 | 地区受教育状况 | 3.422 | 6.230 | 4.826 | + | [24] |
| 每万人口小学在校学生数 | 地区受教育状况 | 4.002 | 6.990 | 5.496 | + | [24] | |
| 每千人口医疗卫生机构床位数 | 医疗资源分配均等化程度 | 3.314 | 4.262 | 3.788 | + | [11] | |
| 每千人口执业医师数 | 医疗资源分配均等化程度 | 3.301 | 4.735 | 4.018 | + | [11] | |
| 图书馆机构数 | 公共文化服务水平 | 12.776 | 2.795 | 7.786 | + | [25] | |
| 群众文化机构数 | 公共文化服务水平 | 4.763 | 4.333 | 4.548 | + | [26] | |
| 人均交通运输用地面积 | 地区交通便利程度 | 8.918 | 3.408 | 6.163 | + | [23,27] | |
| 农村家庭每百户移动电话 | 居民网络通信程度 | 3.192 | 5.136 | 4.164 | + | [11] | |
| 可持续性 | 全社会劳动生产率 | 经济高质量发展的能力 | 4.727 | 3.108 | 3.917 | + | [9] |
| 全体居民人均可支配收入 | 居民的收入状况 | 3.775 | 4.794 | 4.285 | + | [21] | |
| 财政自给率 | 地方的财政健康程度 | 6.987 | 7.396 | 7.192 | + | [10] | |
| 单位GDP废气排放量 | 地区生态环境优劣水平 | 2.125 | 3.968 | 3.047 | - | [17] | |
注:+表示正向指标;-表示负向指标;EWM为熵权法;CRITIC为复杂信息下的指标,客观权重计算法。 |
表2 宁夏县域共同富裕水平泰尔指数及贡献率Tab. 2 Thiel indices and contribution rates of common prosperity levels in Ningxia county areas |
| 年份 | 泰尔指数 | 贡献度/% | |||||
|---|---|---|---|---|---|---|---|
| 全域 | 宁北 | 宁中 | 宁南 | 组内 | 组间 | ||
| 2006 | 0.017 | 0.018 | 0.010 | 0.010 | 81.51 | 18.49 | |
| 2007 | 0.015 | 0.012 | 0.009 | 0.003 | 58.01 | 41.99 | |
| 2008 | 0.016 | 0.008 | 0.009 | 0.001 | 39.51 | 60.49 | |
| 2009 | 0.016 | 0.009 | 0.012 | 0.003 | 50.34 | 49.66 | |
| 2010 | 0.012 | 0.007 | 0.014 | 0.001 | 58.62 | 41.30 | |
| 2011 | 0.010 | 0.006 | 0.010 | 0.000 | 56.59 | 43.41 | |
| 2012 | 0.008 | 0.002 | 0.009 | 0.001 | 49.44 | 50.56 | |
| 2013 | 0.010 | 0.005 | 0.012 | 0.004 | 64.93 | 34.01 | |
| 2014 | 0.009 | 0.005 | 0.008 | 0.001 | 54.09 | 46.14 | |
| 2015 | 0.008 | 0.005 | 0.010 | 0.001 | 61.49 | 39.10 | |
| 2016 | 0.009 | 0.006 | 0.011 | 0.000 | 66.26 | 36.16 | |
| 2017 | 0.008 | 0.005 | 0.010 | 0.001 | 65.51 | 37.34 | |
| 2018 | 0.008 | 0.005 | 0.010 | 0.002 | 71.14 | 31.50 | |
| 2019 | 0.011 | 0.008 | 0.009 | 0.004 | 63.34 | 38.19 | |
| 2020 | 0.008 | 0.013 | 0.005 | 0.001 | 35.81 | 63.76 | |
| 2021 | 0.004 | 0.002 | 0.001 | 0.006 | 34.53 | 65.47 | |
| 2022 | 0.004 | 0.003 | 0.000 | 0.006 | 36.33 | 63.67 | |
| 均值 | 0.010 | 0.007 | 0.009 | 0.003 | 55.73 | 44.78 | |
表3 2006—2022年宁夏县域共同富裕水平 空间集聚性指数Tab. 3 Spatial agglomeration indices of common prosperity levels in Ningxia county areas from 2006 to 2022 |
| 年份 | 全局莫兰指数 | Z值 | 年份 | 全局莫兰指数 | Z值 |
|---|---|---|---|---|---|
| 2006 | 0.096* | 1.019 | 2015 | 0.594*** | 3.855 |
| 2007 | 0.404*** | 2.809 | 2016 | 0.553*** | 3.573 |
| 2008 | 0.438*** | 2.968 | 2017 | 0.358*** | 2.555 |
| 2009 | 0.419*** | 2.879 | 2018 | 0.464*** | 3.301 |
| 2010 | 0.249** | 2.122 | 2019 | 0.113** | 1.346 |
| 2011 | 0.315** | 2.254 | 2020 | 0.135** | 0.121 |
| 2012 | 0.423*** | 2.850 | 2021 | 0.114** | 0.476 |
| 2013 | 0.528*** | 3.432 | 2022 | 0.208** | 0.360 |
| 2014 | 0.507*** | 3.327 | - | - | - |
注:***、**、*分别表示在1%、5%、10%水平下显著。 |
表4 变量描述性统计Tab. 4 Descriptive statistics of variables |
| 变量 名称 | 变量符号 | 变量 描述 | 单位 |
|---|---|---|---|
| 共同富裕水平 | Cop | 县域共同富裕指数 | - |
| 经济水平 | X1 | 全体居民人均可支配收入 | 元·人-1 |
| 教育水平 | X2 | 每万人口普通中学在校学生数 | 人 |
| 城镇化水平 | X3 | 城镇常住人口占总人口比重 | % |
| 产业结构 | X4 | 二、三产业生产值与总产值之比 | % |
| 基础设施建设 | X5 | 人均交通运输用地面积 | km2·人-1 |
注:每个变量样本量均为221。 |
表5 共同富裕驱动因素基准回归及分样本回归检验结果Tab. 5 Test results of baseline regression and sub-sample regression for drivers of common prosperity |
| 变量 | 全域 | 宁北 | 宁中 | 宁南 |
|---|---|---|---|---|
| X1 | 0.217***(0.038) | 0.497***(0.125) | 0.295***(0.069) | 0.238***(0.533) |
| X2 | 0.064***(0.010) | 0.065***(0.019) | 0.072***(0.011) | 0.046***(0.013) |
| X3 | -0.011*(0.020) | -0.069*(0.039) | -0.012*(0.022) | -0.110***(0.031) |
| X4 | 0.098***(0.022) | 0.149**(0.049) | 0.097**(0.033) | 0.052*(0.035) |
| X5 | 0.120***(0.021) | 0.299***(0.076) | 0.075***(0.022) | 0.037*(0.070) |
| 自相关系数 | -0.062**(0.098) | -0.198**(0.114) | -0.369**(0.116) | -0.588***(0.146) |
| 方差 | 0.000313***(0.0000298) | 0.000272***(0.0000418) | 0.000111***(0.0000198) | 0.000113***(0.0000204) |
| 样本量 | 221 | 85 | 68 | 68 |
| 拟合优度 | 0.760 | 0.822 | 0.501 | 0.308 |
| 地点固定 | 是 是 | 是 是 | 是 是 | 是 是 |
| 时间固定 |
注:***、**、*分别表示在1%、5%、10%水平下显著;括号内数值表示标准差。下同。 |
表6 共同富裕驱动因素更换回归模型稳健性检验Tab. 6 Robustness tests of replacing regression models for drivers of common prosperity |
| 变量 | OLS模型 | GMM模型 |
|---|---|---|
| X1 | 0.208***(0.033) | 0.147**(0.055) |
| X2 | 0.050**(0.021) | 0.076*(0.079) |
| X3 | -0.065**(0.038) | -0.075*(0.066) |
| X4 | 0.008**(0.019) | 0.139*(0.063) |
| X5 | 0.078***(0.008) | 0.093***(0.021) |
| 常数项 | 0.130***(0.023) | 0.007*(0.058) |
| 样本量 | 195 | 182 |
| 拟合优度 | 0.574 | - |
| 拟合优度系数 | 0.563 | - |
注:OLS为最小二乘法;GMM为高斯混合模型。 |
| [1] |
江岳坤, 石鹏娟. 中国市域城乡收入差距时空演化及影响因素[J]. 干旱区地理, 2024, 47(1): 147-157.
[
|
| [2] |
蒋政. 共同富裕新论——基于平等理论的分析[J]. 岭南学刊, 2014(1): 22-26.
[
|
| [3] |
刘晴, 卢凤君, 李保明, 等. 县域共同富裕与中国式现代化的路径模式研究——来自浙江山区共同富裕示范区县域样板缙云县的证据[J]. 中国软科学, 2024( 增刊1): 441-453.
[
|
| [4] |
贾科利, 李小雨, 魏慧敏, 等. 宁夏县域土地利用碳排放空间分异与风险研究[J]. 干旱区地理, 2023, 46(11): 1757-1767.
[
|
| [5] |
冯苑, 聂长飞. 共同富裕评价指标体系构建与实证测度[J]. 统计与决策, 2024, 40(2): 73-77.
[
|
| [6] |
杨静, 陆树程. 新时代共同富裕的新要求——学习习近平关于共同富裕的重要论述[J]. 毛泽东邓小平理论研究, 2018(4): 24-29, 107.
[
|
| [7] |
徐政, 郑霖豪. 高质量发展促进共同富裕的内在逻辑与路径选择[J]. 重庆大学学报(社会科学版), 2022, 28(4): 39-52.
[
|
| [8] |
彭刚, 杨德林, 杨琳. 中国市域尺度共同富裕水平格局及其影响因素[J]. 经济地理, 2023, 43(1): 44-54, 132.
[
|
| [9] |
韩建雨, 储海涛. 新型城镇化对共同富裕的影响效应及作用机制[J]. 统计与决策, 2023, 39(12): 126-131.
[
|
| [10] |
廖洋一, 苏维词. 重庆三峡库区共同富裕水平时空分异特征与影响因素分析[J]. 地理与地理信息科学, 2023, 39(4): 54-62.
[
|
| [11] |
程静, 郝雯利, 杜震, 等. 长江经济带共同富裕水平的区域差异、分布动态与收敛性[J]. 生态经济, 2023, 39(11): 13-21.
[
|
| [12] |
刘培林, 钱滔, 黄先海, 等. 共同富裕的内涵、实现路径与测度方法[J]. 管理世界, 2021, 37(8): 117-129.
[
|
| [13] |
李金昌, 余卫. 共同富裕统计监测评价探讨[J]. 统计研究, 2022, 39(2): 3-17.
[
|
| [14] |
黄祖辉, 张淑萍. 中国共同富裕发展的时代背景与“提低”路径[J]. 江苏大学学报(社会科学版), 2022, 24(4): 1-7, 34.
[
|
| [15] |
粟路军, 叶成志, 何学欢. 文旅融合发展促进共同富裕的理论逻辑与实现路径[J]. 经济地理, 2023, 43(11): 198-207.
[
|
| [16] |
李敏. 实现农村共同富裕的数字化路径研究[J]. 农业经济, 2024(1): 128-129.
[
|
| [17] |
张瑞萍. 生态环境保护推进共同富裕: 时代内涵、价值意蕴与实现路径[J]. 广西社会科学, 2023(9): 26-33.
[
|
| [18] |
黄斌, 李波, 方超. 教育促进共同富裕的独特作用: 理论应然与经验实然[J]. 华东师范大学学报(教育科学版), 2023, 41(10): 12-26.
[
|
| [19] |
江剑平. 中国式现代化下的共同富裕: 理论内涵与实践路径[J]. 当代经济管理, 2024, 46(1): 1-9.
[
|
| [20] |
陈燕. 中国共产党的共同富裕: 理论演进与实现路径[J]. 科学社会主义, 2021(3): 115-120.
[
|
| [21] |
陈宗胜, 杨希雷. 论中国共同富裕测度指标和阶段性进展程度[J]. 经济研究, 2023, 58(9): 79-97.
[
|
| [22] |
刘海龙, 唐飞, 丁娅楠, 等. 山西省县域高质量发展与生态系统服务耦合的时空演变特征[J]. 干旱区研究, 2022, 39(4): 1234-1245.
[
|
| [23] |
张明斗, 乔雪蓓. 新型城镇化促进共同富裕的效应与机制研究[J]. 郑州大学学报(哲学社会科学版), 2023, 56(1): 48-55.
[
|
| [24] |
罗蓉, 何黄琪, 陈爽. 原连片特困地区共同富裕能力评价及其演变跃迁[J]. 经济地理, 2022, 42(8): 154-164.
[
|
| [25] |
冯苑, 聂长飞. 中国共同富裕的时空演进、区域差异及收敛性研究[J]. 经济与管理研究, 2022, 43(12): 65-84.
[
|
| [26] |
张广海, 刘二恋, 董跃蕾. 中国区域共同富裕实践中乡村旅游作用机制[J]. 自然资源学报, 2023, 38(2): 387-402.
[
|
| [27] |
李顺毅, 张洪峰. 中国共同富裕推进能力的演化特征与空间关系[J]. 统计与信息论坛, 2024, 39(1): 103-117.
[
|
| [28] |
王芳蕾, 张磊, 翟富祥. 基于EWM-CRITIC-TOPSIS模型的新疆典型自然景观评估[J]. 自然资源遥感, 2025, 37(1): 94-101.
[
|
| [29] |
王滨. 城镇化高质量发展测度及其时空差异研究[J]. 统计与决策, 2019, 35(22): 46-50.
[
|
| [30] |
赵杨, 王京, 潘为华. 中国省域新型城镇化水平与绿色发展水平的区域特征及其影响机制[J]. 经济地理, 2023, 43(9): 1-9.
[
|
/
| 〈 |
|
〉 |